
NOROVIEW vs TradingView for Order Flow: What TradingView Can't Show You
NOROVIEW vs TradingView for order flow trading: why most TradingView order flow indicators approximate delta from candle data, what real Level 2 requires, and what CME real-time data costs on each.
NOROVIEW vs TradingView for Order Flow: What TradingView Can't Show You
TradingView is the best general charting platform on the internet and it is not close. This page is not an argument against using it — most NOROVIEW users keep a TradingView tab open. It is an argument about one specific job: reading order flow. There, the honest answer is that most of what gets sold as a TradingView order flow indicator is reconstructed from candle data, and reconstruction is not the same as the order book.
Disclosure. We build NOROVIEW, so read this the way you would read any vendor's comparison page. What we can offer instead of neutrality is checkable numbers: every competitor figure below was taken from that vendor's own pricing page on 13 August 2026, not from a review site — the review sites disagreed with the vendors on nearly every number we checked. Where a competitor is better, it says so. If anything here is out of date, tell us and we will correct it.
The short version
Use TradingView for everything it is famous for: charting, drawing, screening, alerts, Pine Script, the social layer, and a symbol list that covers most of the investable world. Nothing here replaces that.
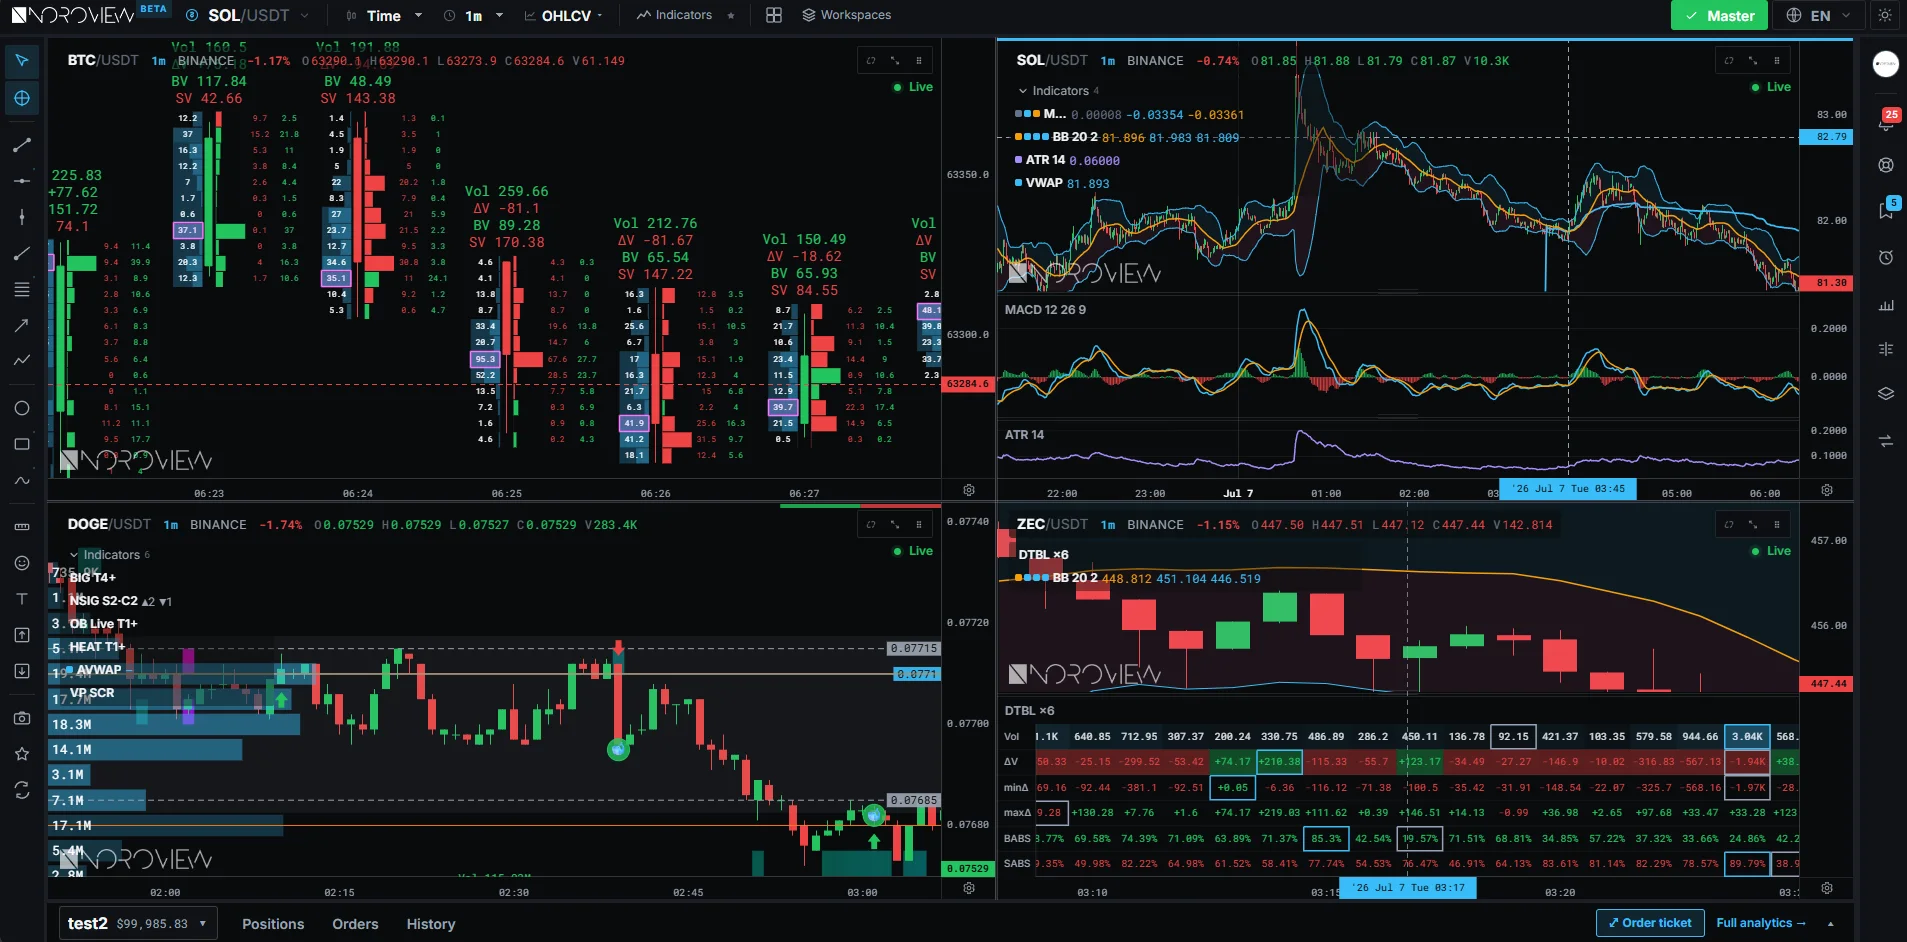
Use NOROVIEW for the order book itself — Level 2 depth, a liquidity heatmap, footprint candles built from real trade data, and a filtered tape. They are complementary tools and plenty of people run both.
Start free if you want to try it without a card: Open NOROVIEW free.
The part that matters: where the numbers come from
A footprint chart splits every bar into bid-side and ask-side volume at each price. To draw a true one you need the trade stream with the aggressor side on each print — was this a buyer lifting the offer or a seller hitting the bid? To draw a heatmap or a DOM you need Level 2: every resting price level and the size waiting there.
Many popular TradingView order flow scripts do not have either. They estimate delta by splitting a candle's volume according to where the close sits in the range, or by dropping to a lower timeframe and inferring direction from the candle's shape. That estimate is often directionally right, and on a slow market it looks convincing. It is still an inference from a summary, not a record of what traded.
The difference shows up exactly where it matters: absorption. A bar closing near its high on heavy ask-side volume that never moved price is a completely different event from a bar closing near its high because buyers pushed through thin liquidity. Both produce a similar candle. A true footprint separates them; an approximation usually cannot. We wrote a full lesson on what Level 1 and Level 2 data each contain if you want the mechanics.
To be fair to TradingView: it does offer volume footprint on its paid plans and market depth (DOM) from Plus upwards, and its real-time exchange data is legitimate. The caution is about the third-party indicator ecosystem, not about TradingView's own first-party data products.
What each platform charges for real-time CME data
Both platforms run in a browser, so this is the cleanest possible comparison — and the difference is structural rather than a few dollars.
TradingView's pricing page states that extra real-time and intraday data for exchanges — NASDAQ, NYSE, NYSE ARCA, OTC, CME and others — is added separately to your account. So live CME data is an add-on on top of whatever plan you are on, and DOM requires Plus or above.
NOROVIEW includes real-time CME futures — live session, live candles, Time & Sales, order book and heatmap — on every paid plan starting at $19/month. There is no separate data line.
We are deliberately not printing TradingView's plan prices in a comparison table here. Their pricing page served us euro figures on annual billing, which are not comparable to the monthly dollar prices elsewhere in this series, and publishing a converted number would be exactly the kind of sloppy comparison this series exists to avoid. Check their page for your own currency and billing period.
Where TradingView is stronger
Everything that is not order flow. Said plainly because it is true. Symbol coverage across equities, forex, futures, crypto and indices. The best drawing tools in the business. Screeners, alerts, watchlists, multi-timeframe layouts.
Pine Script. An enormous community library and a language you can learn in an afternoon. NOROVIEW has no scripting at all.
The social and publishing layer. Ideas, charts, followings. There is no equivalent anywhere.
Broker integrations. You can trade from a TradingView chart through supported brokers. NOROVIEW is analysis only.
Free tier reach. Their free plan is more useful for general charting than ours is for general charting, because general charting is their job.
Where NOROVIEW is stronger
Real Level 2, not an approximation. Order book depth streamed and rendered as a ledger and a heatmap, at 100 levels on Basic, 900 on Pro and 1000 on Master.
Footprint candles from actual trade data, with the aggressor side known rather than inferred.
A filtered tape. NORO Time & Sales aggregates and filters by size tier so you see the orders that matter instead of a scrolling wall.
Real-time CME included at $19 rather than added as a data subscription.
Purpose-built. Every screen is for reading flow. That is a limitation as much as a strength — but if flow is what you are doing, it is the right limitation.
Feature comparison
| NOROVIEW | TradingView | |
|---|---|---|
| General charting and drawing | Basic | Best in class |
| Symbol coverage | Binance crypto + CME futures | Global, enormous |
| Footprint charts | Yes, from real trade data | Volume footprint on paid plans |
| Level 2 / DOM | Yes — 100 / 900 / 1000 levels | Market Depth from Plus upwards |
| Liquidity heatmap | Yes, from $19 | Not a first-party feature |
| Filtered tape | Yes — NORO Time & Sales | Basic time and sales |
| Real-time CME data | Included from $19 | Separate paid add-on |
| Scripting | No | Pine Script |
| Screeners and alerts | Alarms only | Extensive |
| Execution | No | Via supported brokers |
| Runs in | Browser | Browser |
What real-time US futures order flow actually costs
Software price is the number vendors advertise. For CME order flow it is rarely the number you pay, because on several platforms the market data is a separate line item. This is the comparison that matters, all-in:
| Platform | Software | Real-time futures data | All-in / month | Runs in |
|---|---|---|---|---|
| NOROVIEW Basic | $19 | Included | $19 | Browser |
| Exocharts Desktop Pro | $49 | dxFeed included | $49 + VAT | Desktop |
| Bookmap Global | $49 | + $34 BookmapData | $83 | Desktop |
| ATAS PRO | €69.95 | Included in PRO | €69.95 + VAT | Desktop |
| Quantower | $70 | Purchased separately | $70+ | Desktop |
| Sierra Chart | $36–$56 | Denali + exchange fees | $36+ and up | Desktop |
| TradingView Plus+ | Plan price | CME add-on, extra | Plan + add-on | Browser |
Two things are worth saying plainly about that table. Bookmap's advertised $49 is not the price of futures order flow — BookmapData futures is $34/mo on top, so the real figure is $83. And NOROVIEW and TradingView are the only two that run in a browser, but TradingView bills CME real-time data as a separate add-on. That is the whole argument for NOROVIEW in one row.
Where NOROVIEW is the wrong choice
NOROVIEW covers Binance only for crypto — Exocharts reaches five exchanges and Bookmap more than twenty. It is analysis only: no execution, no broker routing, so you trade through your own broker or exchange. Historical tick depth and replay do not go as deep as Exocharts' six years. And futures data on the free plan is last-closed-session history rather than a live feed — real-time CME starts at $19.
Against TradingView specifically: if you need broad symbol coverage, screeners, Pine Script or the best drawing tools, keep using TradingView. Most people should run both — TradingView for the map, an order flow terminal for the tape.
Frequently asked questions
Does TradingView have real order flow data?
TradingView offers volume footprint on paid plans and market depth from Plus upwards, and its real-time exchange data is legitimate — but it is a separately purchased add-on per exchange. The caution is about third-party Pine indicators that estimate delta from candle data rather than from the trade stream.
Are TradingView order flow indicators accurate?
It depends entirely on the data behind them. An indicator that reconstructs delta by splitting candle volume is an approximation, and it breaks down precisely on absorption — the situation you most want it for. Indicators driven by genuine tick data with aggressor side are a different matter.
Can I get Level 2 data on TradingView?
Market Depth is available from the Plus plan upwards, with real-time exchange data added to your account separately. For crypto, order book depth is published freely by the exchanges, which is why crypto order flow is cheaper to access than equities.
Should I replace TradingView with NOROVIEW?
Probably not — they do different jobs. Use TradingView for charting, screening and drawing, and an order flow terminal for the book and the tape. Most of our users run both.
What is the cheapest way to get real-time CME order flow in a browser?
Of the platforms in this comparison series, NOROVIEW at $19/month with the data included. TradingView is the only other browser platform here, and it bills CME real-time data as a separate add-on on top of a paid plan.
Sources
Every figure above was read from the vendor's own page on 13 August 2026. Prices change — check before you subscribe.
- TradingView — pricing — https://www.tradingview.com/pricing/
- NOROVIEW — plans and features — https://noroview.com/pricing
More comparisons in this series:
NOROVIEW vs Exocharts · NOROVIEW vs Bookmap · NOROVIEW vs ATAS · NOROVIEW vs Sierra Chart
Soroosh Moghimi — six years inside financial markets: algorithmic trading, HFT, crypto and AI, after a decade building startups. He publishes this material free because he already paid for the lessons in it. There is no paid course and no signal group. @sorooshmoghimi · About
See it on your own screen
The free plan is real-time on crypto, includes the footprint chart and paper trading, needs no card and does not expire. Real-time CME futures, the customizable NORO footprint, the liquidity heatmap and the low-latency feed start at $19/month.
Open NOROVIEW free → · Compare plans →
⚠️ DISCLAIMER — EDUCATIONAL CONTENT ONLY
This article is for educational and informational purposes only. It is not financial, investment, or trading advice, and nothing in it is a recommendation to buy, sell, or hold any asset. Trading cryptocurrencies and leveraged derivatives is high risk and can result in the loss of some or all of your capital. Only risk money you can afford to lose. Comparisons and prices reflect what each vendor published on 13 August 2026 and change without notice — always check the vendor's own pricing page before subscribing. Always do your own research. You alone are responsible for your decisions.
Keep reading
Related posts
The Best Footprint Chart Software in 2026
Six platforms that draw genuine footprint charts, compared on verified pricing — including which ones hide footprint behind a higher service package or a separately paid extension.
The Best Order Flow Platform for Mac in 2026
Most order flow software is Windows-first desktop software, which is why Mac traders end up running Parallels. Here is what genuinely works on macOS in 2026, ranked by how much friction it costs.
The Best Free Order Flow Software in 2026 (What Each Free Tier Really Gives You)
Four permanent free order flow tiers compared honestly — Bookmap Digital, ATAS Start, Exocharts free and NOROVIEW free — including the delays and limits each vendor words carefully.
The Best Level 2 Data Platform in 2026 (And What Level 2 Really Costs)
Where Level 2 market data actually comes from, why crypto depth is free and futures depth is not, what each platform charges, and how much depth you actually need.
The Best Order Flow Trading Platform in 2026 (Tested and Priced)
Six order flow platforms compared on pricing verified from each vendor's own page: Exocharts, Bookmap, ATAS, Quantower, Sierra Chart and NOROVIEW — with the real all-in cost of real-time CME data.
NOROVIEW vs Sierra Chart: Numbers Bars, Packages and Data Fees
NOROVIEW vs Sierra Chart compared: which service package unlocks Numbers Bars and market depth, what the Denali feed and exchange fees add, and when a browser platform is the better answer.
Discussion (0)
Want to join the discussion? Comments live inside the platform.
Open NOROVIEW