
2. Level 1 vs Level 2 Market Data: Why Most Traders Are Trading Blind
Level 1 vs Level 2 market data explained: what each stream contains, what the order book can and can't tell you, and why Bitcoin has a different price on every exchange.
2. Level 1 vs Level 2 Market Data: Why Most Traders Are Trading Blind
Level 1 vs Level 2 market data is the difference between the top of the market and the whole market. Level 1 gives you the last traded price, the best bid, the best ask, the size at those two prices, and total volume. Level 2 gives you the full order book — every price with resting orders on it and how much size is waiting at each one, on both sides. Almost every retail trader has only ever seen Level 1, and that is why so many candles seem to "lie."
Everything in this lesson runs on a free account — open NOROVIEW in another tab and put the order book on screen while you read.
What you'll learn in this lesson
- The two data streams every exchange emits, and why one is a fact and the other is only a promise
- Exactly what Level 1 contains — and the four questions it structurally cannot answer
- How to read a Level 2 order book, and the honest limits of what it proves
- Why Bitcoin has a different price on every exchange, and what actually keeps those prices close
- Whether you can analyse on one venue and execute on another (yes — with four conditions)
- Which NOROVIEW tools are built from which stream, and how much to trust each one
Lesson 2 of 16 · Part 1 — Analysis. Part of the free order flow trading course. Previous: Order Flow Trading for Beginners. Next: How Price Really Moves.
▶ Prefer to watch it?
Order Flow & Level 2 Trading in Your Browser — NOROVIEW Full Course (Ep 1) walks the terminal end to end. For the tape specifically: Tape Reading Without the Noise — Time & Sales + Speed Meter (Ep 11)
Key terms
| Term | What it means |
|---|---|
| Level 1 data | Top of book: last price, best bid, best ask, size at those prices, total volume |
| Level 2 data | Depth of market: every resting price level and the size waiting at each, both sides |
| Order book | The live list of resting limit orders at an exchange |
| Spread | The gap between the best bid and the best ask |
| Time and sales (the tape) | The stream of completed trades, one by one, as they execute |
| Market by order (Level 3) | Individual orders rather than the total at each price. Professional-grade; not needed here |
| Spoofing | Placing large orders you never intend to fill, to influence other traders |
The two streams: trades and orders
Every exchange emits exactly two kinds of information, and understanding the difference between them makes half of order flow obvious later.
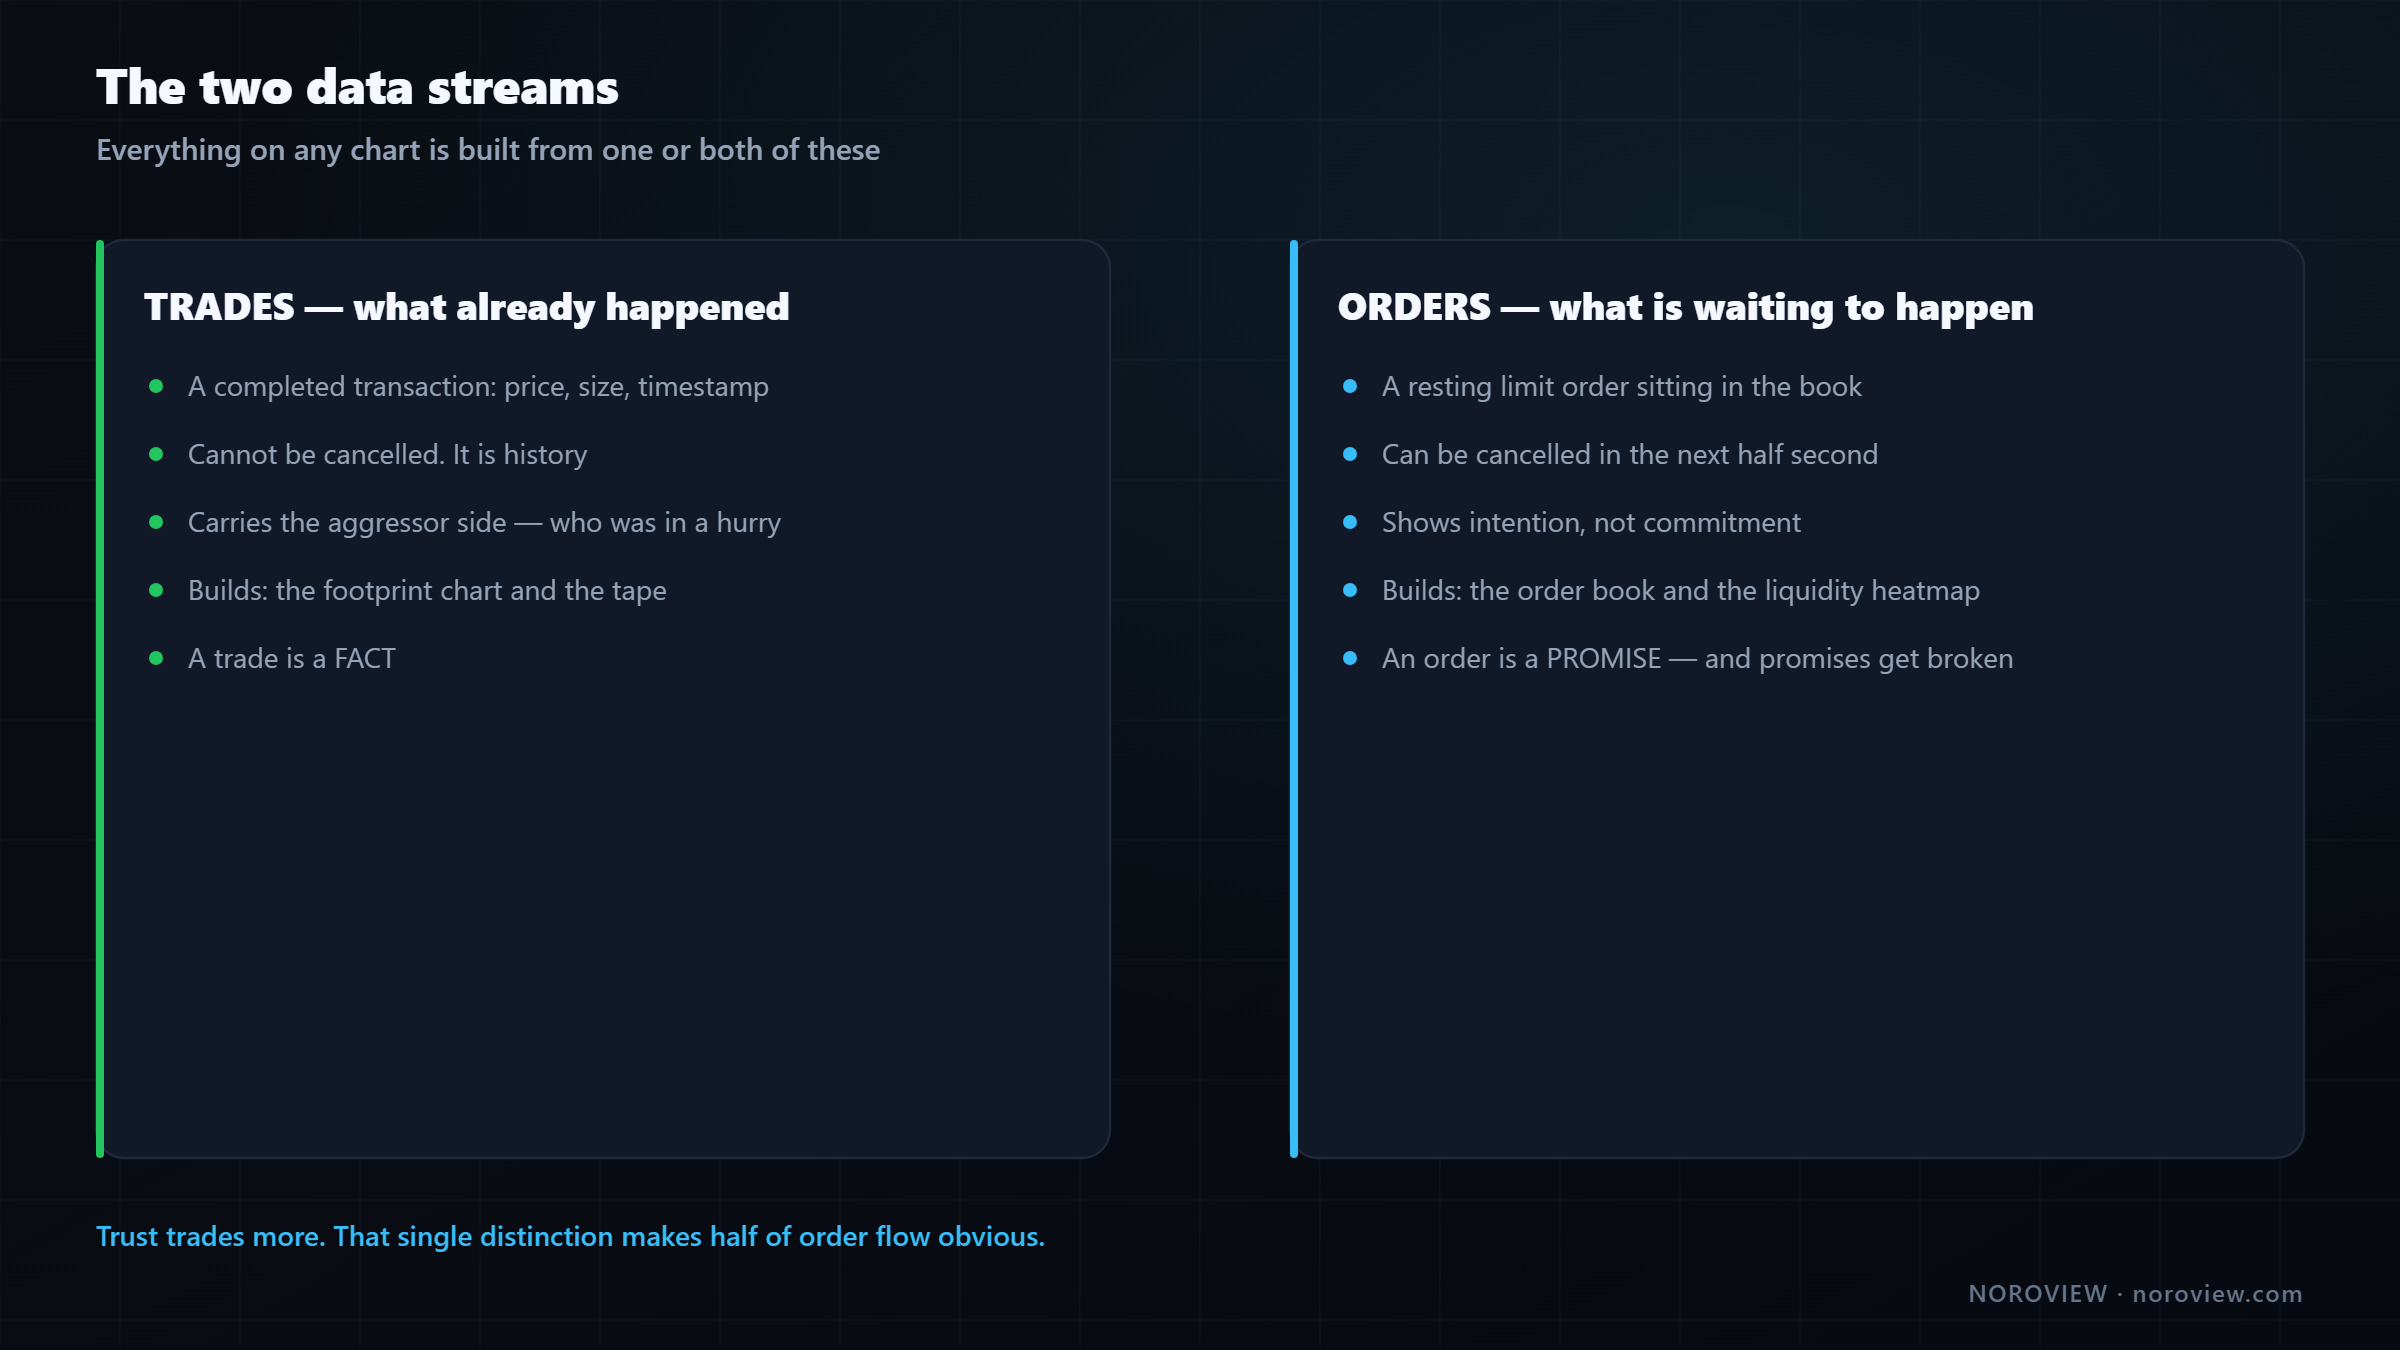
Stream one: trades. A trade is a completed transaction. Somebody bought, somebody sold, at a price, for a size, at a timestamp. It is history. It is done. It cannot be cancelled.
A trade is a fact.
Stream two: resting orders. These are intentions. Somebody has said "I will buy one Bitcoin at $95,000" and that order is sitting in the book, waiting. It has not happened. It might happen. It might be cancelled in the next half second.
An order is a promise. And promises get broken.
Hold onto that distinction for the entire course. It is the single most useful thing in this article.
What a candlestick chart actually throws away
Here is the uncomfortable part. A standard candlestick chart takes the trades stream, discards almost all of the detail, and keeps five numbers: open, high, low, close, and total volume.
Think about the compression ratio. In one minute on a busy market there might be three thousand individual trades. Your candle keeps four prices and one number. Everything else — who was aggressive, at which prices the buying happened, whether one large participant did it or a thousand small ones, whether the buying was met by absorption or by nothing at all — is deleted before it reaches your screen.
Order flow is simply the discipline of not throwing that away.
Level 1: what it is, and what it hides
Level 1 market data is the top of the market: the last traded price, the best bid (the highest price anyone is currently willing to pay), the best ask or offer (the lowest price anyone is willing to sell at), the size resting at those two prices, and cumulative traded volume. That is the whole of it.
For many purposes Level 1 is completely sufficient. If you are buying Bitcoin to hold for three years, you do not need anything else. The price is the price.
But look at what Level 1 structurally cannot tell you:
- Is there a wall of sellers $200 above us?
- Did that last move happen on real size, or on nothing?
- Was the buying aggressive, or passive?
- Is somebody quietly absorbing every sell order that arrives?
Level 1 shows you the best price on each side and nothing behind it. It is like walking into an auction room, being told the current bid, and finding a curtain drawn across the rest of the room. You cannot see how many people are standing there. You cannot see whether one person is holding a paddle for a thousand units or a hundred people are each holding one for ten.
The practical consequence: every candle looks the same on the inside
This is the reason this lesson exists.
Two candles can look identical on a normal chart — same body, same wicks, same total volume — and be completely different events.
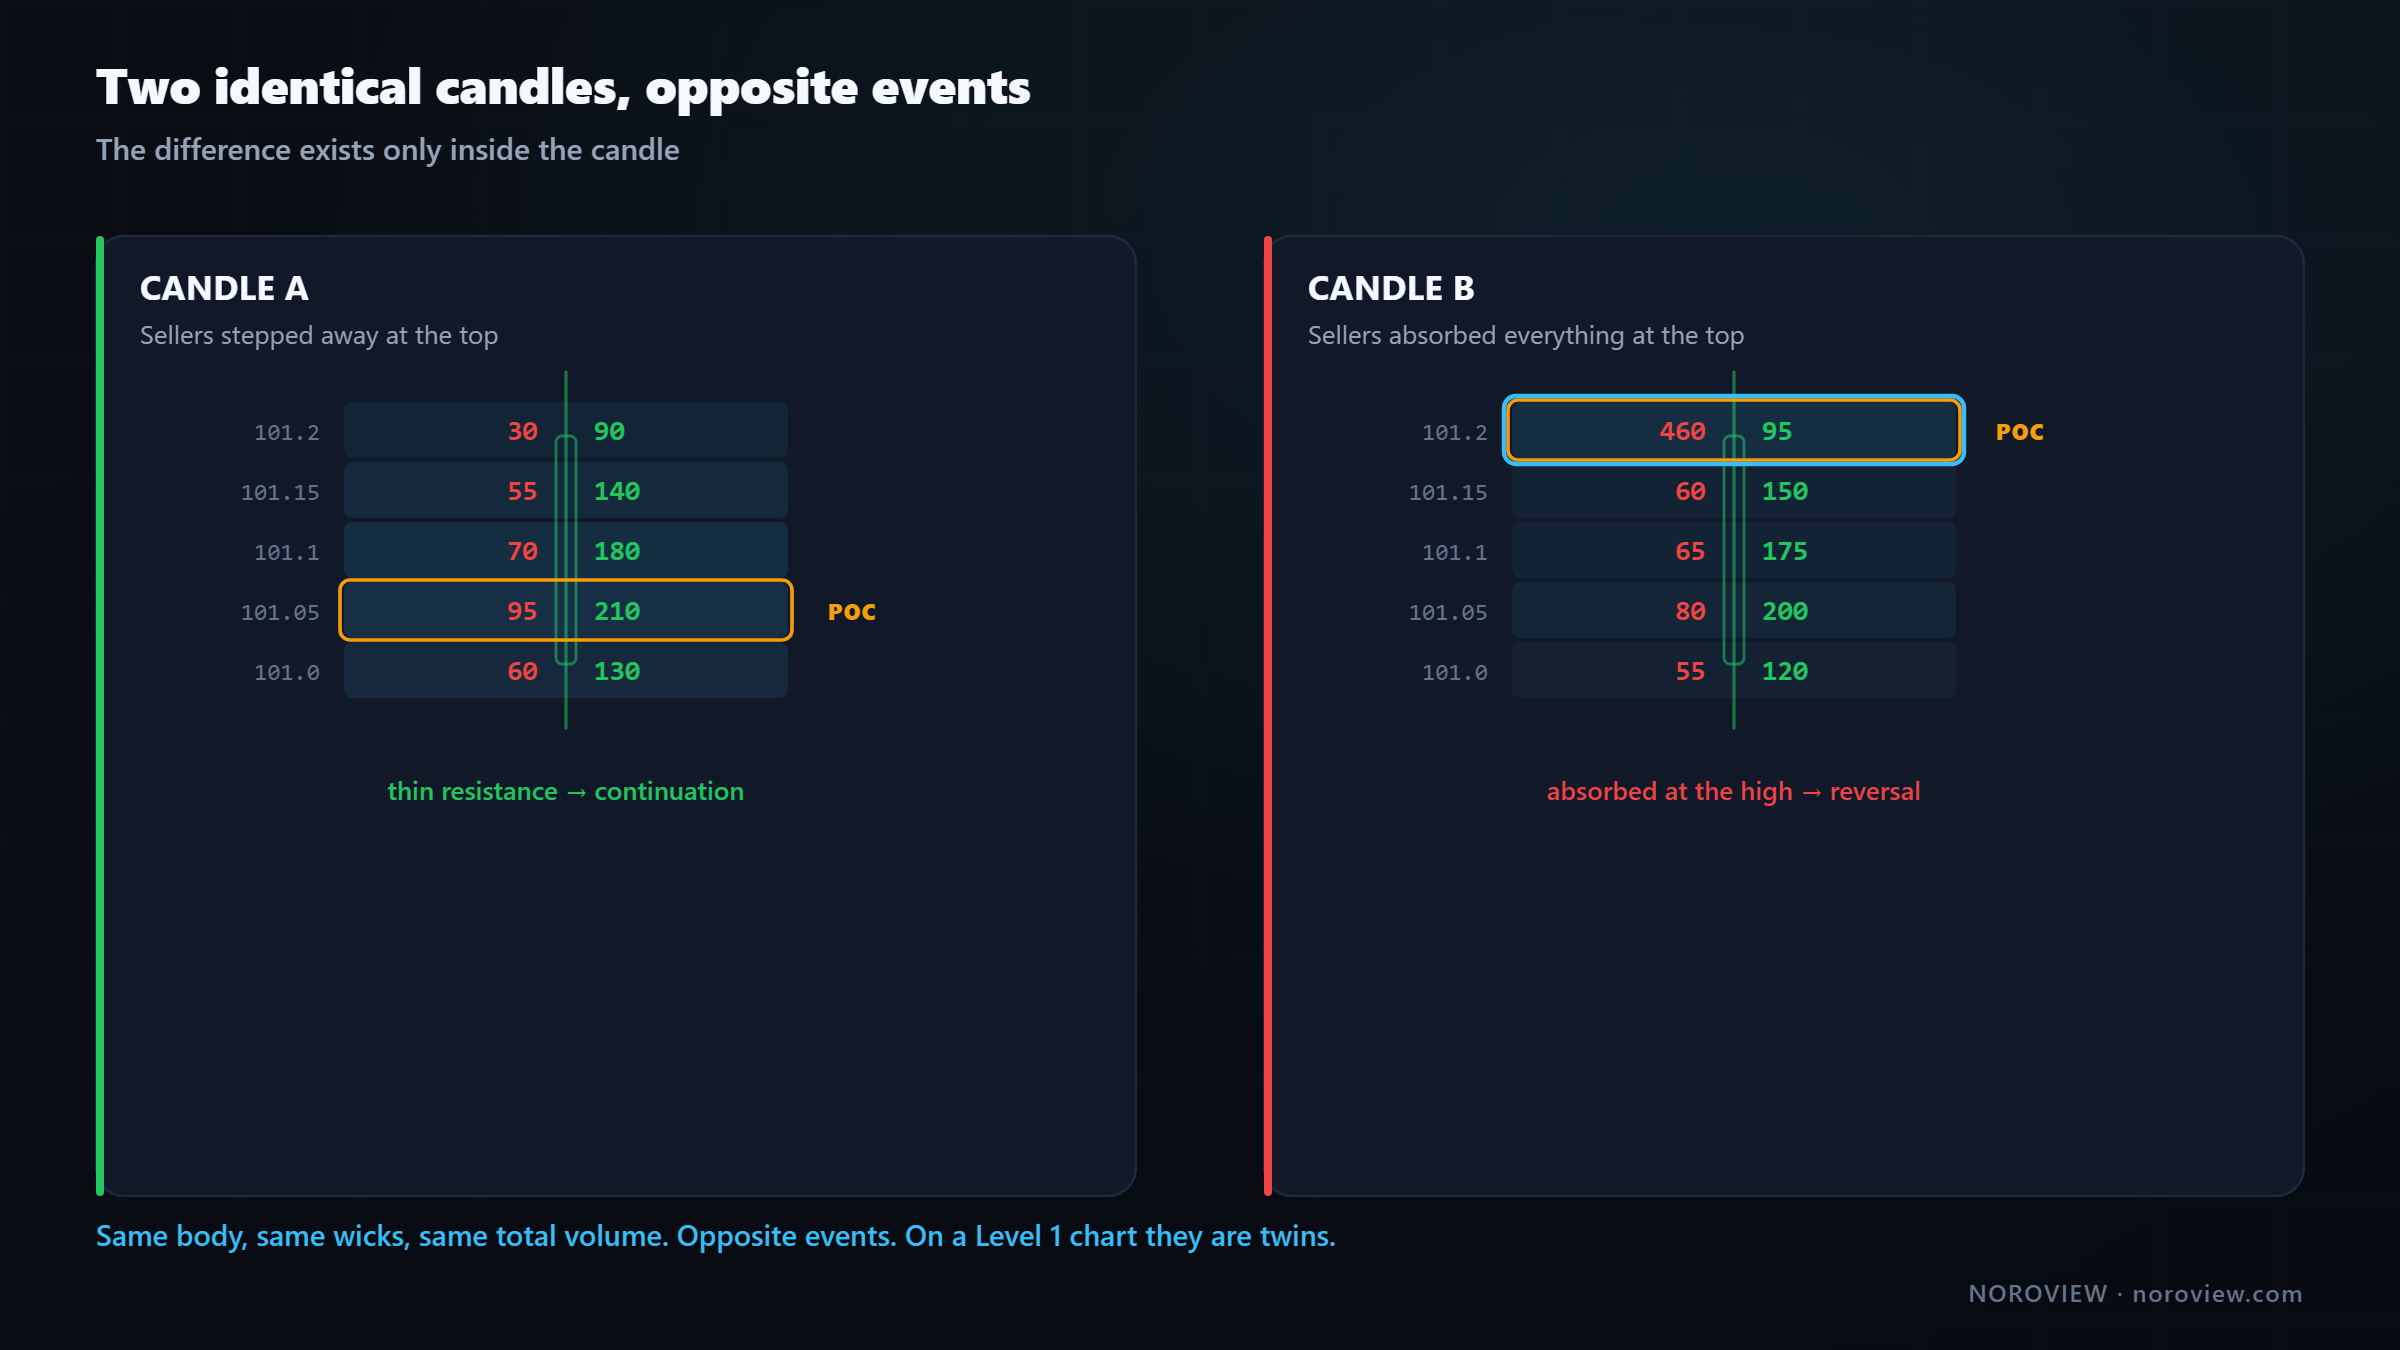
In the first, buyers pushed price up and sellers absorbed everything at the top — heavy selling met every buy at the highs and price could not go further. In the second, buyers pushed price up and sellers simply stepped away — thin resistance, easy travel. One of those is about to reverse. The other is about to continue.
On a Level 1 chart, they are twins.
That is why traders say "the chart lied to me." The chart did not lie. The chart was never given the information. Footprint charts exist precisely to put that information back.
▶ Try this now
Open a chart on BTC/USD and press
Alt+Oto dock the order book panel. Do not analyse anything. Just watch it for sixty seconds. Notice how many times per second the numbers change, where the large resting sizes appear, and how often a big number vanishes without ever being traded. Launch NOROVIEW free →
Level 2: the order book, properly read
Level 2 market data is the depth of the market. Instead of just the best bid and best ask, you get the whole book: every price with resting orders on it, and how much size is waiting at each one, on both sides.
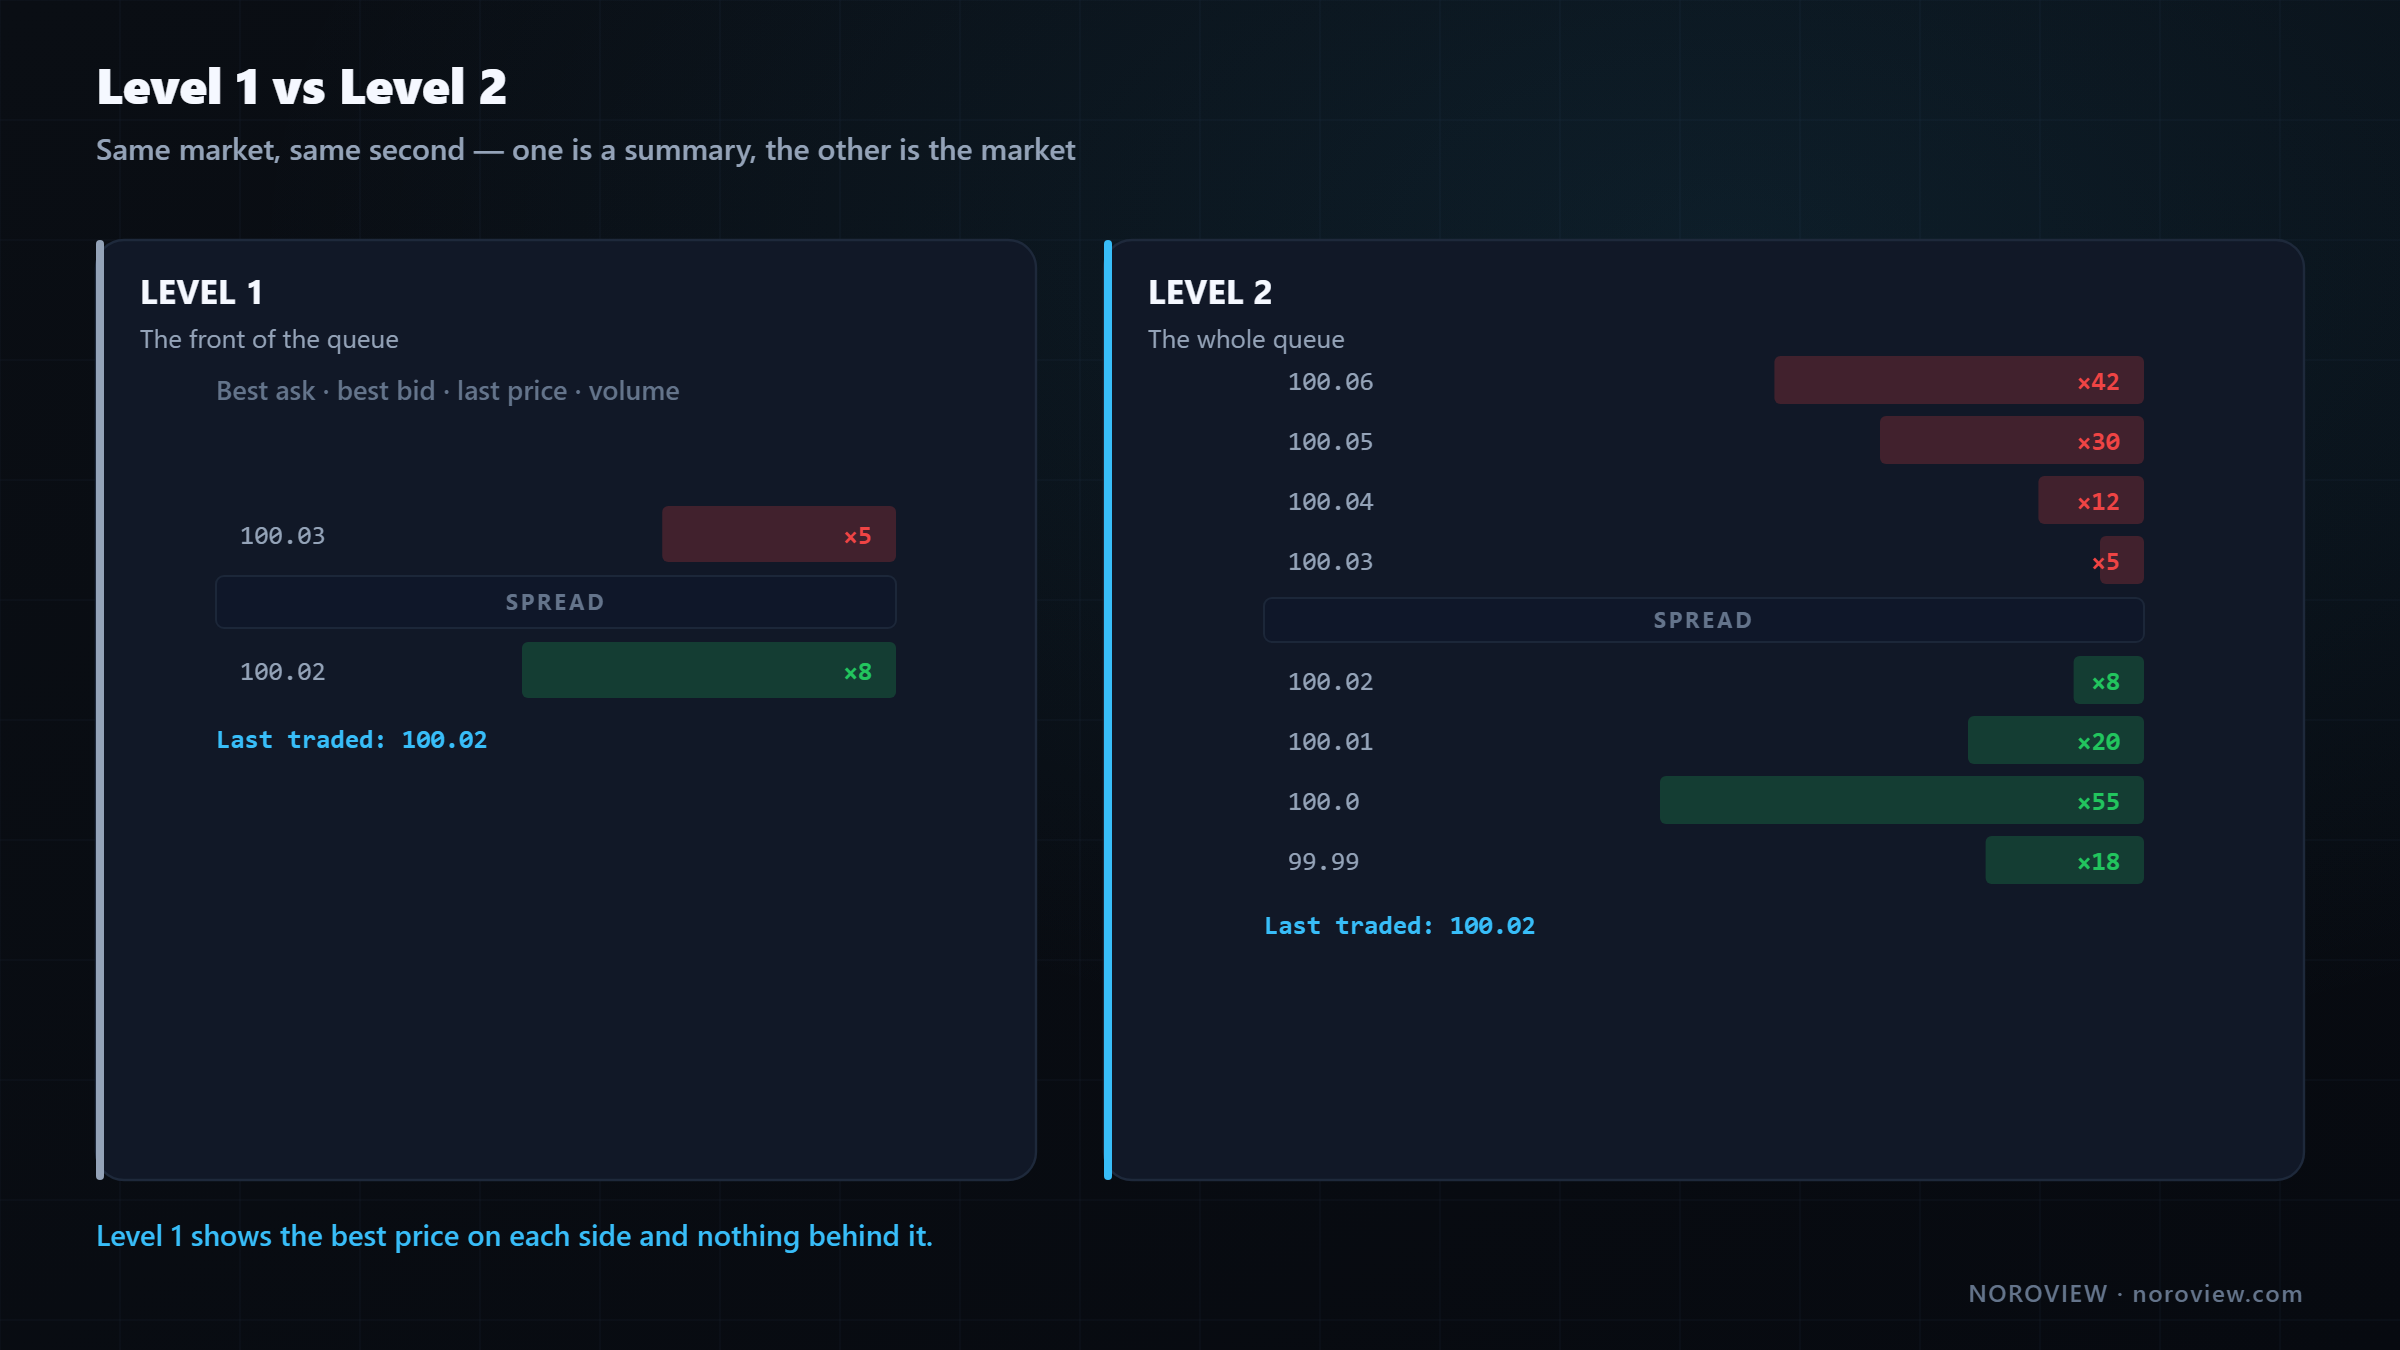
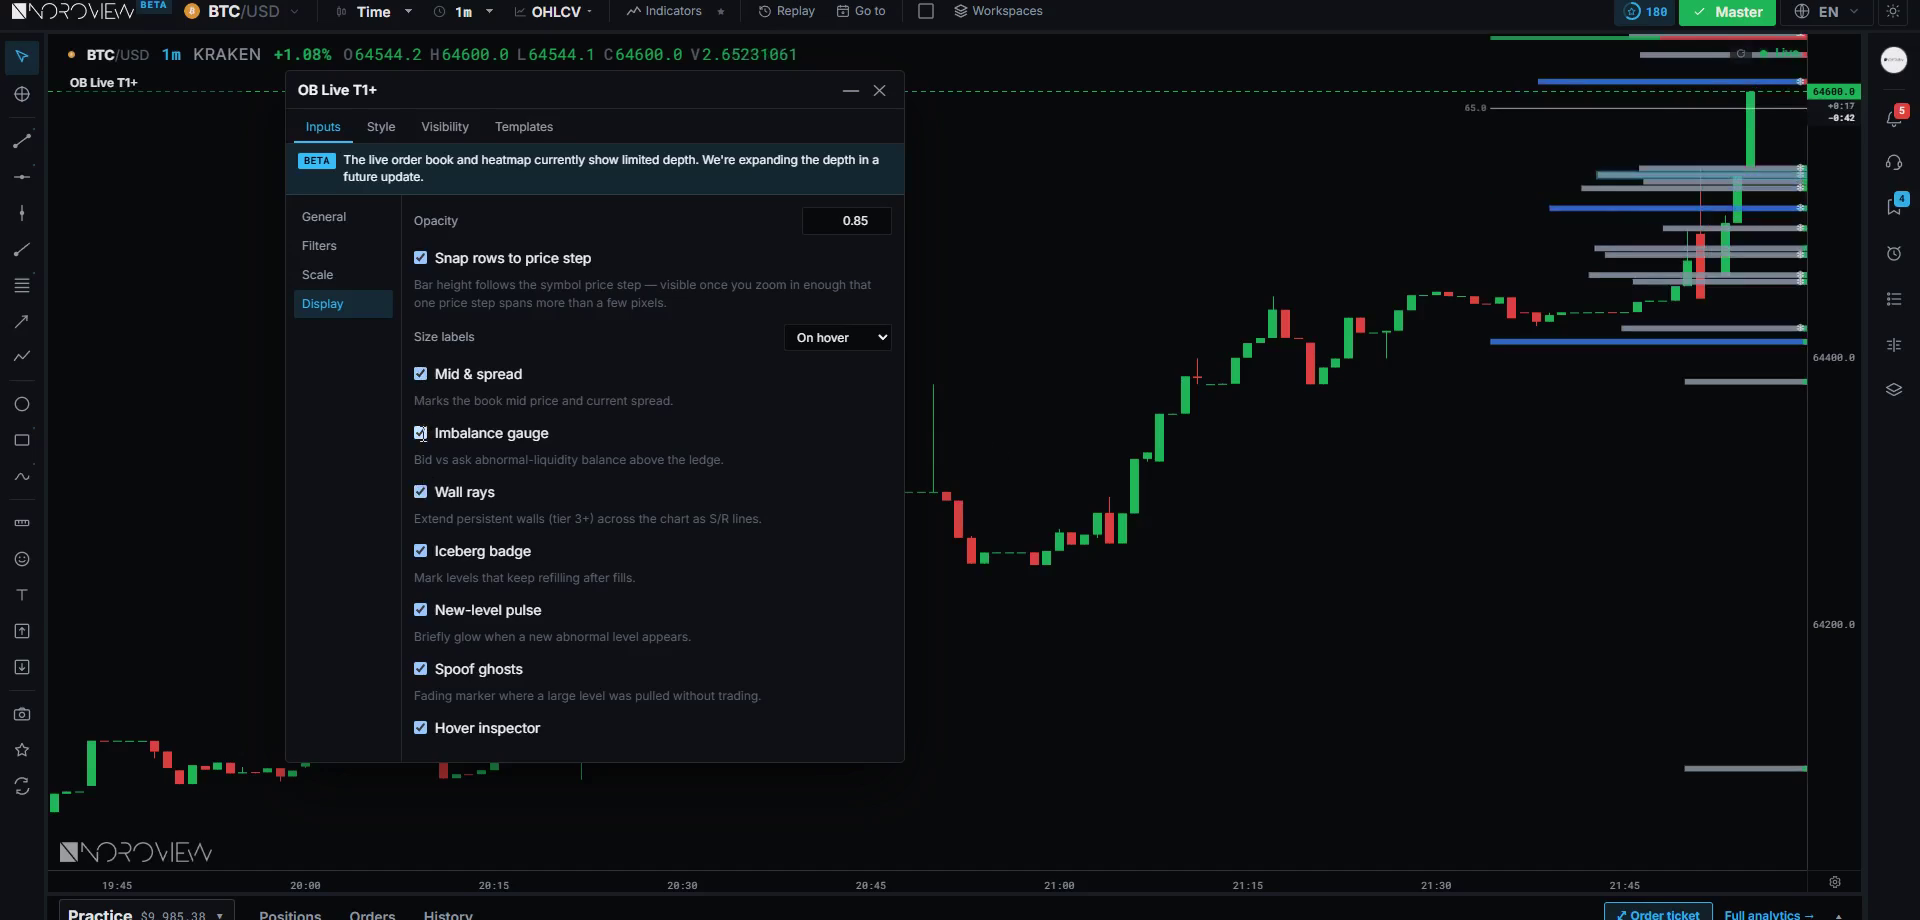
Everything above the current price is the ask side — sellers waiting. Everything below is the bid side — buyers waiting. The gap in the middle is the spread. Each row is a price with a quantity next to it, and that quantity is real: resting, committed size, sitting in the exchange's book right now. Kraken's own explainer on order books walks through the same structure from the exchange's side.
None of this appears on a candlestick chart. Not one pixel of it.
Three things Level 2 gives you that Level 1 cannot
1. Where the size is. If there are 200 BTC resting $50 above the current price and almost nothing below, that is not a neutral situation. Price has to eat through that to go up and has an open road going down. That asymmetry is information you simply do not have on Level 1.
2. Whether the size stays. A large order that sits there while price walks toward it is a completely different animal from a large order that vanishes the moment price gets close. The first is somebody who genuinely wants that price. The second was never meant to be filled — it was there to make you think something.
A big order that disappears when price arrives was never real.
3. Whether the move was real. Level 2 lets you distinguish between price jumping because somebody bought through the sellers, and price jumping because the sellers cancelled and got out of the way. On a candle those look identical. They are opposite events.
One more level, in one sentence
Some venues offer market-by-order data, sometimes called Level 3, where you see individual orders rather than the aggregate at each price. It is fascinating, it is mostly used by professionals and high-frequency firms, and you do not need it. Level 2 plus the trade data is more than enough for everything in this course.
The honest limitation of the order book
Hold onto this for the whole course:
The order book shows intentions. Intentions can be cancelled.
The order book is not the truth. It is a statement of intent, and a meaningful share of that intent is fake. Large orders get placed specifically to be seen, and pulled a second before they would fill. There is a name for it — spoofing — and it is illegal in regulated markets and rampant in unregulated ones. We look at it directly in lesson 10.
So the book is powerful, but it is soft evidence. Trades are hard evidence, because a trade cannot be cancelled. That is why the core of this course is built on trade data — the footprint — with the order book as the supporting instrument, never the lead.
Order book: what people say. Trades: what people did.
The tape: the third window
The tape, also called time and sales, is the other stream rendered directly: completed trades, one by one, as they happen.
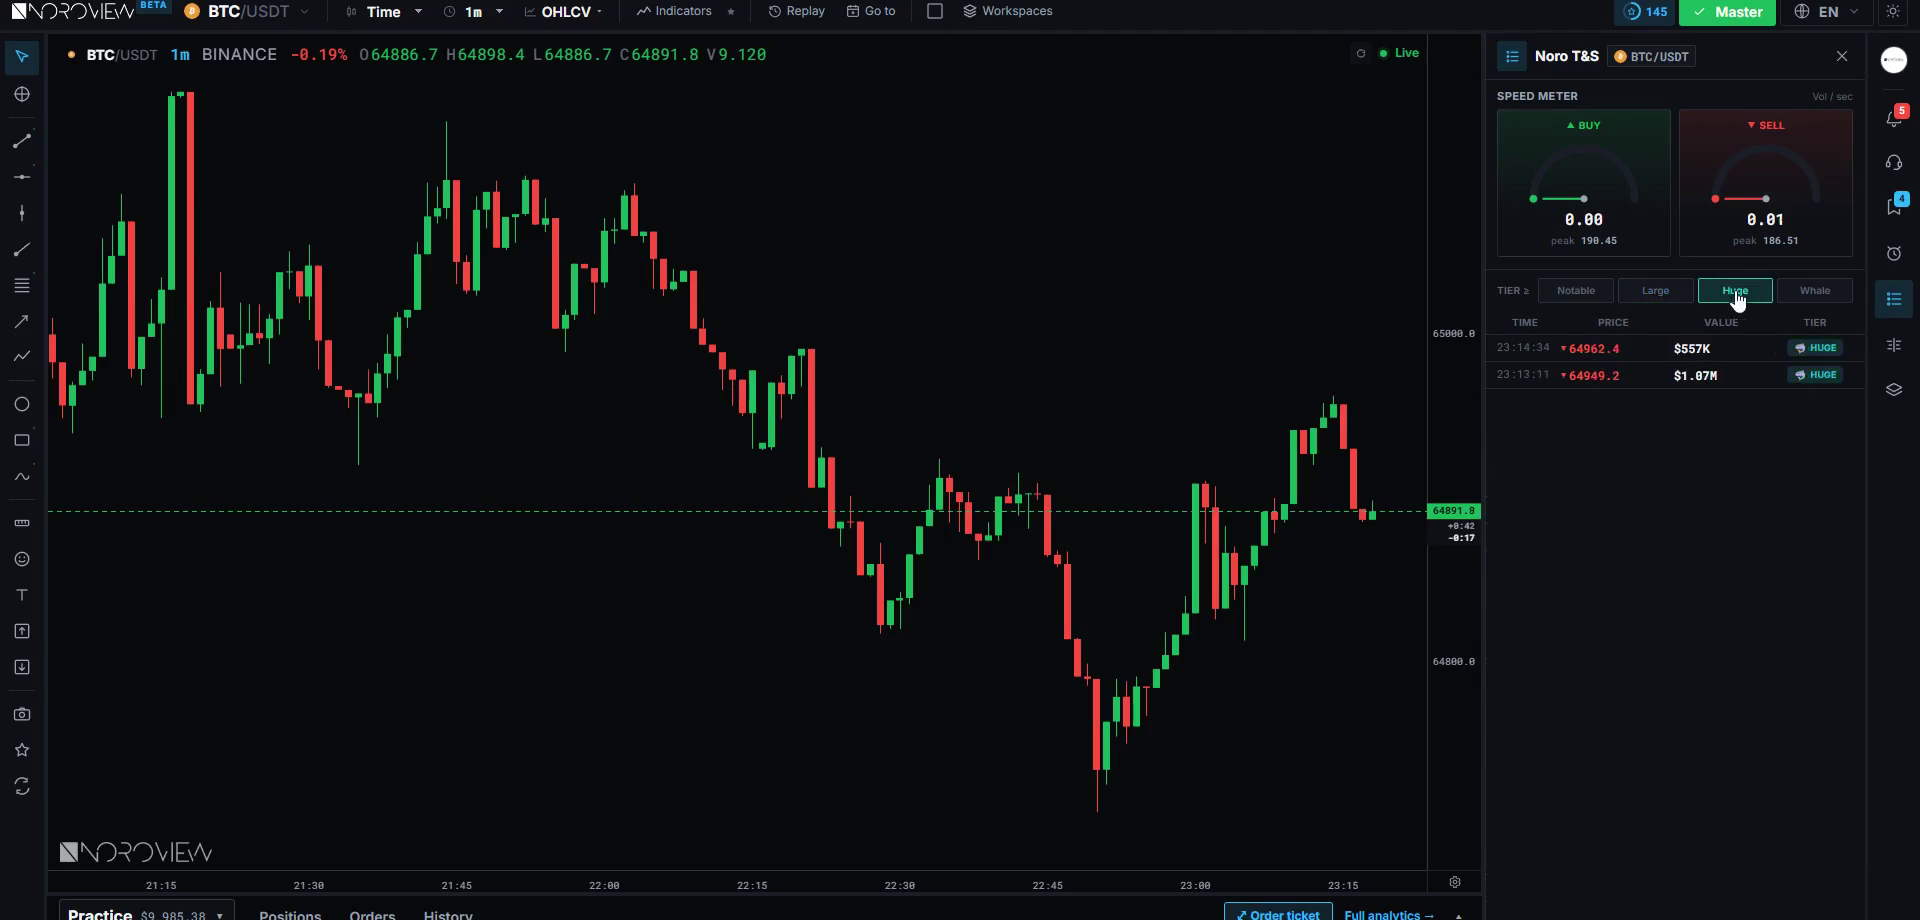
In NOROVIEW the smart tape (Alt+T) shows four columns: TIME · PRICE · VALUE · TIER. There is no separate size column — the side is shown as a green ▲ or red ▼ colouring the price itself.
That colour is doing something crucial, and it is the whole subject of lesson 3: it tells you which side was aggressive. Green means a buyer reached up and took the seller's price. Red means a seller reached down and hit the buyer's price. Same trade, two participants — but only one of them was in a hurry, and the one in a hurry is the one that matters.
Why a raw tape is unusable, and what filtering does
On a liquid market a raw tape is thousands of prints a minute. It is a blur. No human reads that, and the handful of trades that actually matter are buried under ten thousand that do not.
NOROVIEW filters the tape server-side and surfaces only prints that are significant for that specific market, sorted into four named tiers: Notable · Large · Huge · Whale. Those tiers are calibrated per market, so a big print on a smaller-cap coin is judged fairly against its own history rather than against Bitcoin. How that calibration works internally is proprietary; what matters to you is that they behave as a minimum-size floor.
Raise the floor and the tape thins out. Set it to Whale and it will usually go quiet and show a "listening" state.
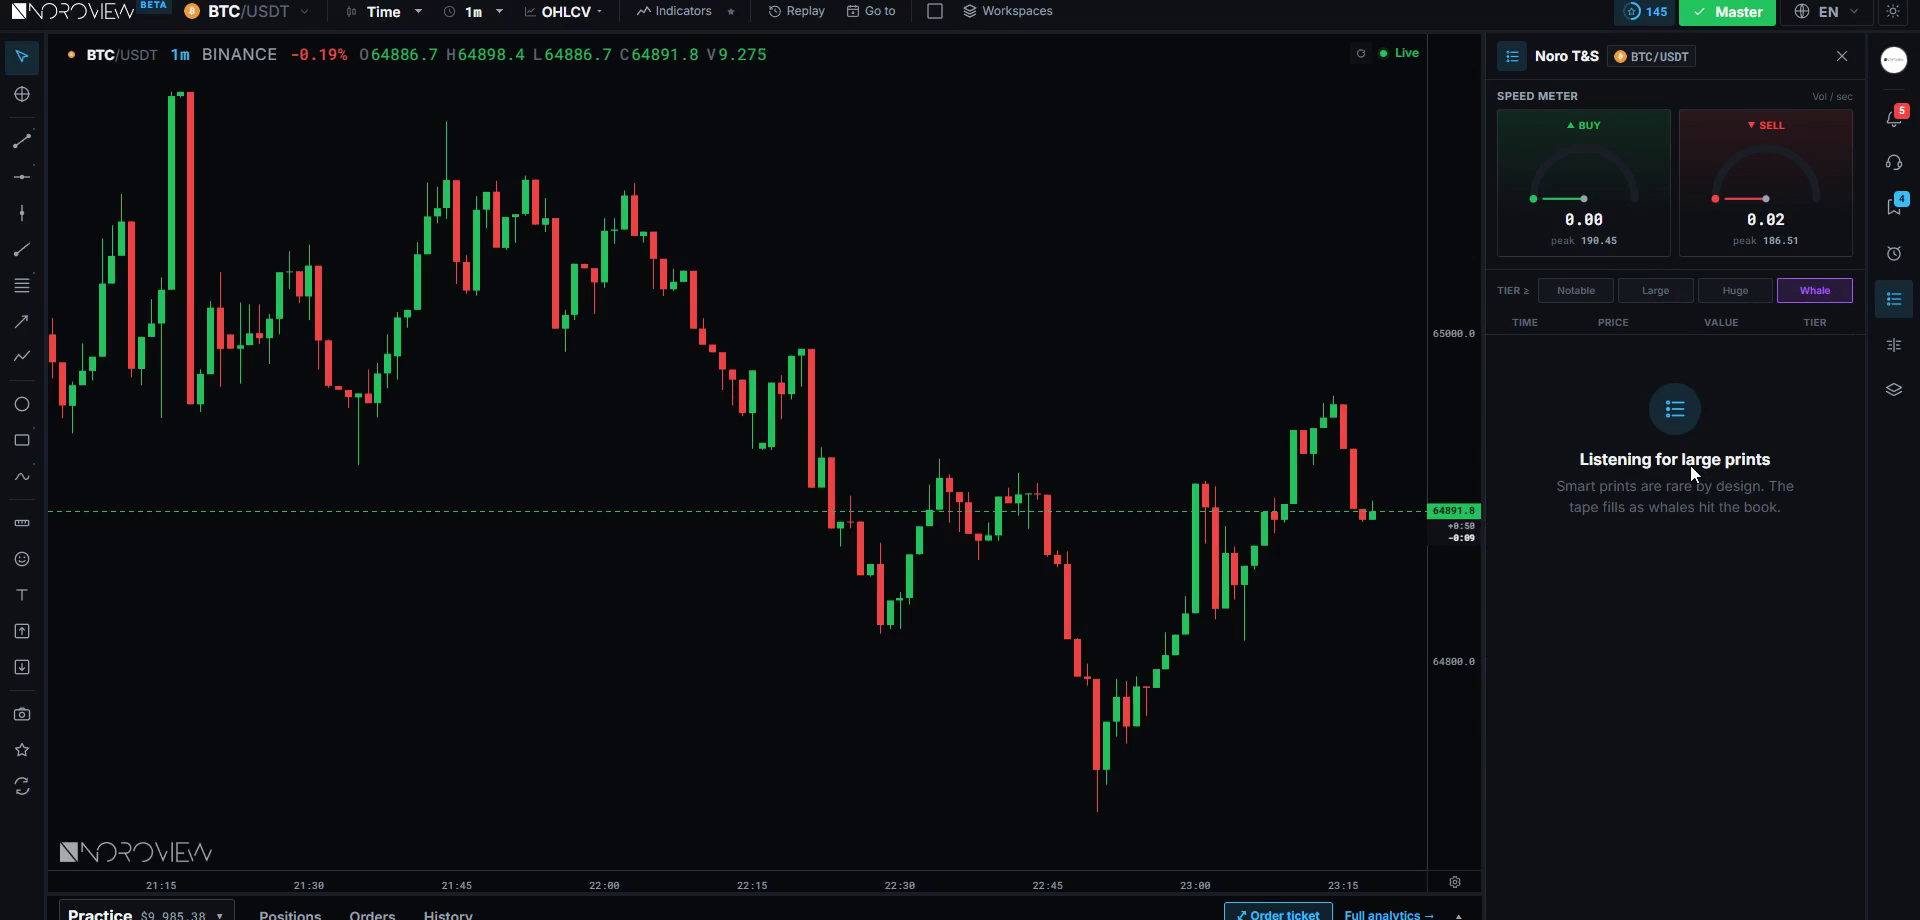
That is not a bug. Whale-sized prints are rare by design — if they happened every minute they would not be whales. When one appears, it is worth your attention.
Drop the floor back to Notable and the tape flows again:
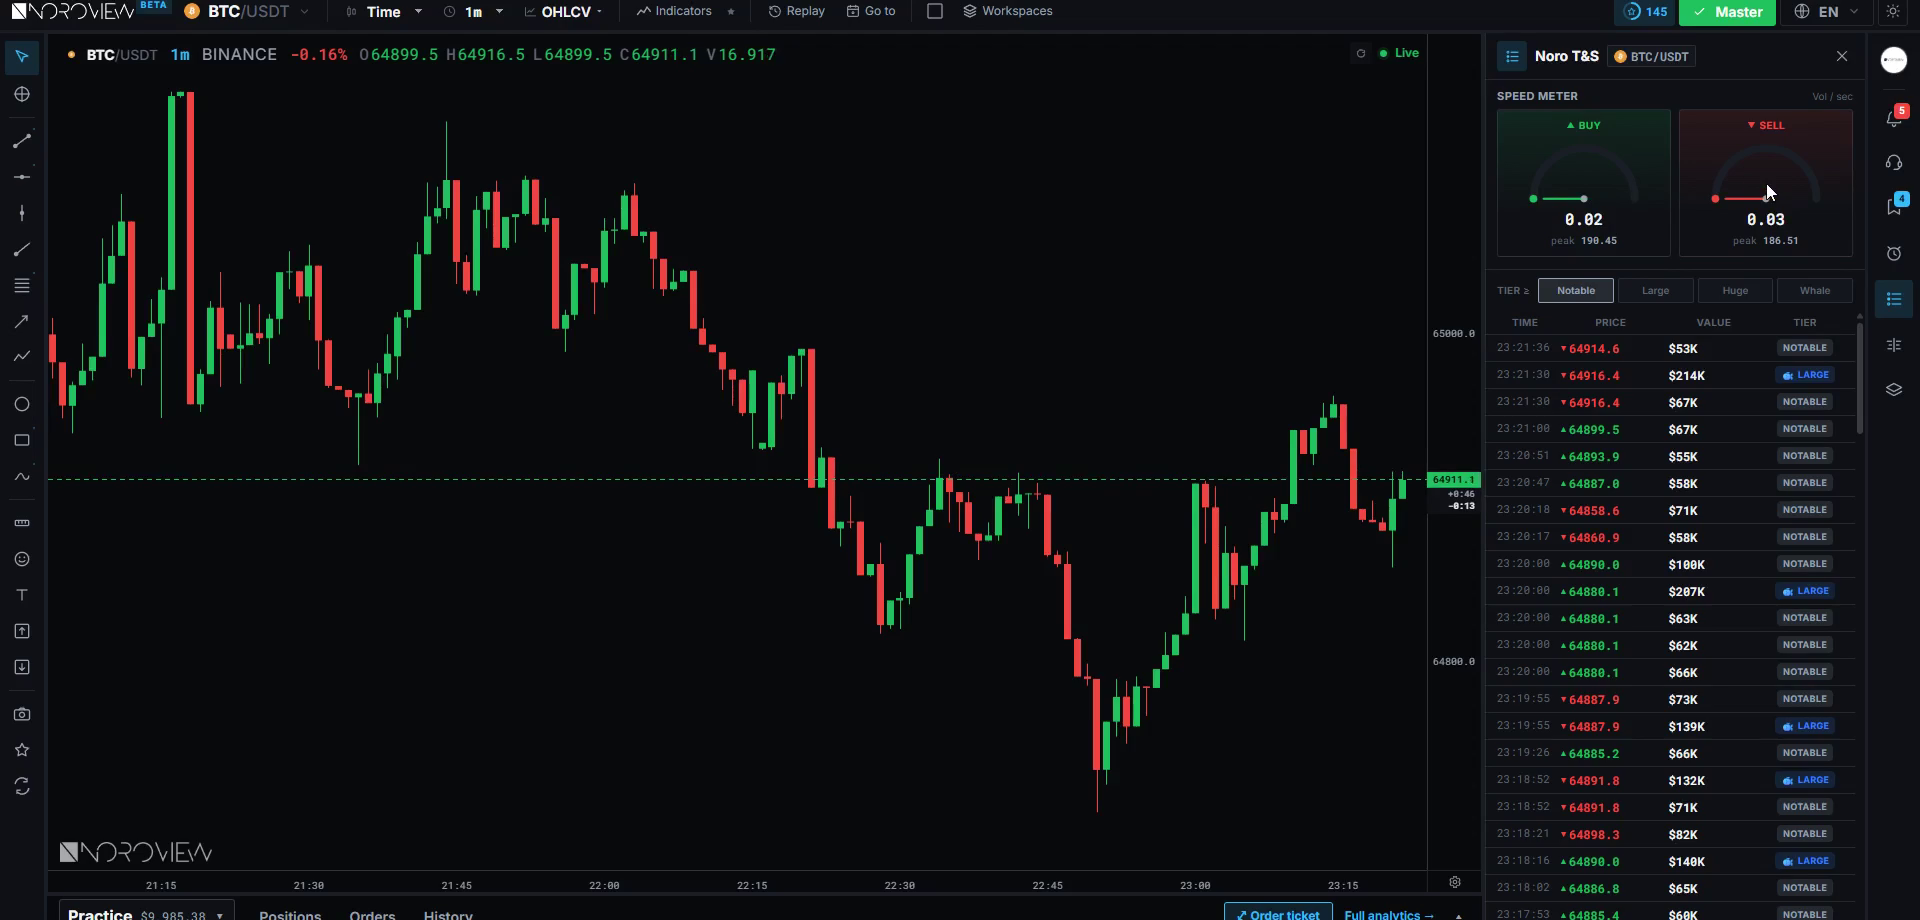
Above the tape sit two gauges, buy speed and sell speed, each measured against the busiest moment of the day. Most of the day they sit near-empty, which is normal — most of the day is quiet. But when one of them surges and pins high, that is a burst of one-sided aggression, and combined with a level on your chart it becomes a timing tool.
Which tool is built from which stream
This is the sentence to take away from the whole lesson:
Footprint and tape = trades. Order book and heatmap = orders.
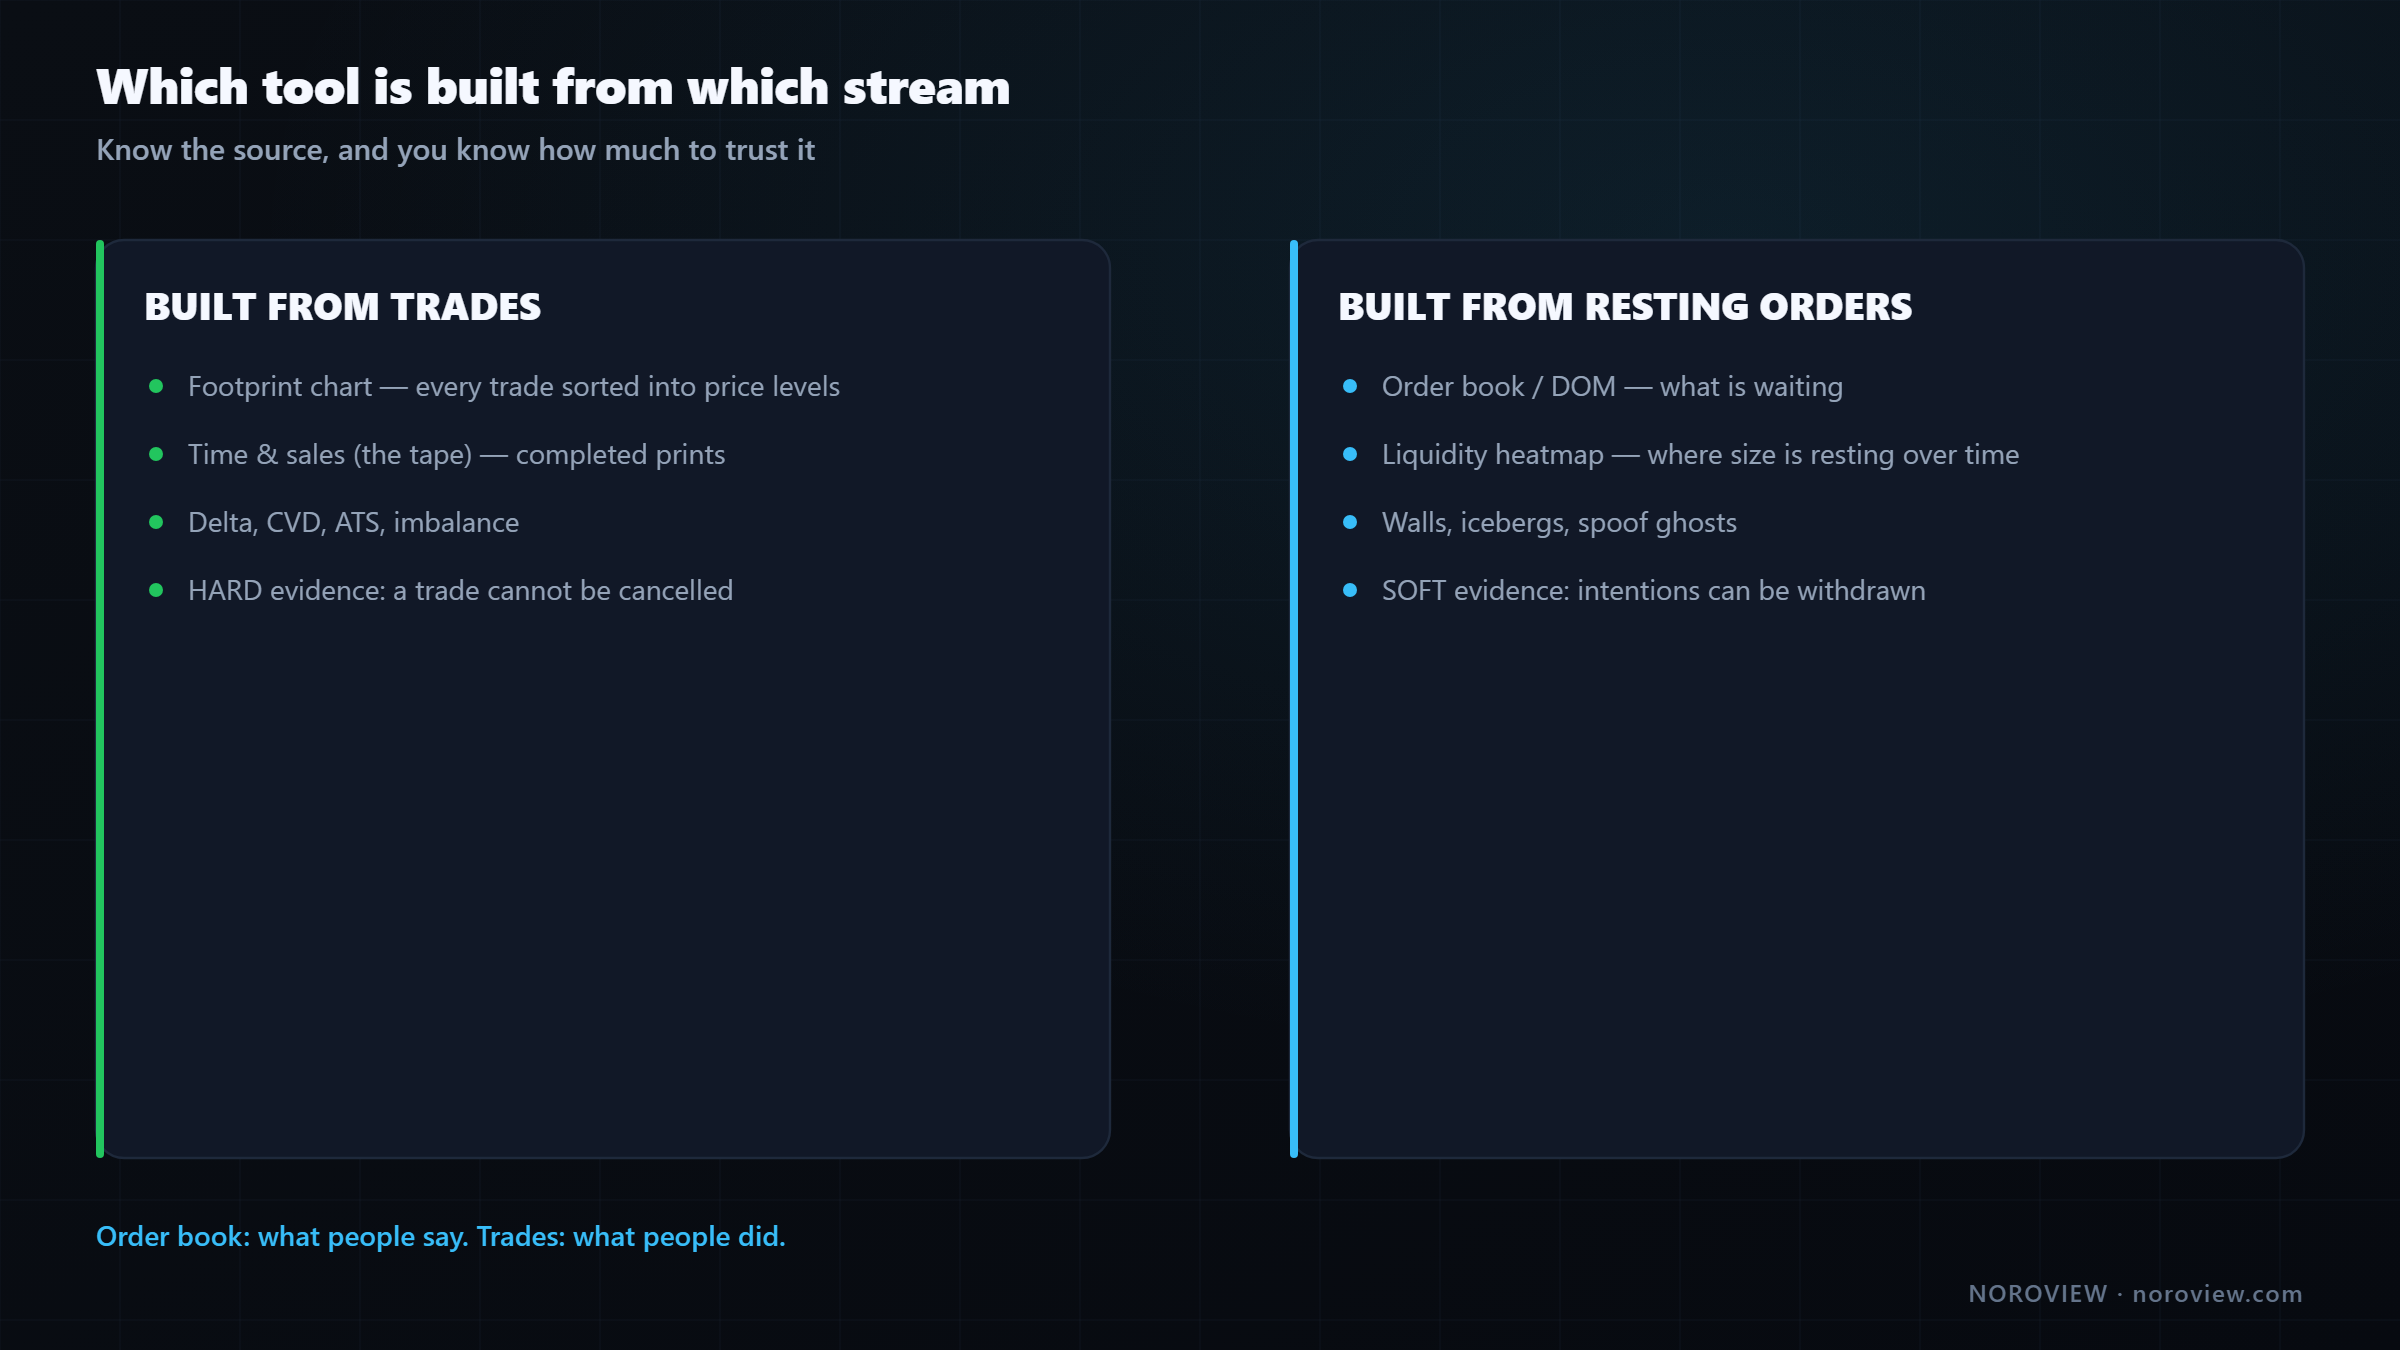
The footprint chart — the tool this entire course is built on — is made from the trade stream: every trade, with its price and its aggressor side, sorted into the price levels of each candle. Hard evidence about what actually happened.
The order book and the liquidity heatmap are made from the order stream: resting intentions.
When somebody says "order flow" loosely, they usually mean both. Now you know which one you are looking at, and how much weight it deserves.
Level 2 and footprint charts, in a browser tab
No installation, no separate data-feed subscription, no workstation. The heavy computation happens server-side; your browser receives finished results. Create a free account → · Compare plans
Why does Bitcoin have a different price on every exchange?
Because there is no such thing as "the price" of Bitcoin. There is no global Bitcoin price and no central authority computing one. What exists is a set of separate marketplaces, each with its own order book, its own buyers and its own sellers.
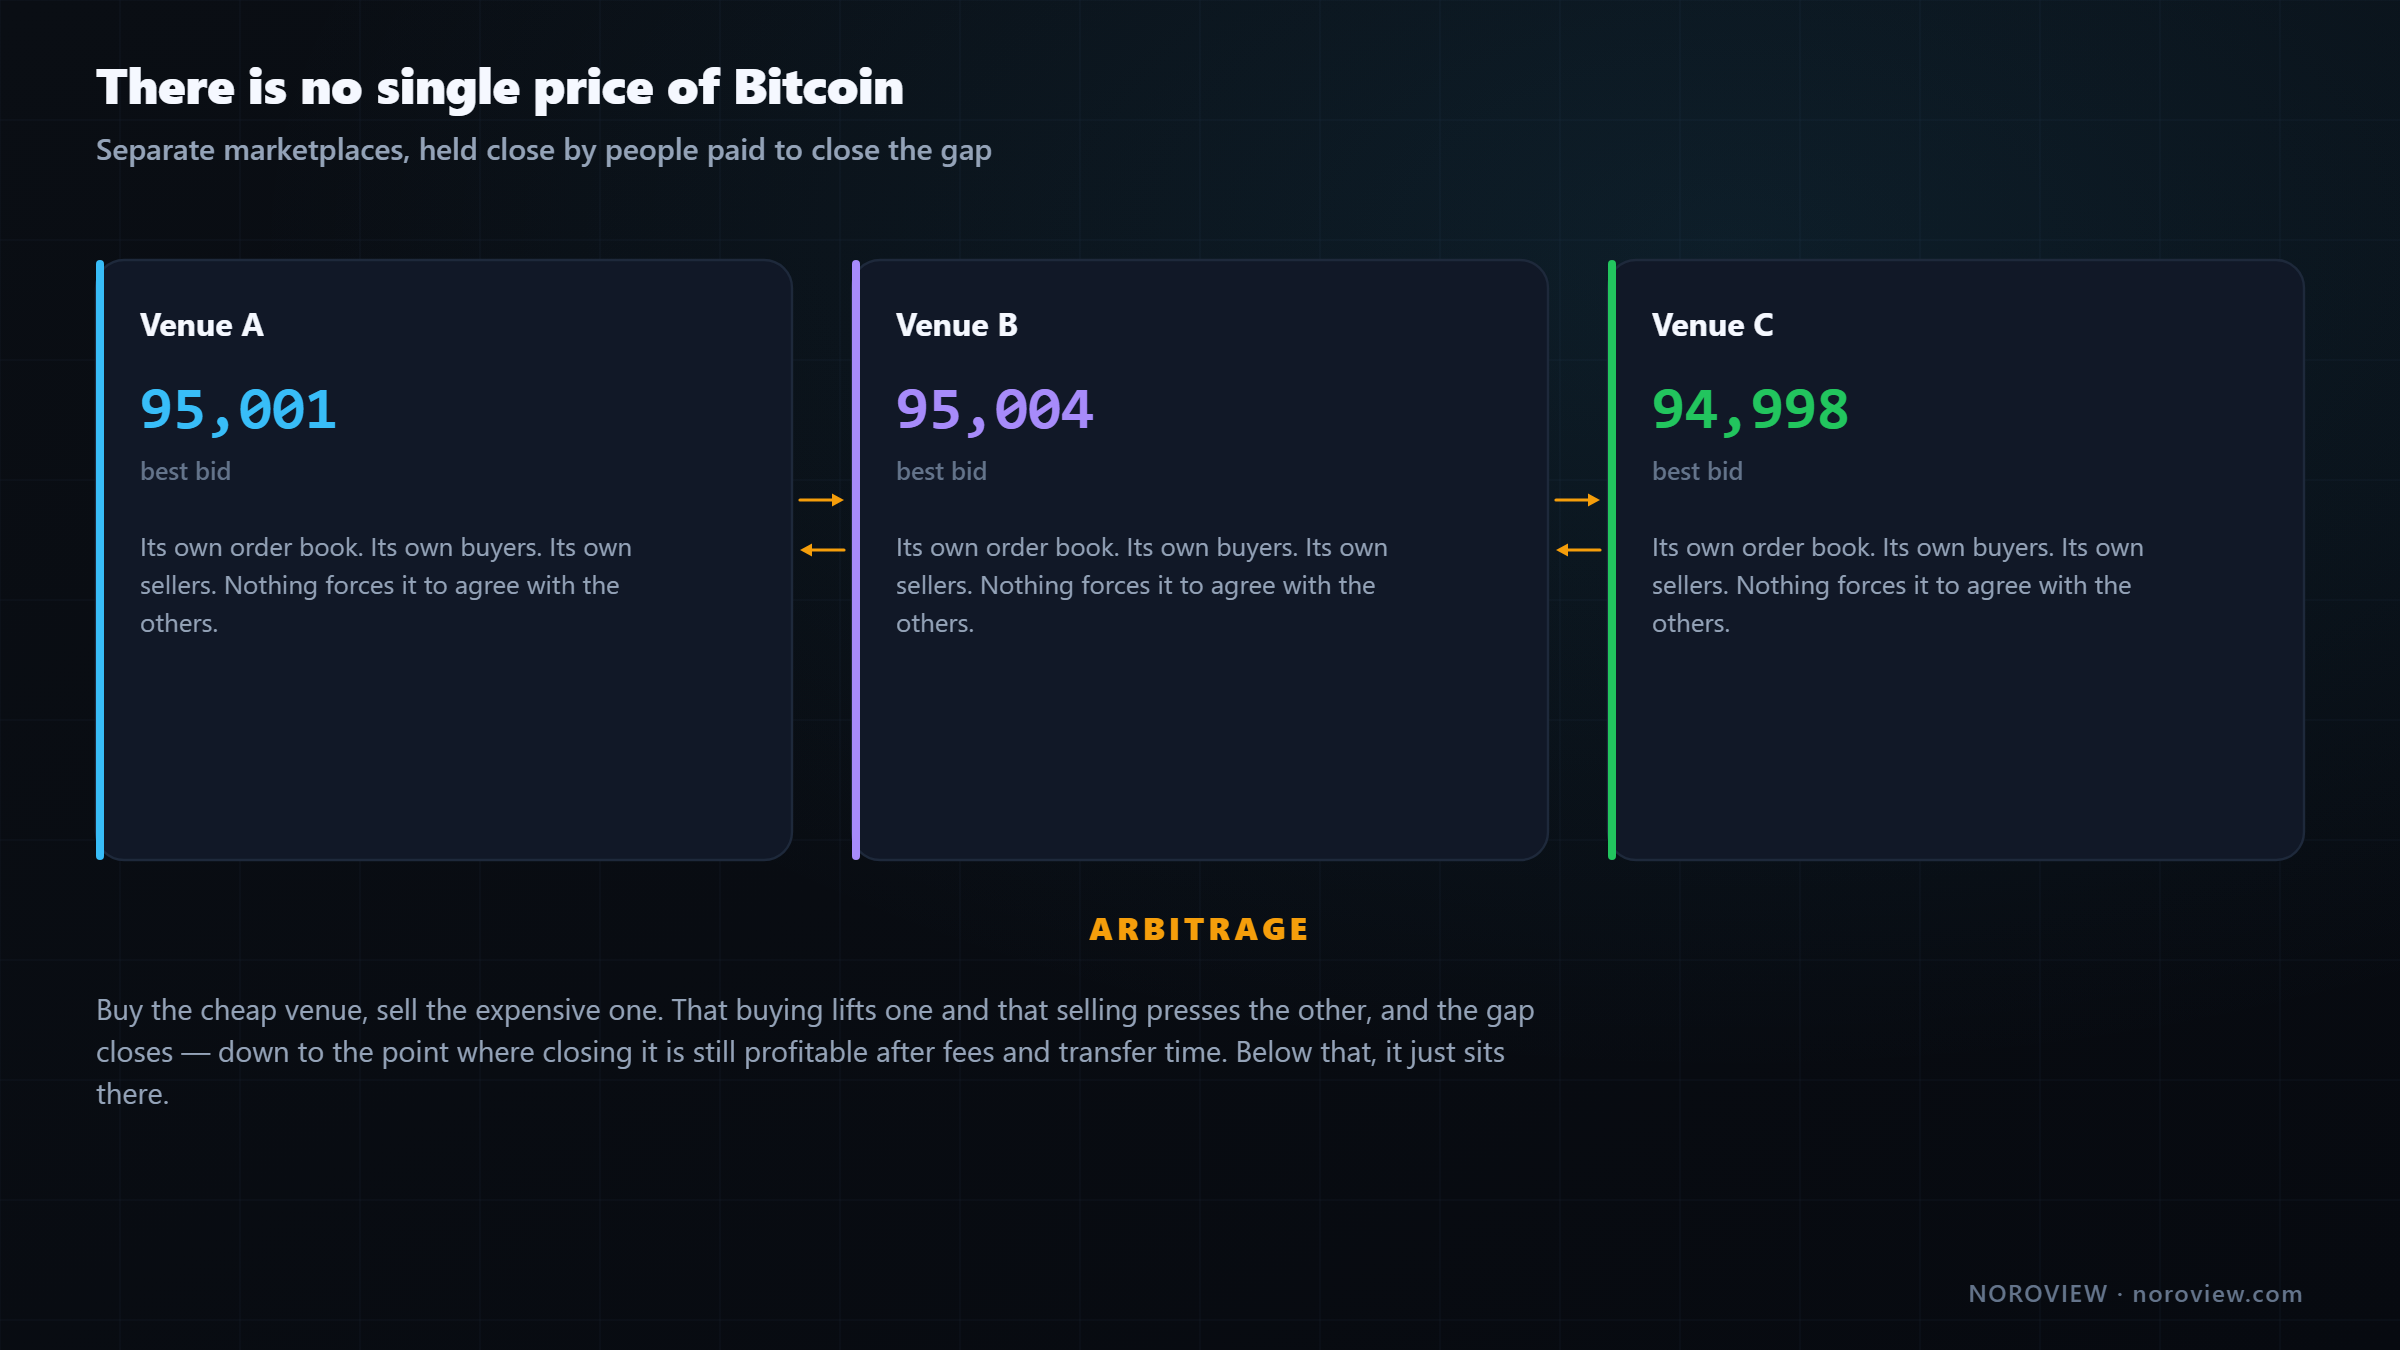
Each exchange is its own auction room. In room A the highest bidder is at $95,001. In room B it is $95,004. Two different rooms, two different crowds. Nothing forces them to agree.
The price of Bitcoin on any venue is exactly one thing: the price of the last trade between two participants inside that venue's order book. Nothing more. When a website tells you "Bitcoin is at $95,000," that is either one specific exchange or an average someone calculated across several. It is a summary of many separate markets, not a fact about Bitcoin.
So why are they always so close? Arbitrage.
If Bitcoin is $100 cheaper on one venue than another, somebody buys the cheap one, sells the expensive one, and pockets the difference. That buying pushes the cheap venue up, that selling pushes the expensive venue down, and the gap closes. There are firms that do nothing else, all day, with automated systems, measuring in milliseconds. Arbitrage is the mechanism, not a coincidence.
Prices stay close not because the venues are connected, but because there is a permanent army of participants being paid to close the gap.
And why the gaps never fully close
- Fees and withdrawal costs. Arbitrage costs money, so the gap only closes to the point where closing it is still profitable. Below that, it just sits there.
- Transfer speed. Moving capital between venues takes time, and time is risk.
- Regional demand and regulation. These produce persistent local premiums — the best-known example in crypto history being the sustained premium in South Korean markets.
- Quote currency. A pair priced in dollars and a pair priced in a stablecoin are not the same instrument; the stablecoin itself can drift from par.
- Liquidity. A $10 million market order moves a deep book a little and a thin book a lot. Same order, different damage.
- Speed. In a genuinely violent minute — a liquidation cascade — venues can dislocate by a real amount for a real number of seconds, because arbitrage cannot execute fast enough. Then it snaps back.
Many rooms, one asset, prices pulled together by profit-seeking — but never perfectly.
Can I analyse on one exchange and trade on another?
Yes, and professionals do it constantly. In traditional markets it is completely standard to read order flow in the futures market and execute a related instrument, because the futures market is where the volume and the information live. The same logic applies in crypto: read the market with the most volume and the most information, then execute wherever you actually hold an account.
There are four conditions. Break them and this stops working.
Condition 1 — read a liquid venue. The entire value of order flow comes from having enough activity to read. If you analyse a thin book you are reading noise, and then acting on that noise somewhere else. That is worse than not looking at all.
Condition 2 — the two markets must be genuinely linked. Bitcoin on two major venues is tightly arbitraged, tick for tick, all day. That link is what makes the transfer valid. It holds for major assets and degrades quickly as you move into small, low-volume coins that trade differently everywhere. Do not do this with illiquid altcoins.
Condition 3 — treat levels as zones, not exact ticks. If two venues differ by a few dollars, then a level you drew at exactly $95,211 on one chart is not exactly that number on the other. Use a small band, not a hairline. You should be doing that anyway — levels are areas where behaviour changes, not magic numbers. Lesson 9 goes into how wide those bands should be.
Condition 4 — know your instrument. Spot and perpetual futures are related but not identical. Perpetuals have funding rates, leverage, and liquidation cascades that spot does not. If you analyse a perpetual futures book and then trade spot, most of the information transfers and some of it is specific to the futures market. Know which is which — lesson 15 covers the practical differences.
Read where the volume is. Execute where your account is.
In most crypto markets the highest-volume perpetual futures market leads, because that is where the fast, aggressive, leveraged money plays, and spot tends to follow. So reading the busiest market and executing on your own is often better than reading your own thinner venue, not a compromise.
The one thing you should never do is execute on a venue whose liquidity is so poor that your own order moves it. Your analysis can come from anywhere. Your fill happens in your own book, and your own book has to be able to absorb you.
Why the platform matters (and the honest landscape)
To do any of this you need Level 2 data, a footprint chart, a tape and a heatmap — without requiring a professional trading desk. There are three realistic options, and I am not going to pretend the alternatives do not exist.
Charting platforms (TradingView and similar) are excellent at what they are for: drawing, indicators, community, alerts, breadth of markets. Genuinely great products. But they are built primarily around price data. Deep order-flow tooling — a real footprint, a live depth heatmap, a filtered tape — is not their centre of gravity, and where it exists it tends to be limited on crypto.
Traditional desktop order-flow software is the professional answer and it is powerful. But count the real cost: you install software, usually Windows-only; you subscribe to a market data feed separately, often more expensive than the software itself; you need a genuinely strong computer, because your machine does all the calculation on every tick for every chart; and you spend the first fortnight configuring it instead of learning. That is a real barrier, and it is why most retail traders never see Level 2 in their life.
NOROVIEW takes the third route, and it is why I use it for this course: all the heavy computation happens server-side. Building the footprint, aggregating the order-flow metrics, analysing Level 2, filtering the tape — all of it runs on NOROVIEW's servers, and your browser receives finished results. In practice that means:
- Runs in a browser tab; nothing to install
- You do not need a powerful computer
- You are not buying a separate data feed
- One streaming connection per tab, however many charts you open
For somebody learning order flow on a normal laptop, that combination is the difference between doing this and not doing this.
And the part that matters most today: the standard Footprint chart is free for every user. Not a trial — free. Along with real charts, the basic indicators, drawing tools, watchlists, price alarms, multi-chart layouts, paper trading and market replay. That is genuinely most of what you need to follow this course.
There are four plans — Free, Basic, Pro, Master — and the paid tiers unlock the customisable multi-column NORO Footprint, the filtered smart tape and speed meter, deeper Level 2 tooling, the advanced order-flow indicators and the smart server-computed tools. I will use some of those later, and I will always say clearly when a tool is a paid one so you are never watching me use something you cannot follow along with. I am not going to quote limits or prices here, because those change; the pricing page is the source of truth.
Disclosure: these articles are published on NOROVIEW's own blog, so treat the recommendation with that in mind — the same way you should weigh anybody's. The reason I am comfortable putting it in writing is that you do not need to spend anything to do this course.
Common mistakes with Level 2 data
- Treating the book as truth. It is a statement of intent and a good deal of it is theatre.
- Reacting to a wall. Large resting orders that everybody can see are the easiest thing in the market to fake.
- Reading a thin book. On an illiquid market the book tells you about three participants, not about the market.
- Ignoring the aggressor side on the tape. The colour is the information; the price alone is not.
- Assuming Level 2 replaces trade data. It supports the footprint. It does not replace it.
- Drawing hairline levels across venues. If you analyse one venue and trade another, your levels are zones.
- Confusing DOM with footprint. The DOM shows what is waiting; the footprint shows what happened. Different questions.
Your homework
This one is required, because lesson 3 happens on your screen, not just mine.
- Create a free account and open a chart. No card needed for the free tier.
- Set your timezone to UTC. The chart-controls gear in the bottom axis corner → Timezone. Set it once and leave it for the whole course — the exchange day and the daily reset both run on UTC, so your chart and the market agree about where a day starts.
- Watch the order book for ten full minutes.
Alt+O. Doing nothing else. - Watch the tape for ten full minutes.
Alt+T. Doing nothing else.
No analysis. No trades. Just watch the market breathe until it stops looking like noise. I am serious about the ten minutes — this is the beginning of screen time, and screen time is the whole game.
Open the terminal and start your ten minutes →
Three things to remember
- Two streams. Completed trades are hard facts; resting orders are intentions that can be cancelled. The footprint is built from trades; the heatmap and order book are built from orders. Trust trades more.
- There is no single price of Bitcoin. There are many separate order books, held close by arbitrage but never identical.
- Read where the volume is. Execute where your account is — as long as both venues are liquid, the assets are genuinely linked, you treat levels as zones, and you know whether you are looking at spot or perpetuals.
← Previous: Order Flow Trading for Beginners · Course index: Order Flow Trading Course · Next → How Price Really Moves
Frequently asked questions
What is the difference between Level 1 and Level 2 data? Level 1 shows the top of the market: last price, best bid, best ask, the size at those two prices, and total volume. Level 2 shows the full depth of the order book — every price level with resting orders and the size waiting at each, on both sides. Level 1 is the front of the queue; Level 2 is the whole queue.
What is depth of market? Depth of market, or DOM, is another name for Level 2: the ladder of resting limit orders above and below the current price, with the quantity waiting at each level. It shows where liquidity is concentrated and where price would travel easily.
Do I need Level 2 data for crypto trading? Not to place a trade, but you need it to answer the questions Level 1 cannot: whether a move happened on real size, whether large resting orders are defending a level, and whether liquidity stayed or was pulled. Without it, two completely different candles look identical.
Is there free Level 2 data for crypto? Yes. Crypto exchanges publish order book depth publicly, unlike most equity venues where Level 2 is a paid subscription. That is one genuine structural advantage crypto has for anyone learning order flow — the data barrier that keeps most retail traders on Level 1 in equities does not exist.
What is time and sales? Time and sales — the tape — is the stream of completed trades displayed one by one as they execute, with time, price and size. Crucially it also shows which side was the aggressor: a buyer lifting the offer or a seller hitting the bid.
DOM vs footprint — what's the difference? The DOM shows resting orders that have not happened yet; the footprint shows executed trades that already have. The DOM answers "what is waiting?" and the footprint answers "what actually got done?" The footprint is harder evidence because trades cannot be cancelled.
Why does Bitcoin have a different price on every exchange? Because each exchange is a separate marketplace with its own order book. There is no global price and no authority computing one. Arbitrage traders keep the venues close by buying the cheap one and selling the expensive one, but fees, transfer times, regional demand and liquidity differences stop the gaps closing completely.
Can I analyse on one exchange and trade on another? Yes, if four conditions hold: the venue you read is genuinely liquid, the two instruments are tightly arbitraged, you treat levels as zones rather than exact ticks, and you know whether you are comparing spot to perpetual futures. Never execute on a venue so thin that your own order moves it.
Sources
- Kraken Learn — what is an order book
- CME Group Education — introduction to order types
- Investopedia — arbitrage
Soroosh Moghimi — six years inside financial markets: algorithmic trading, HFT, crypto and AI, after a decade building startups. He publishes this course free because he already paid for the lessons in it. There is no paid course and no signal group. @sorooshmoghimi · About
Start reading real order flow
You cannot learn this from a candlestick chart, and you do not need to spend a cent to begin. The standard footprint chart is free for every NOROVIEW user, market replay is free, and the paper-trading simulator is free.
Open NOROVIEW free → · Compare plans →
⚠️ DISCLAIMER — EDUCATIONAL CONTENT ONLY
This article is for educational and informational purposes only. It is not financial, investment, or trading advice, and nothing in it is a recommendation to buy, sell, or hold any asset. Trading cryptocurrencies and leveraged derivatives is high risk and can result in the loss of some or all of your capital. Only risk money you can afford to lose. Any levels, indicators, signals or results shown are illustrative and are not a promise or prediction of future performance. Charts may be shown on a demo or paper-trading account and do not represent real trades or returns. Always do your own research. You alone are responsible for your decisions.
Keep reading
Related posts
The Best Order Flow Platform for Mac in 2026
Most order flow software is Windows-first desktop software, which is why Mac traders end up running Parallels. Here is what genuinely works on macOS in 2026, ranked by how much friction it costs.
NOROVIEW vs Exocharts: Order Flow Platforms Compared (2026)
An honest NOROVIEW vs Exocharts comparison: real pricing for web and desktop, free-tier data delays, exchange coverage, footprint charts, and what real-time CME futures actually cost on each platform.

16. Trade Management: Break-Even, Partials and Trailing Stops
Trade management explained: when break-even stops cost you money, partial exits, four kinds of trailing stop, the order-flow exit, and diagnosing yourself with MFE and MAE.
15. How to Day Trade Crypto With Order Flow (Starting Small)
How to day trade crypto with order flow: exchange security, spot vs perpetuals, leverage and liquidation, order types, fees, and an honest $100 starting plan.

14. Risk, Drawdown and the Mind: Day Trading's Real Edge
Day trading risk management and psychology: position sizing math, drawdown recovery arithmetic, hard limits, decision vs outcome, and the five states that break traders.
13. Fair Value Gaps, Confirmed With Order Flow
Most fair value gaps do nothing. Five order-flow checks that tell you in advance which FVGs are worth trading and which are decoration.
Discussion (0)
Want to join the discussion? Comments live inside the platform.
Open NOROVIEW