
14. Risk, Drawdown and the Mind: Day Trading's Real Edge
Day trading risk management and psychology: position sizing math, drawdown recovery arithmetic, hard limits, decision vs outcome, and the five states that break traders.

14. Risk, Drawdown and the Mind: Day Trading's Real Edge
⚠️ Education only. Nothing here is financial advice. Trading is high risk and you can lose your money. Full disclaimer at the bottom.
Day trading risk management is the discipline of sizing every position from your stop distance so that no losing streak can end you. It sounds procedural. It is the reason most people with a working method still lose money.
This is the article everybody skips. There are no footprints in it and nothing to screenshot. It is also the one that decides whether the other fifteen were worth your time — because there are people who read order flow better than I do and still lose money. Their reading is excellent. Their risk management is not. So it does not matter.
A great method with bad risk management is a SLOW way to lose money.
Not a fast one. A slow one — which is worse, because it takes longer to notice.
Open the paper-trading simulator and set the risk calculator while you read. It is free, and everything in this article is testable there before a cent is at stake.
What you'll learn in this lesson
- Why survival, not returns, is the objective for the next two years
- Position sizing mechanically — and why typing a size means you are doing it backwards
- The drawdown recovery arithmetic that changes how people feel about risk
- How normal an eight-loss streak actually is, and what it costs at different risk levels
- Hard limits: per trade, per day, per week, per open position
- Decision vs outcome — the single distinction that fixes half of trading psychology
- The five mental states that break traders, each with a mechanical fix
- How to measure all of it honestly
Lesson 14 of 16 · Part 3 — Trading. Part of the free order flow trading course. Previous: Fair Value Gaps With Order Flow. Next: How to Day Trade Crypto With Order Flow.
▶ Prefer to watch it?
Free Crypto Paper Trading on the Live Market — NOROVIEW Simulator (Ep 10) walks the risk calculator, the order ticket preview and the whole performance hub.
The one job
Most people have the wrong objective.
Your job isn't to make money on this trade. Your job is to still be here in two years.
Remember lesson 1: six months to two years, most people around two. That timeline is not a discouraging detail — it is the strategic constraint everything else has to be built around. If it takes two years to become consistently profitable, then the single most important property of your trading is survival. Not returns. A strategy that would have made you money over two years is worth exactly zero if your account is gone in month five.
Every rule in this article exists to keep you at the table long enough to get good.
This reframe also changes how you should feel about a loss. A loss taken correctly — proper size, defined stop, followed process — is not a failure. It is a cost of doing business, like rent. You paid a small, predetermined fee to find out whether an idea was right. If the fee was small and predetermined, the system is working.
A loss becomes a failure only when it was bigger than you planned, or when you took it for a reason that was not in your rules. Those are the only two kinds of bad loss.
Position sizing, mechanically
This is the single highest-value habit in the entire course.
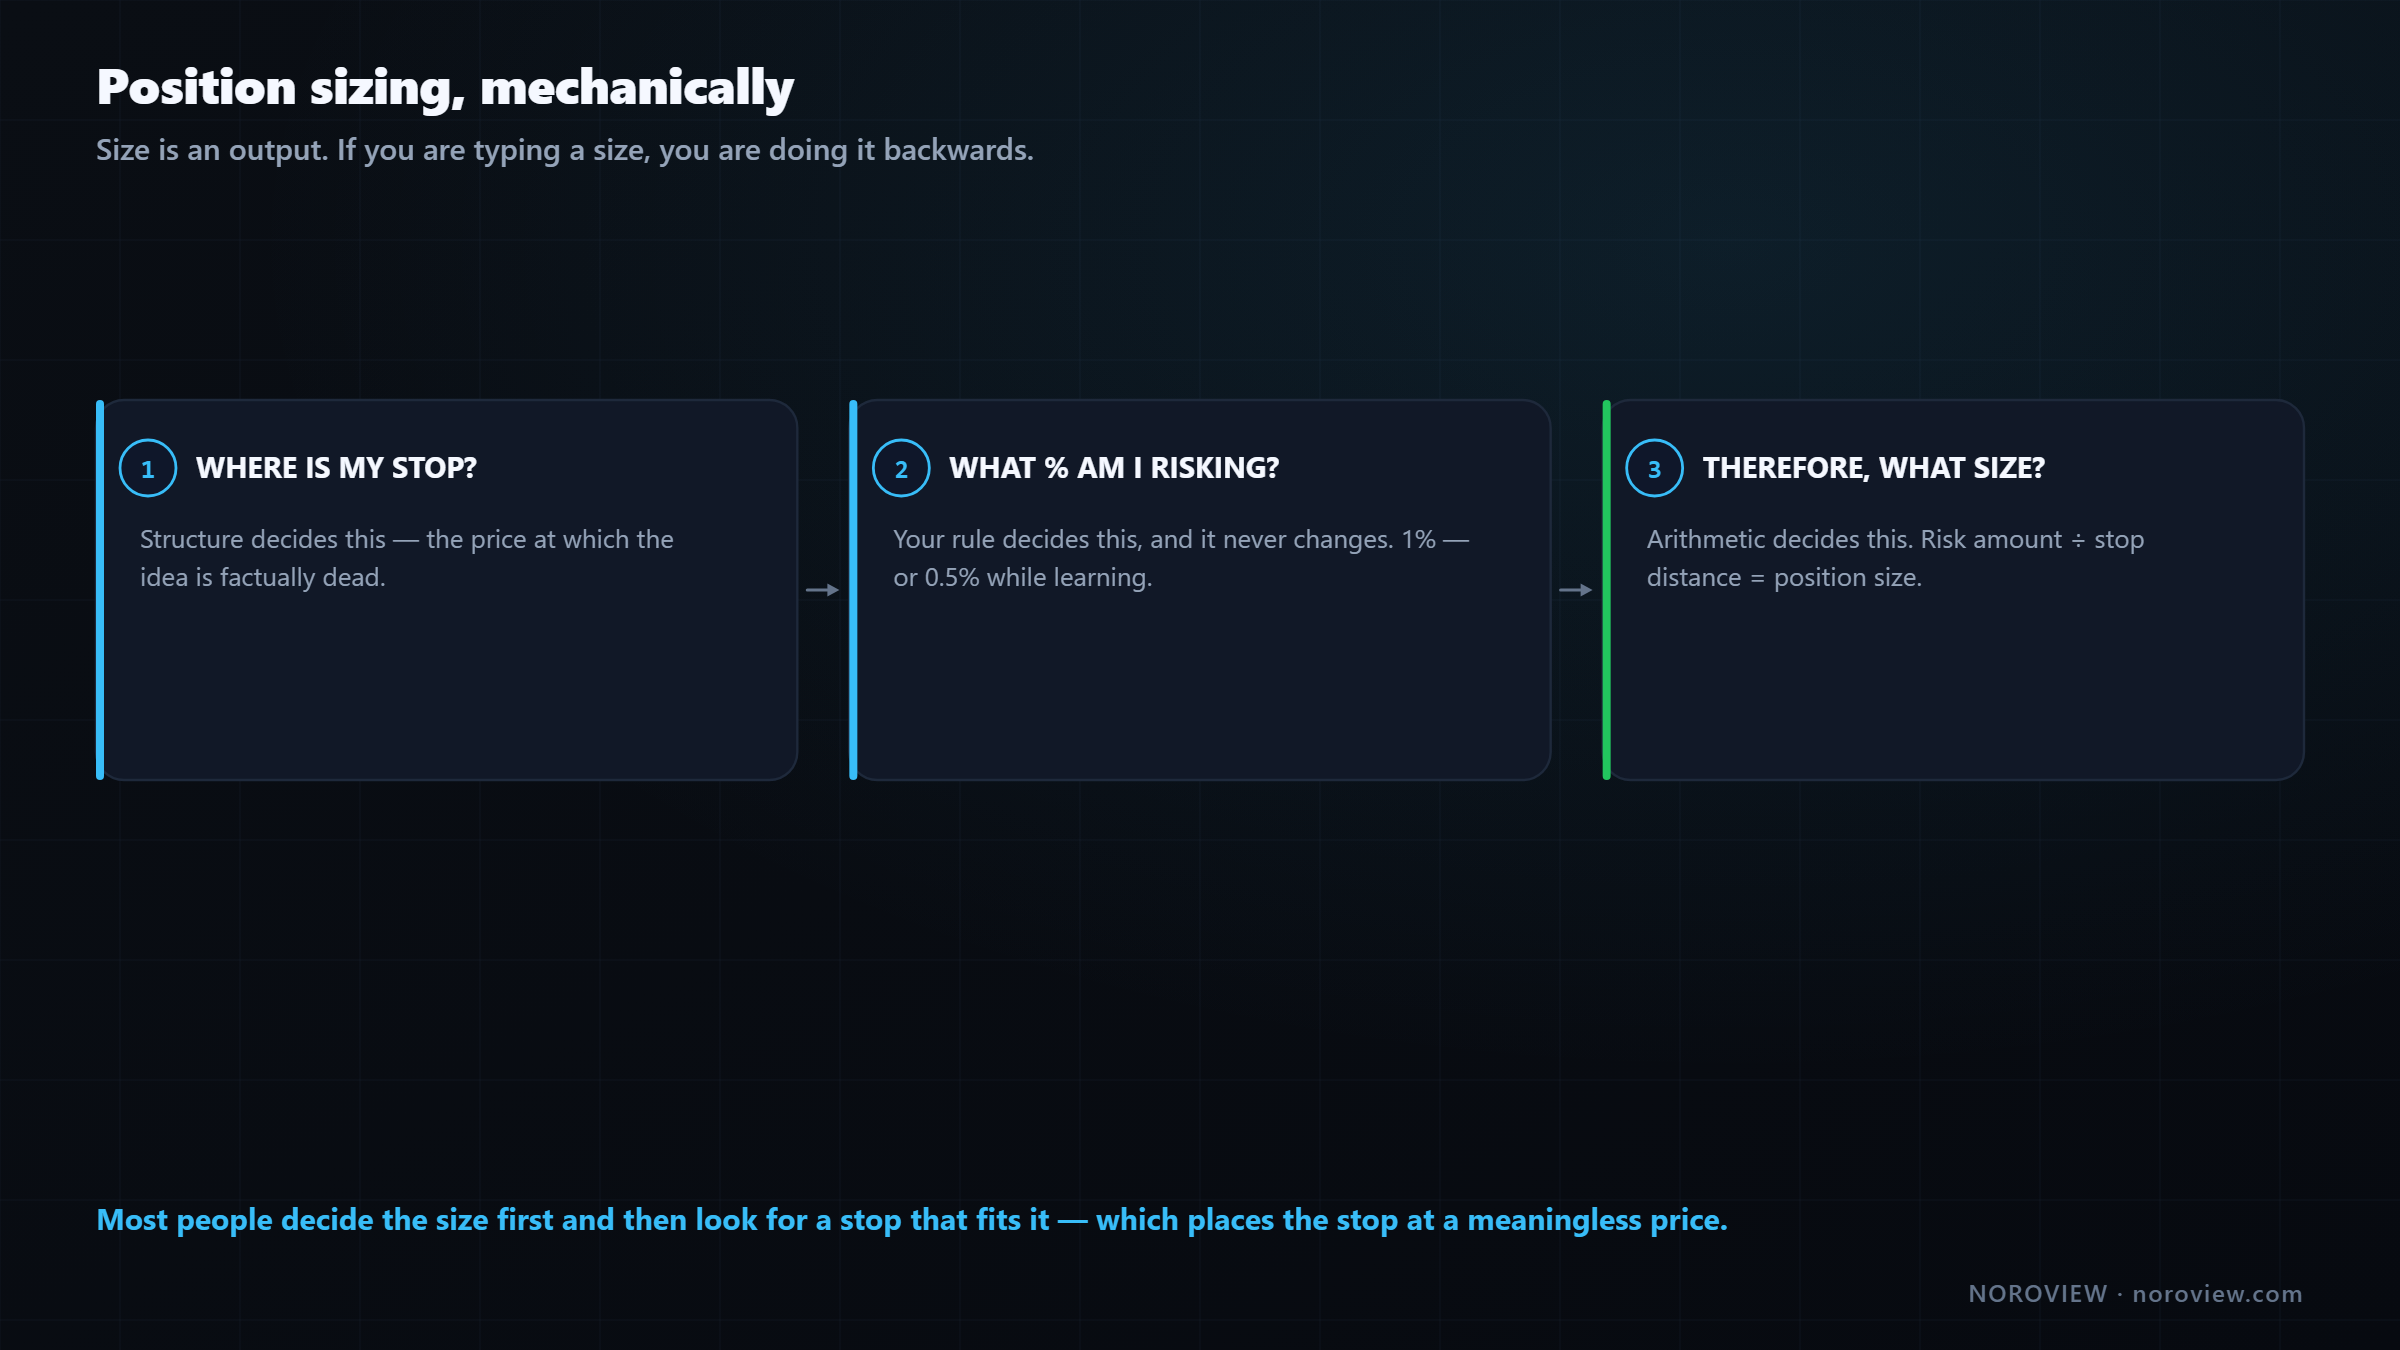
- Where is my stop? — structure decides this
- What percentage am I risking? — my rule decides this, and it never changes
- Therefore, what size? — arithmetic decides this
Size is an output. If you're typing a size, you're doing it backwards.
Most people do it in reverse. They decide "I'll buy one Bitcoin" or "I'll put in $500," and then look for a stop that fits that size. That is how you end up with a stop at a meaningless price — placed because it was comfortable rather than because it was where the idea died.
The worked example
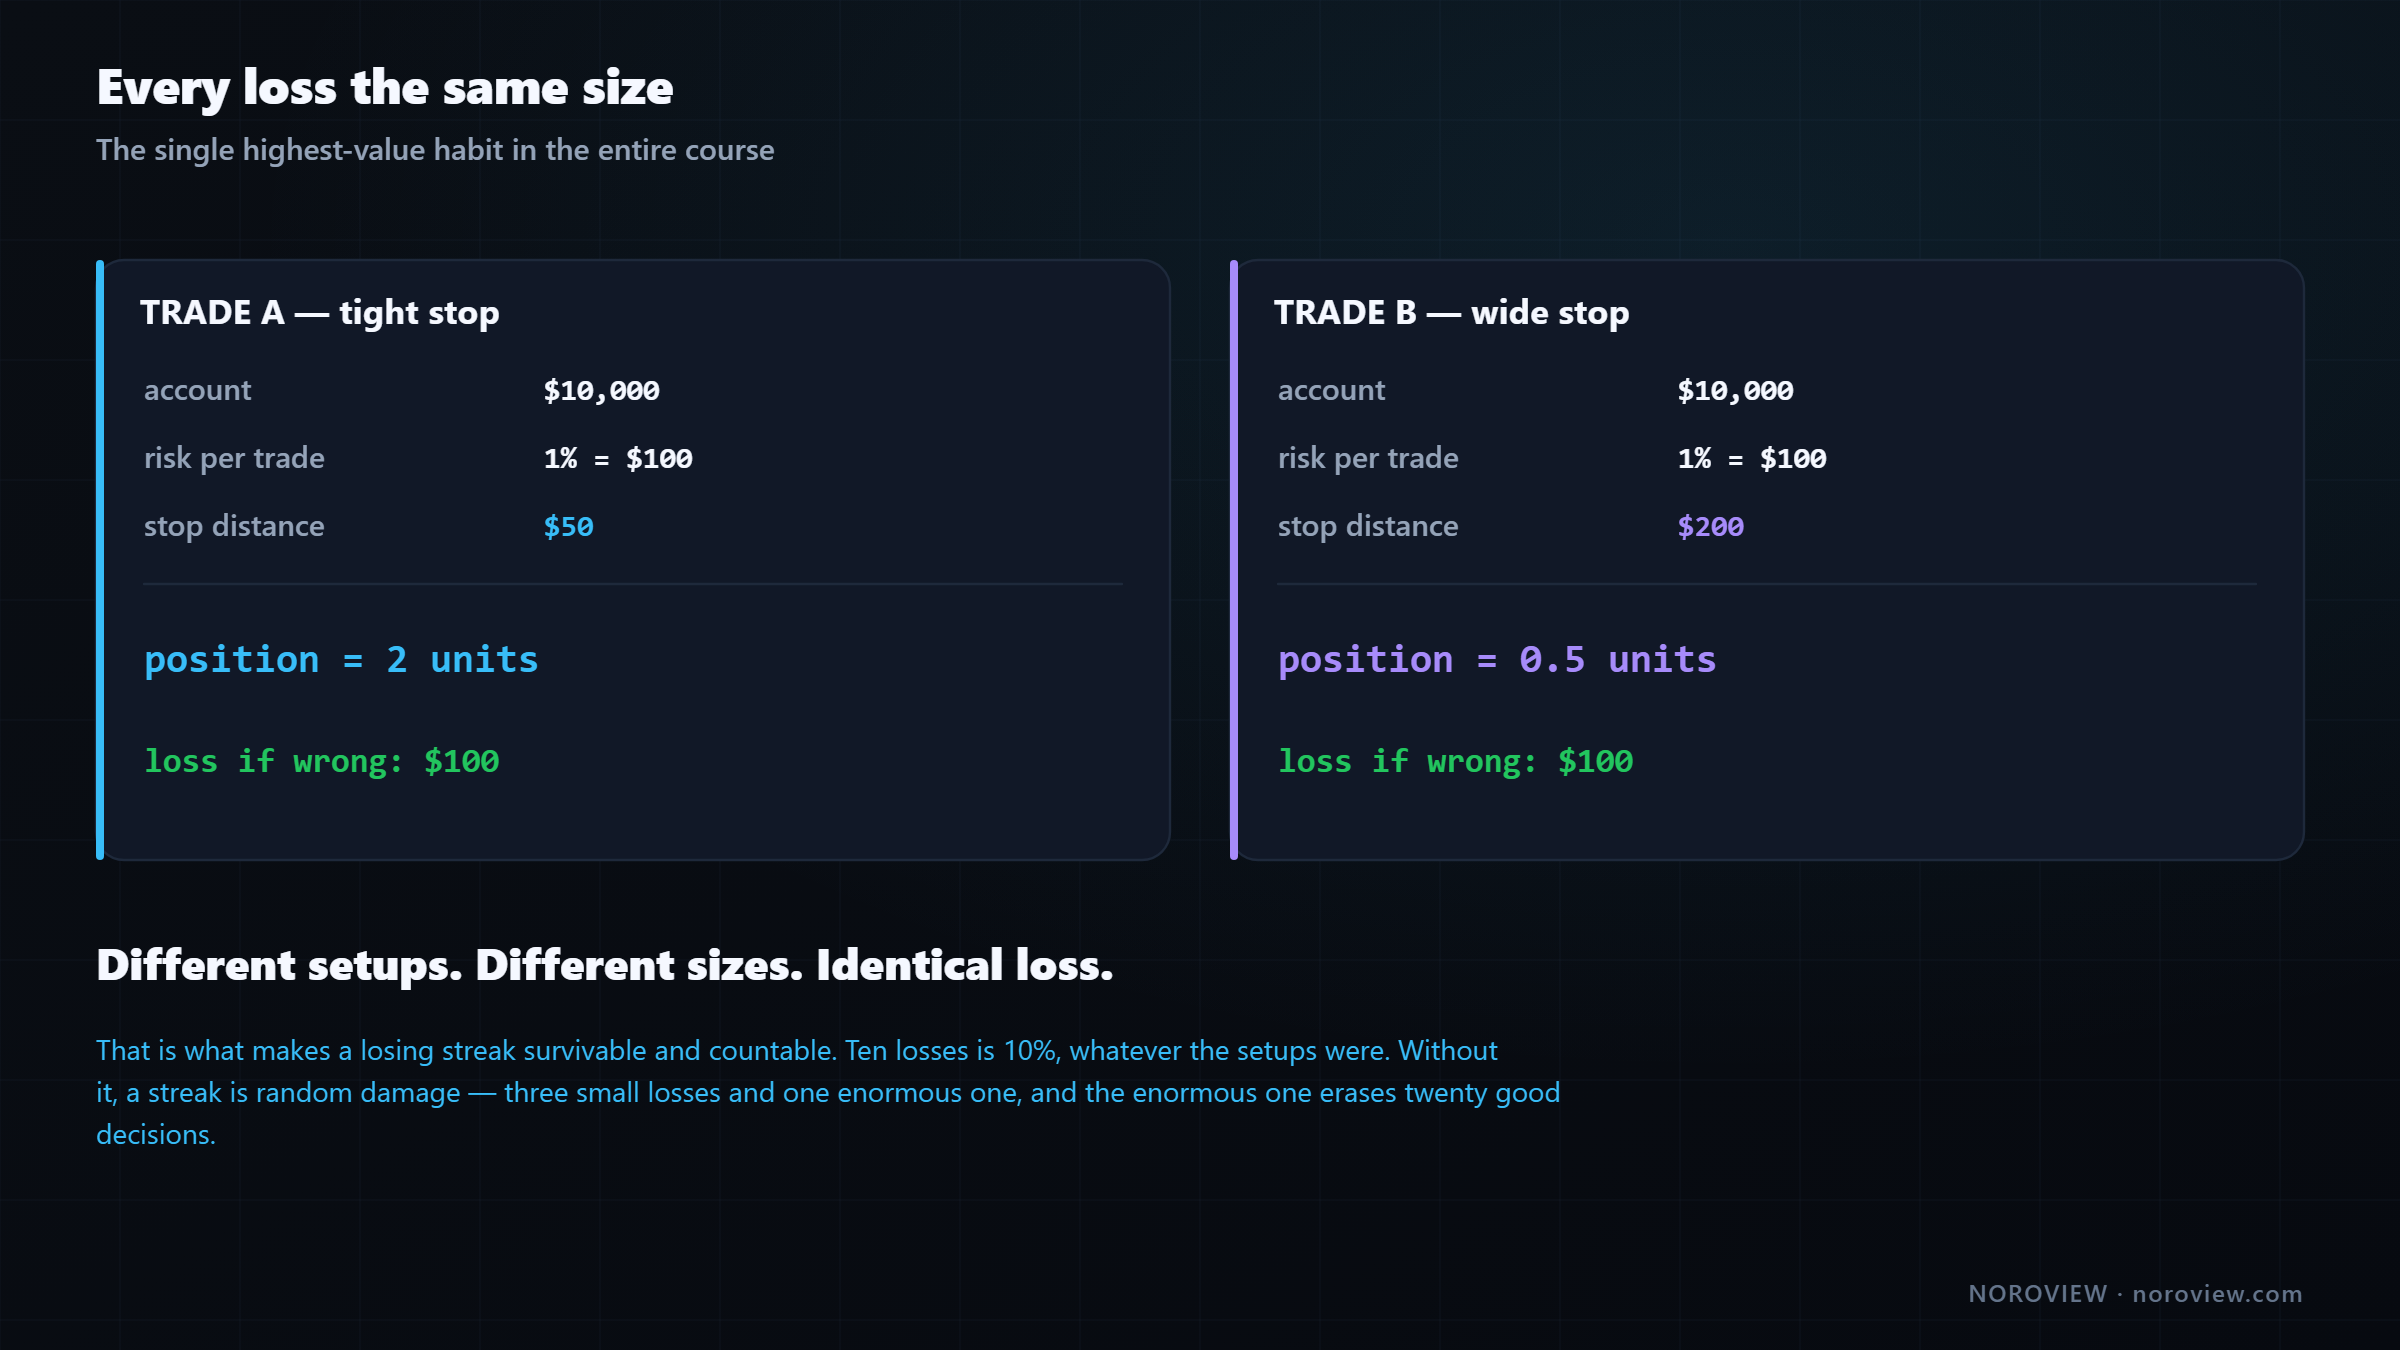
Account: $10,000 · Risk per trade: 1% = $100

Trade A · stop is $50 away   →  position size = $100 ÷ $50  = 2 units
Trade B · stop is $200 away  →  position size = $100 ÷ $200 = 0.5 units

Different setups. Different sizes. IDENTICAL loss if wrong: $100.
Two completely different trades. One has a tight stop, one is much wider, and the position sizes are four times apart. If either is wrong, you lose exactly the same $100.
That's the entire point. Every loss is the same size.
That is what makes a losing streak survivable and countable. Ten losses is 10%, whatever the setups were. You always know exactly where you stand and can plan around it. Without this, a losing streak is random damage — three small losses and one enormous one, and the enormous one erases twenty good decisions.
NOROVIEW's order ticket has a risk calculator built in: switch from Quantity to By risk, tell it what percentage of equity you are willing to lose, and it derives the size from your stop distance.
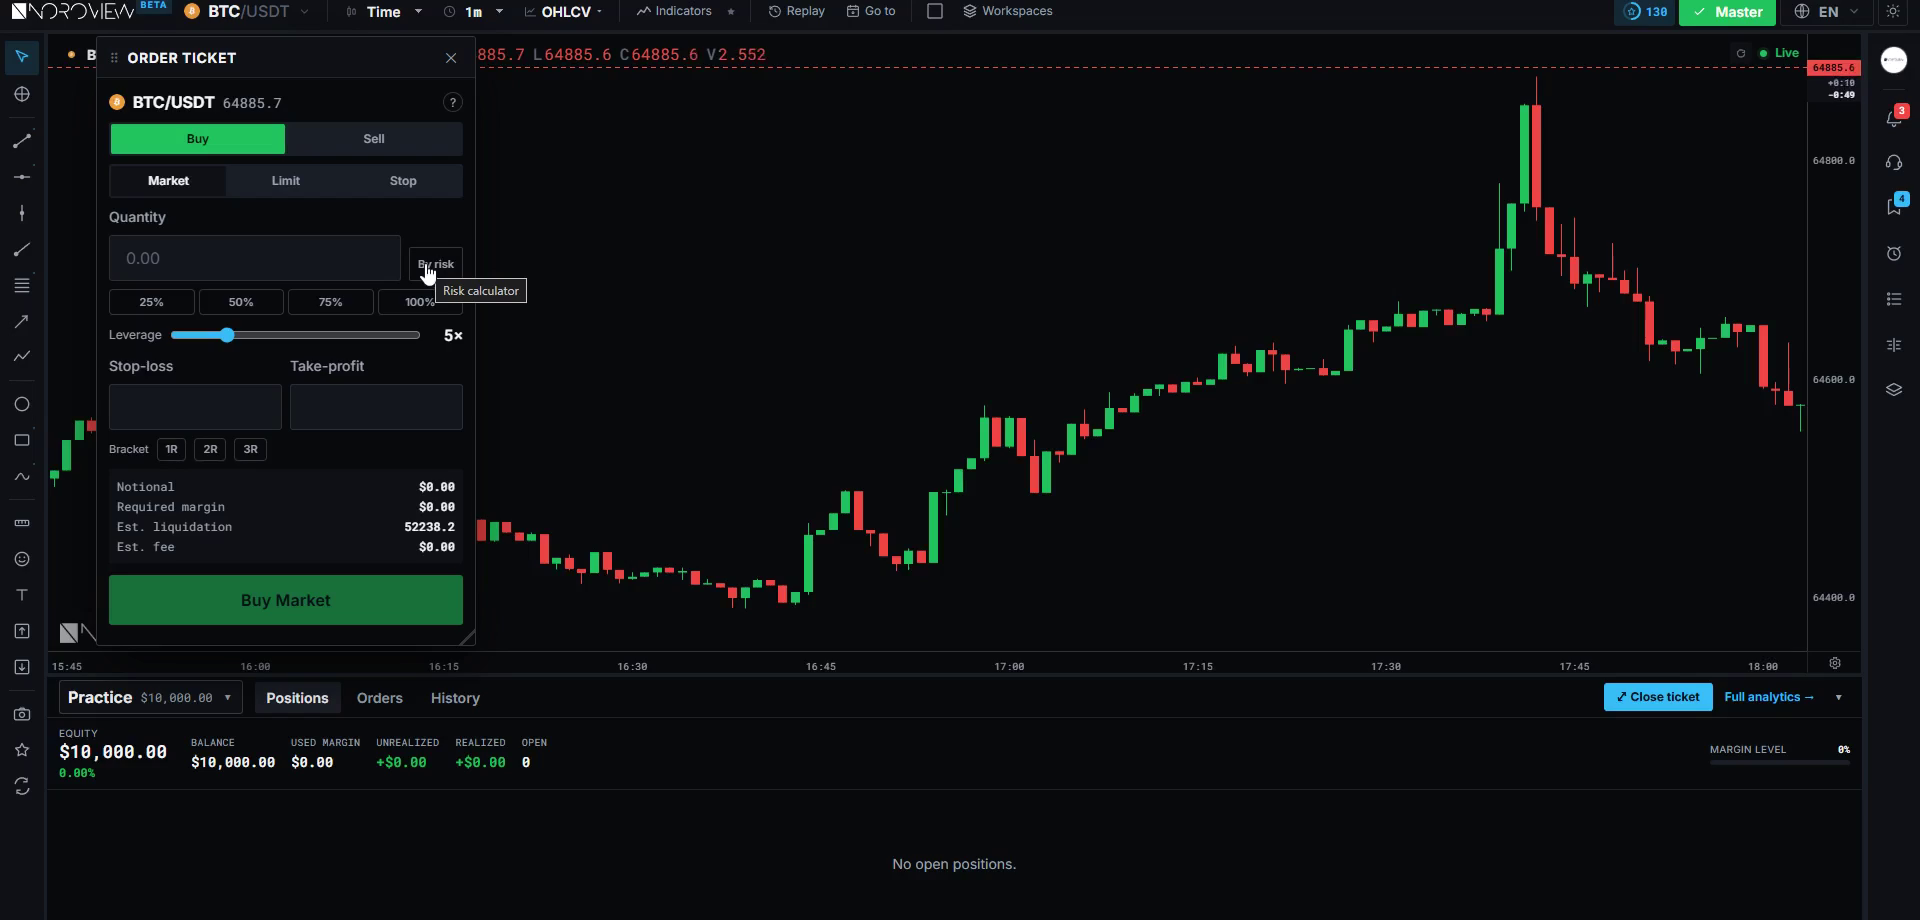
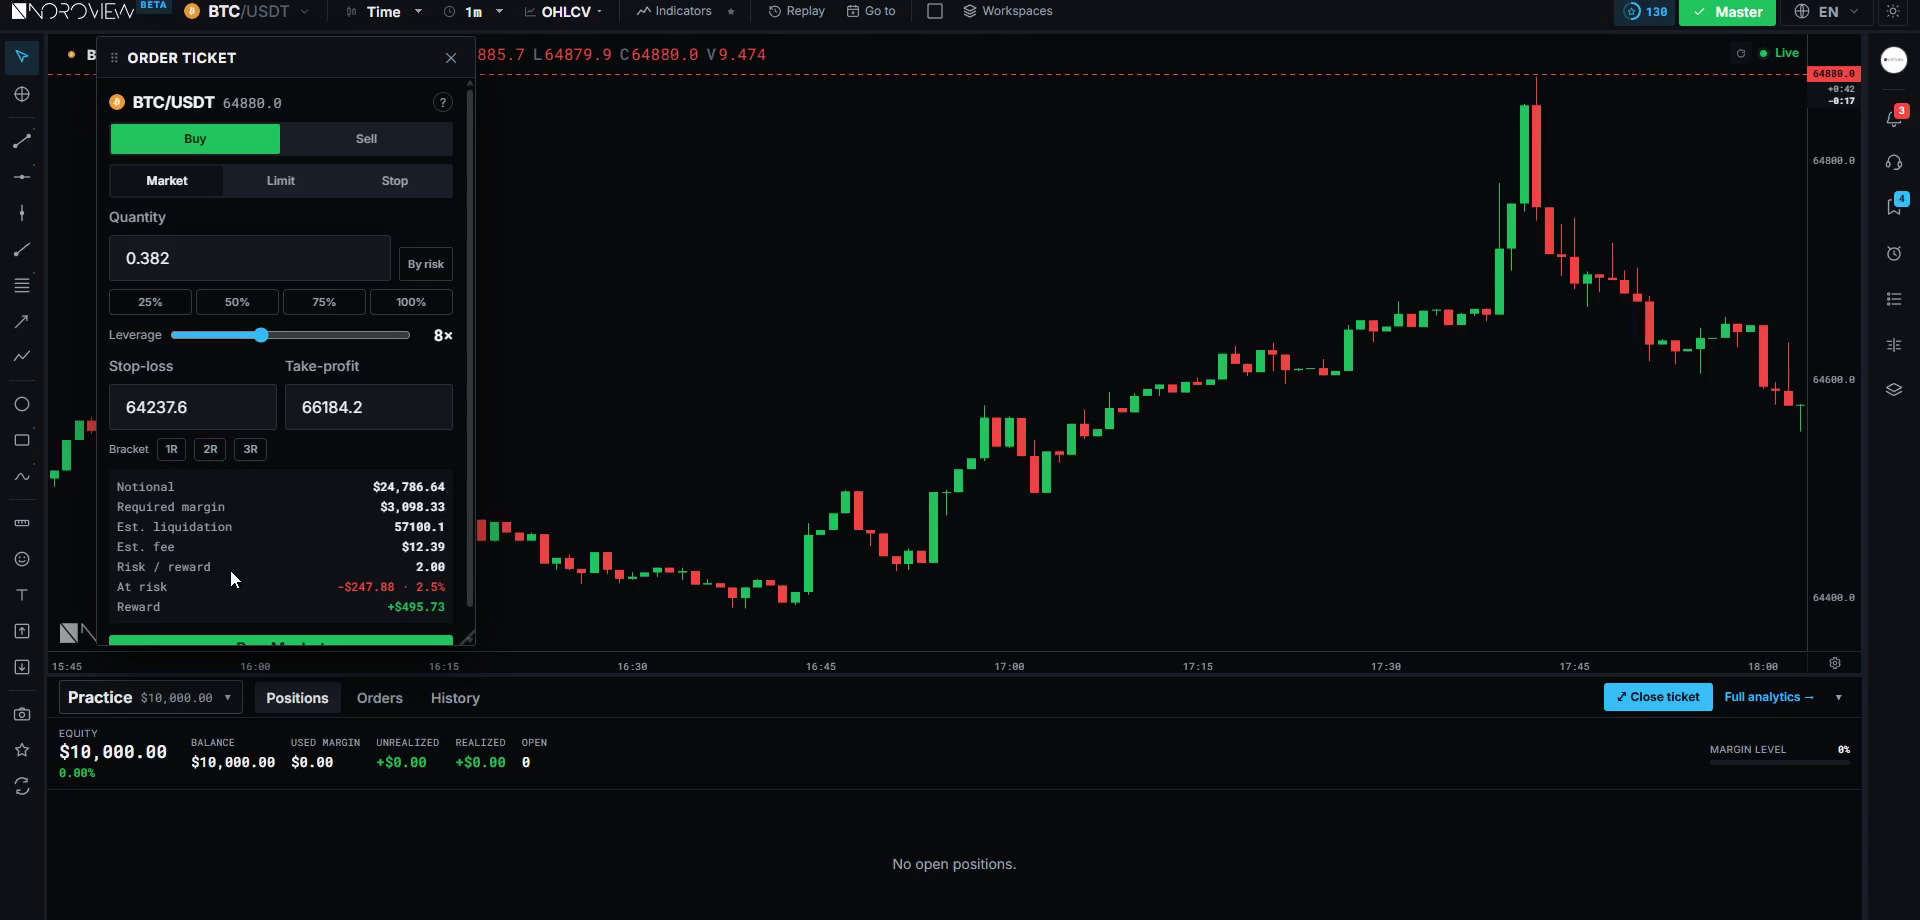
Look at the "at risk" number before every single trade. If it does not match your rule, the size is wrong. It takes one second, and it is the last checkpoint before your money is exposed.
▶ Try this now
Create a paper account, open the order ticket, and switch sizing to By risk. Set 1%, drag a stop, and watch the quantity change. Then drag the stop twice as far and watch the quantity halve. Sixty seconds, and it makes the relationship permanent. Launch NOROVIEW free →
The drawdown arithmetic
If you have never seen this, it lands hard.
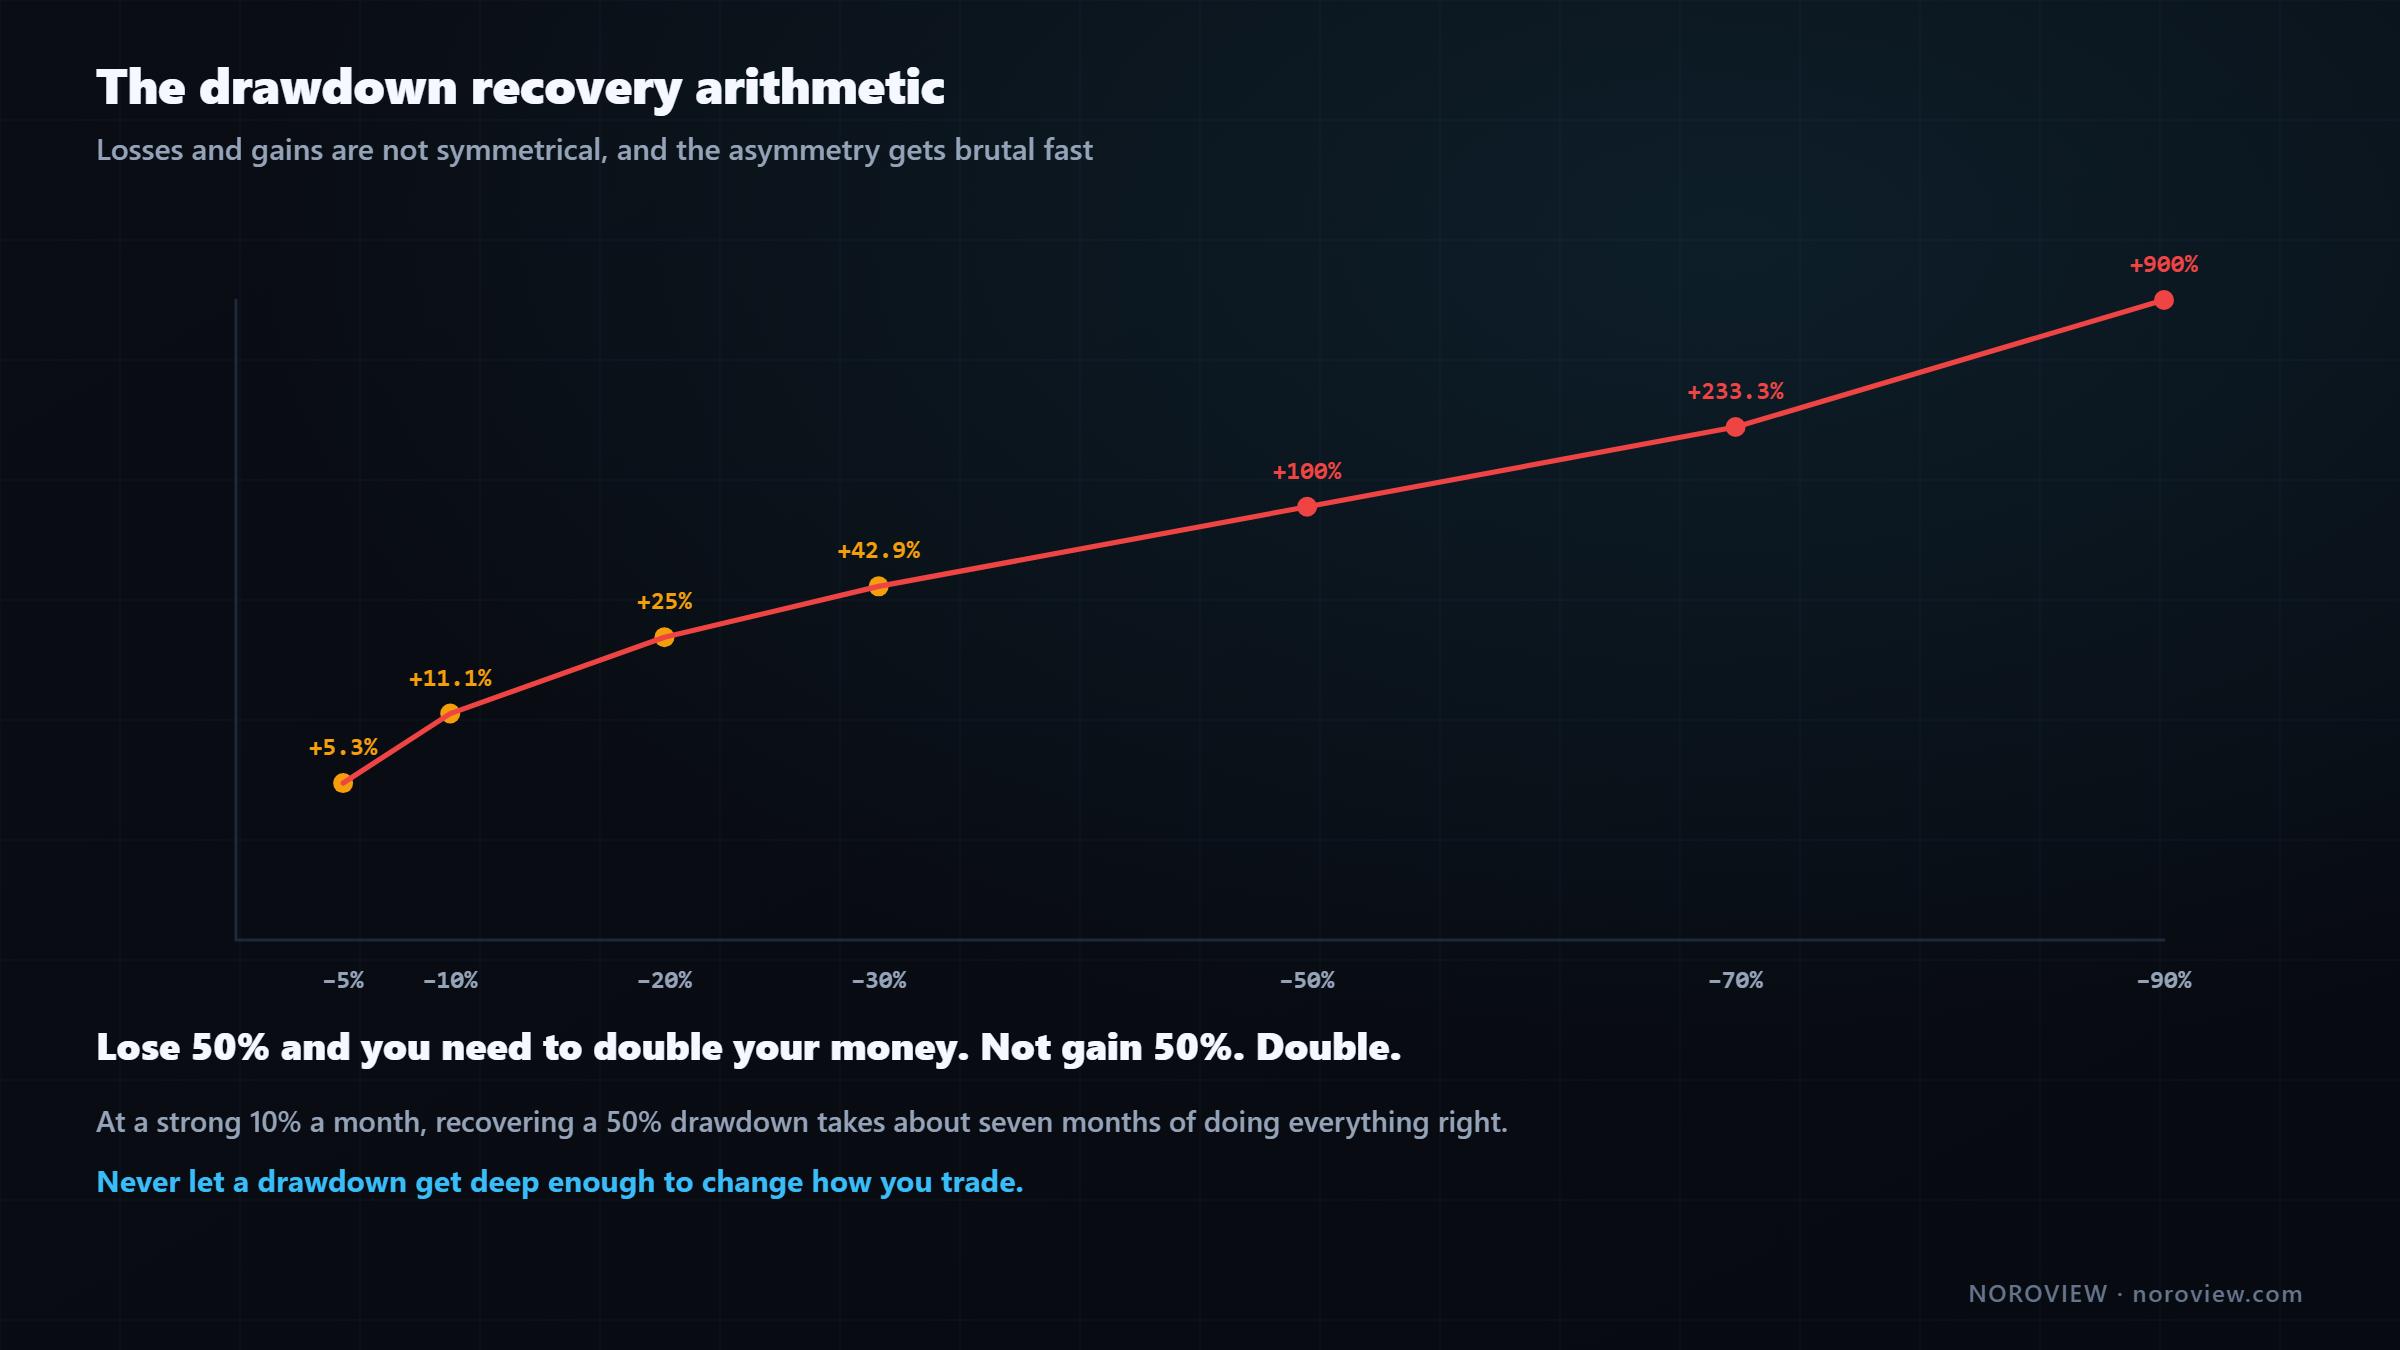 Losses and gains are not symmetrical, and the asymmetry gets brutal fast.
| Lose this much | You need this much to get back |
|---|---|
| −5% | +5.3% |
| −10% | +11.1% |
| −20% | +25.0% |
| −30% | +42.9% |
| −50% | +100.0% |
| −70% | +233.3% |
| −90% | +900.0% |
Lose 10%, you need 11% to get back — barely different, fine. Lose 30%, you need almost 43%. Lose 50% and you need to double your money. Lose 90% — which is roughly where a blown account sits when somebody says "I lost it all" — and you need 900% to get back to even.
Now hold that next to lesson 1. A good month is 5–15%.
At 10% a month, recovering a 50% drawdown takes about 7 months.
Seven months of doing everything right, to get back to where you already were. And that assumes you can trade at your best while sitting in a hole, which almost nobody can.
That is the real cost of a large drawdown, and it is not the money:
A deep drawdown doesn't just cost capital. It costs the ability to trade well.
You start trading scared. You cut winners early because you need the win. You take marginal setups because you need to catch up. The drawdown creates the behaviour that deepens the drawdown.
Which is why the rule is not "risk a small amount because it is prudent." It is:
Never let a drawdown get deep enough to change how you trade.
Losing streaks are normal
People underestimate this enormously. At a coin-flip win rate, over a hundred trades:
| Streak | Likelihood |
|---|---|
| 5 losses in a row | Almost certain |
| 6 losses in a row | Likely |
| 7 losses in a row | Quite possible |
| 8 losses in a row | Happens |
A run of six or seven losses is not unusual. It is expected. It is what randomness looks like.
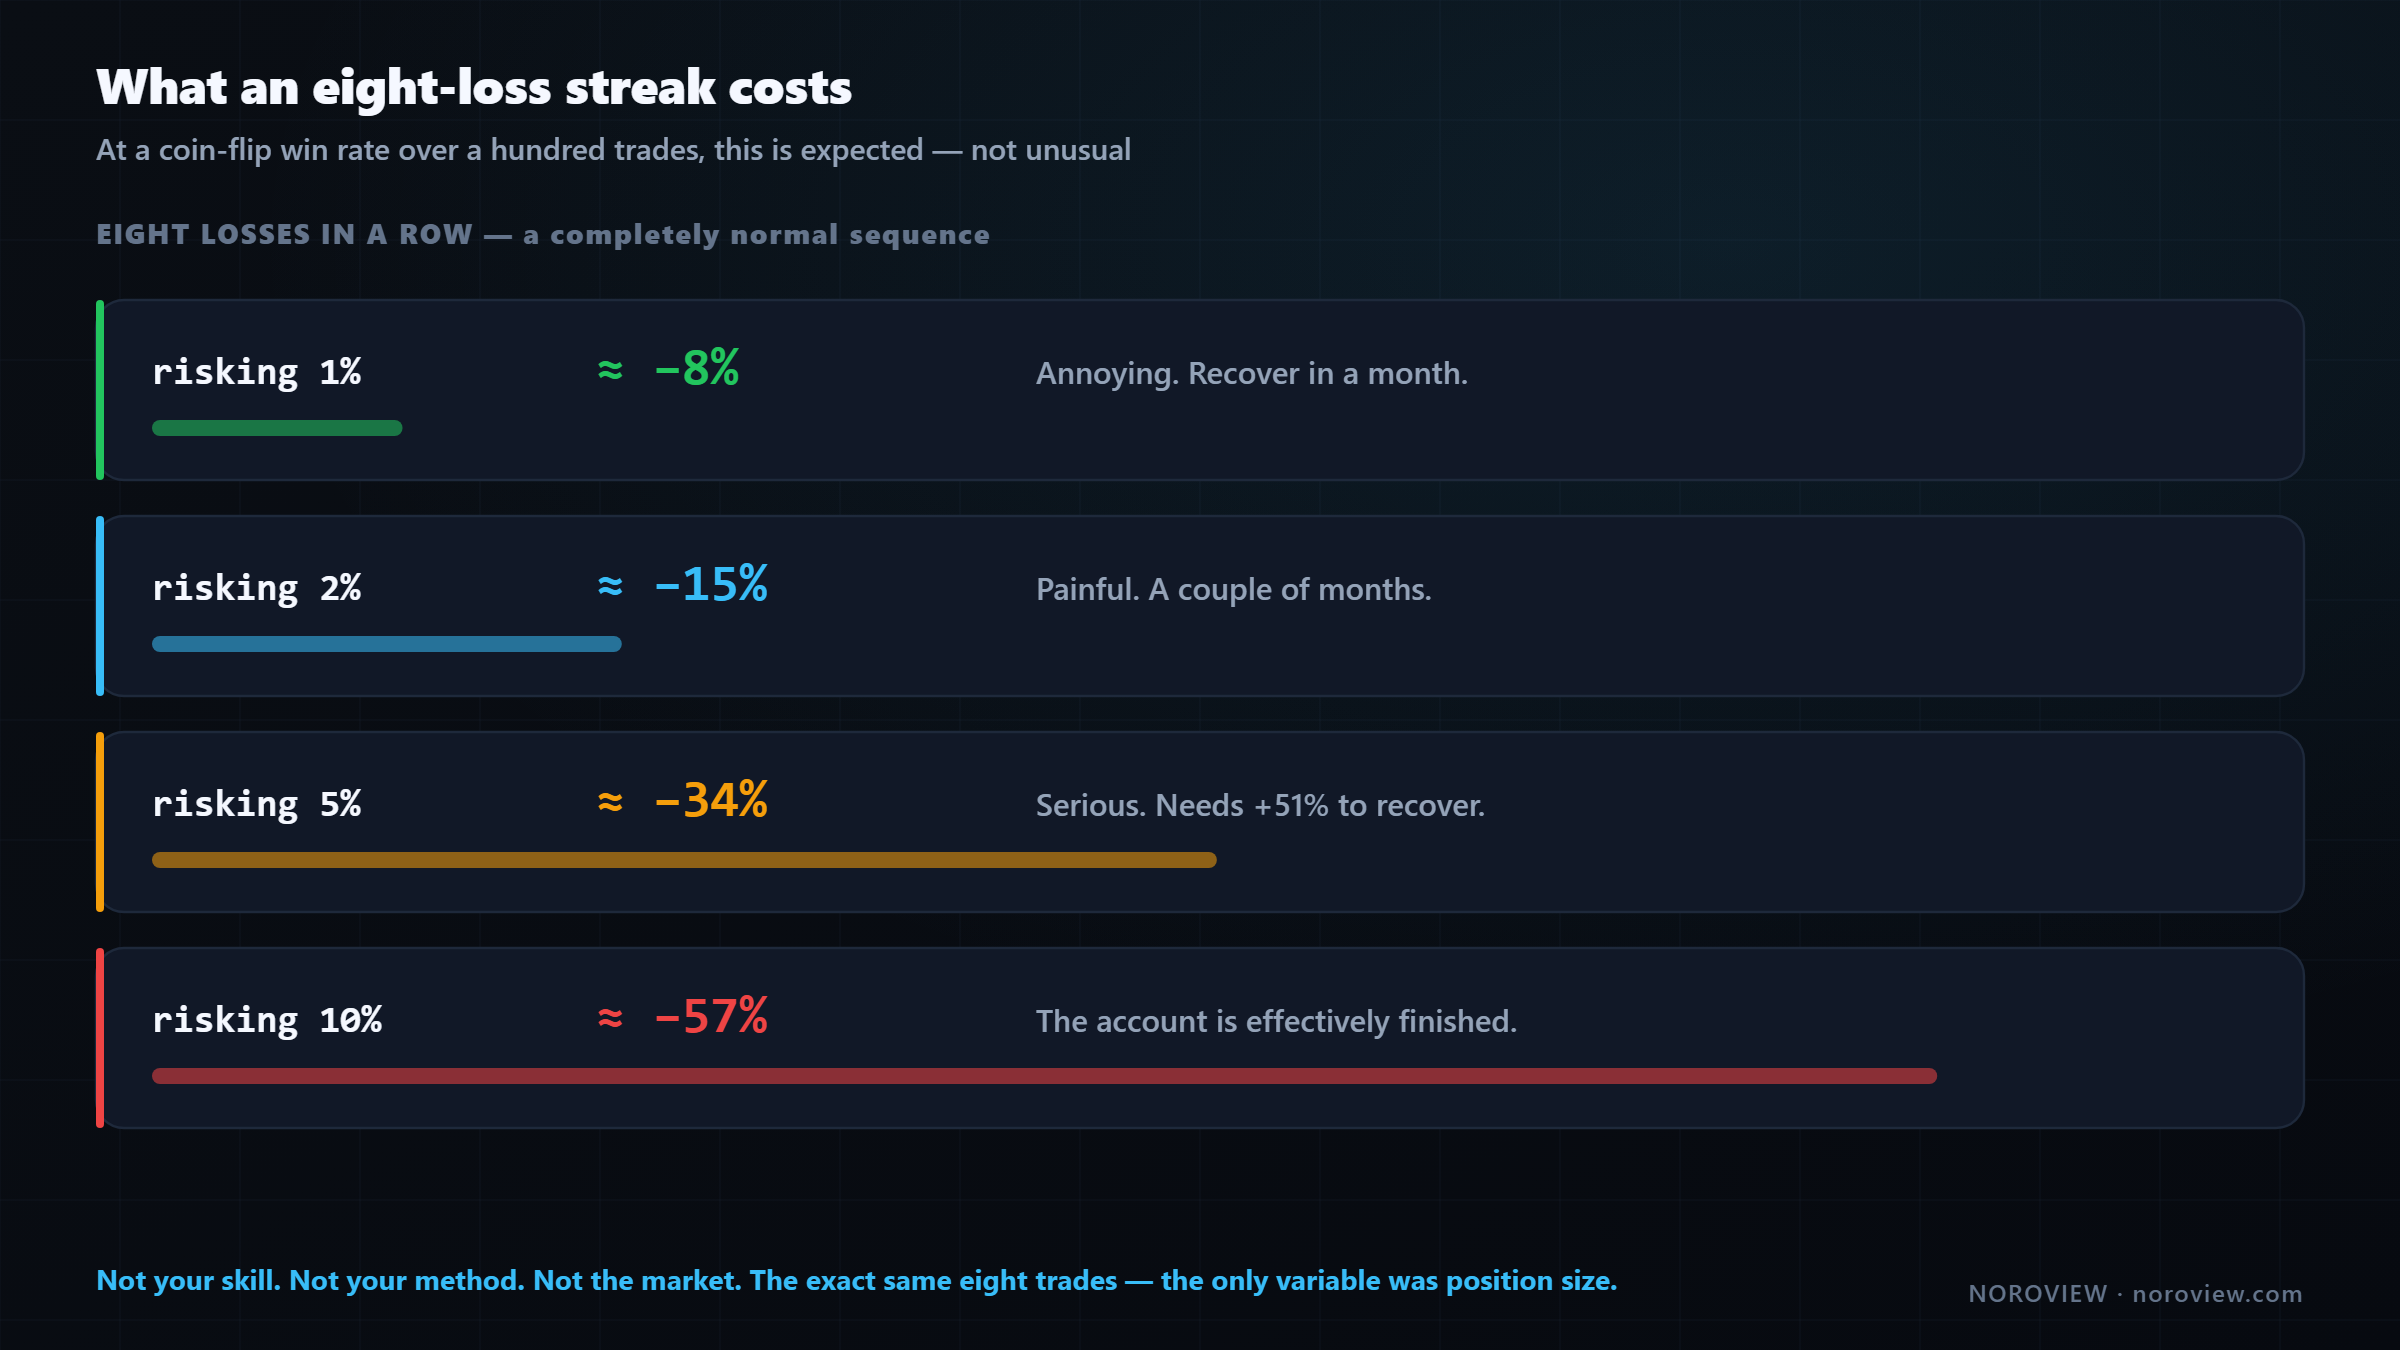
So the question is not whether you will have a losing streak. You will. The question is what an eight-loss streak does to your account.
| Risking | After 8 losses | Verdict |
|---|---|---|
| 1% | down ~8% | Annoying. Recover in a month |
| 2% | down ~15% | Painful. A couple of months |
| 5% | down ~34% | Serious. Needs +51% to recover |
| 10% | down ~57% | The account is effectively finished |
Notice what did not change across those rows. Not your skill. Not your method. Not the market. The exact same eight trades.
Position size is the difference between a bad fortnight and a finished account.
The number
1% per trade. While you're learning: 0.5%.
And while you are still learning — which for most people is the next year or more — use half a percent. Your edge is not proven yet, so your job is to maximise the number of trades you get to take while finding out whether you have one. Small size is how you buy more reps.
The honest objection: "1% of my account is $3, that's not worth it."
Then your problem is account size — and you don't solve that with risk.
If 1% of your account is too small to feel meaningful, that is a capital problem, and you solve capital problems with time and savings. You do not solve them with 10% risk, because that path has a mathematically certain ending. The published research on retail day traders is unambiguous on this: Chague, De-Losso and Giovannetti (2020) found that of individuals who persisted at day trading for over 300 days, the overwhelming majority lost money.
Prove the edge before you risk a cent
NOROVIEW's paper trading fills only on the live market, timestamps are server-stamped, and closed trades can never be edited or deleted — so the track record actually means something. Create a free account → · Compare plans
The limits
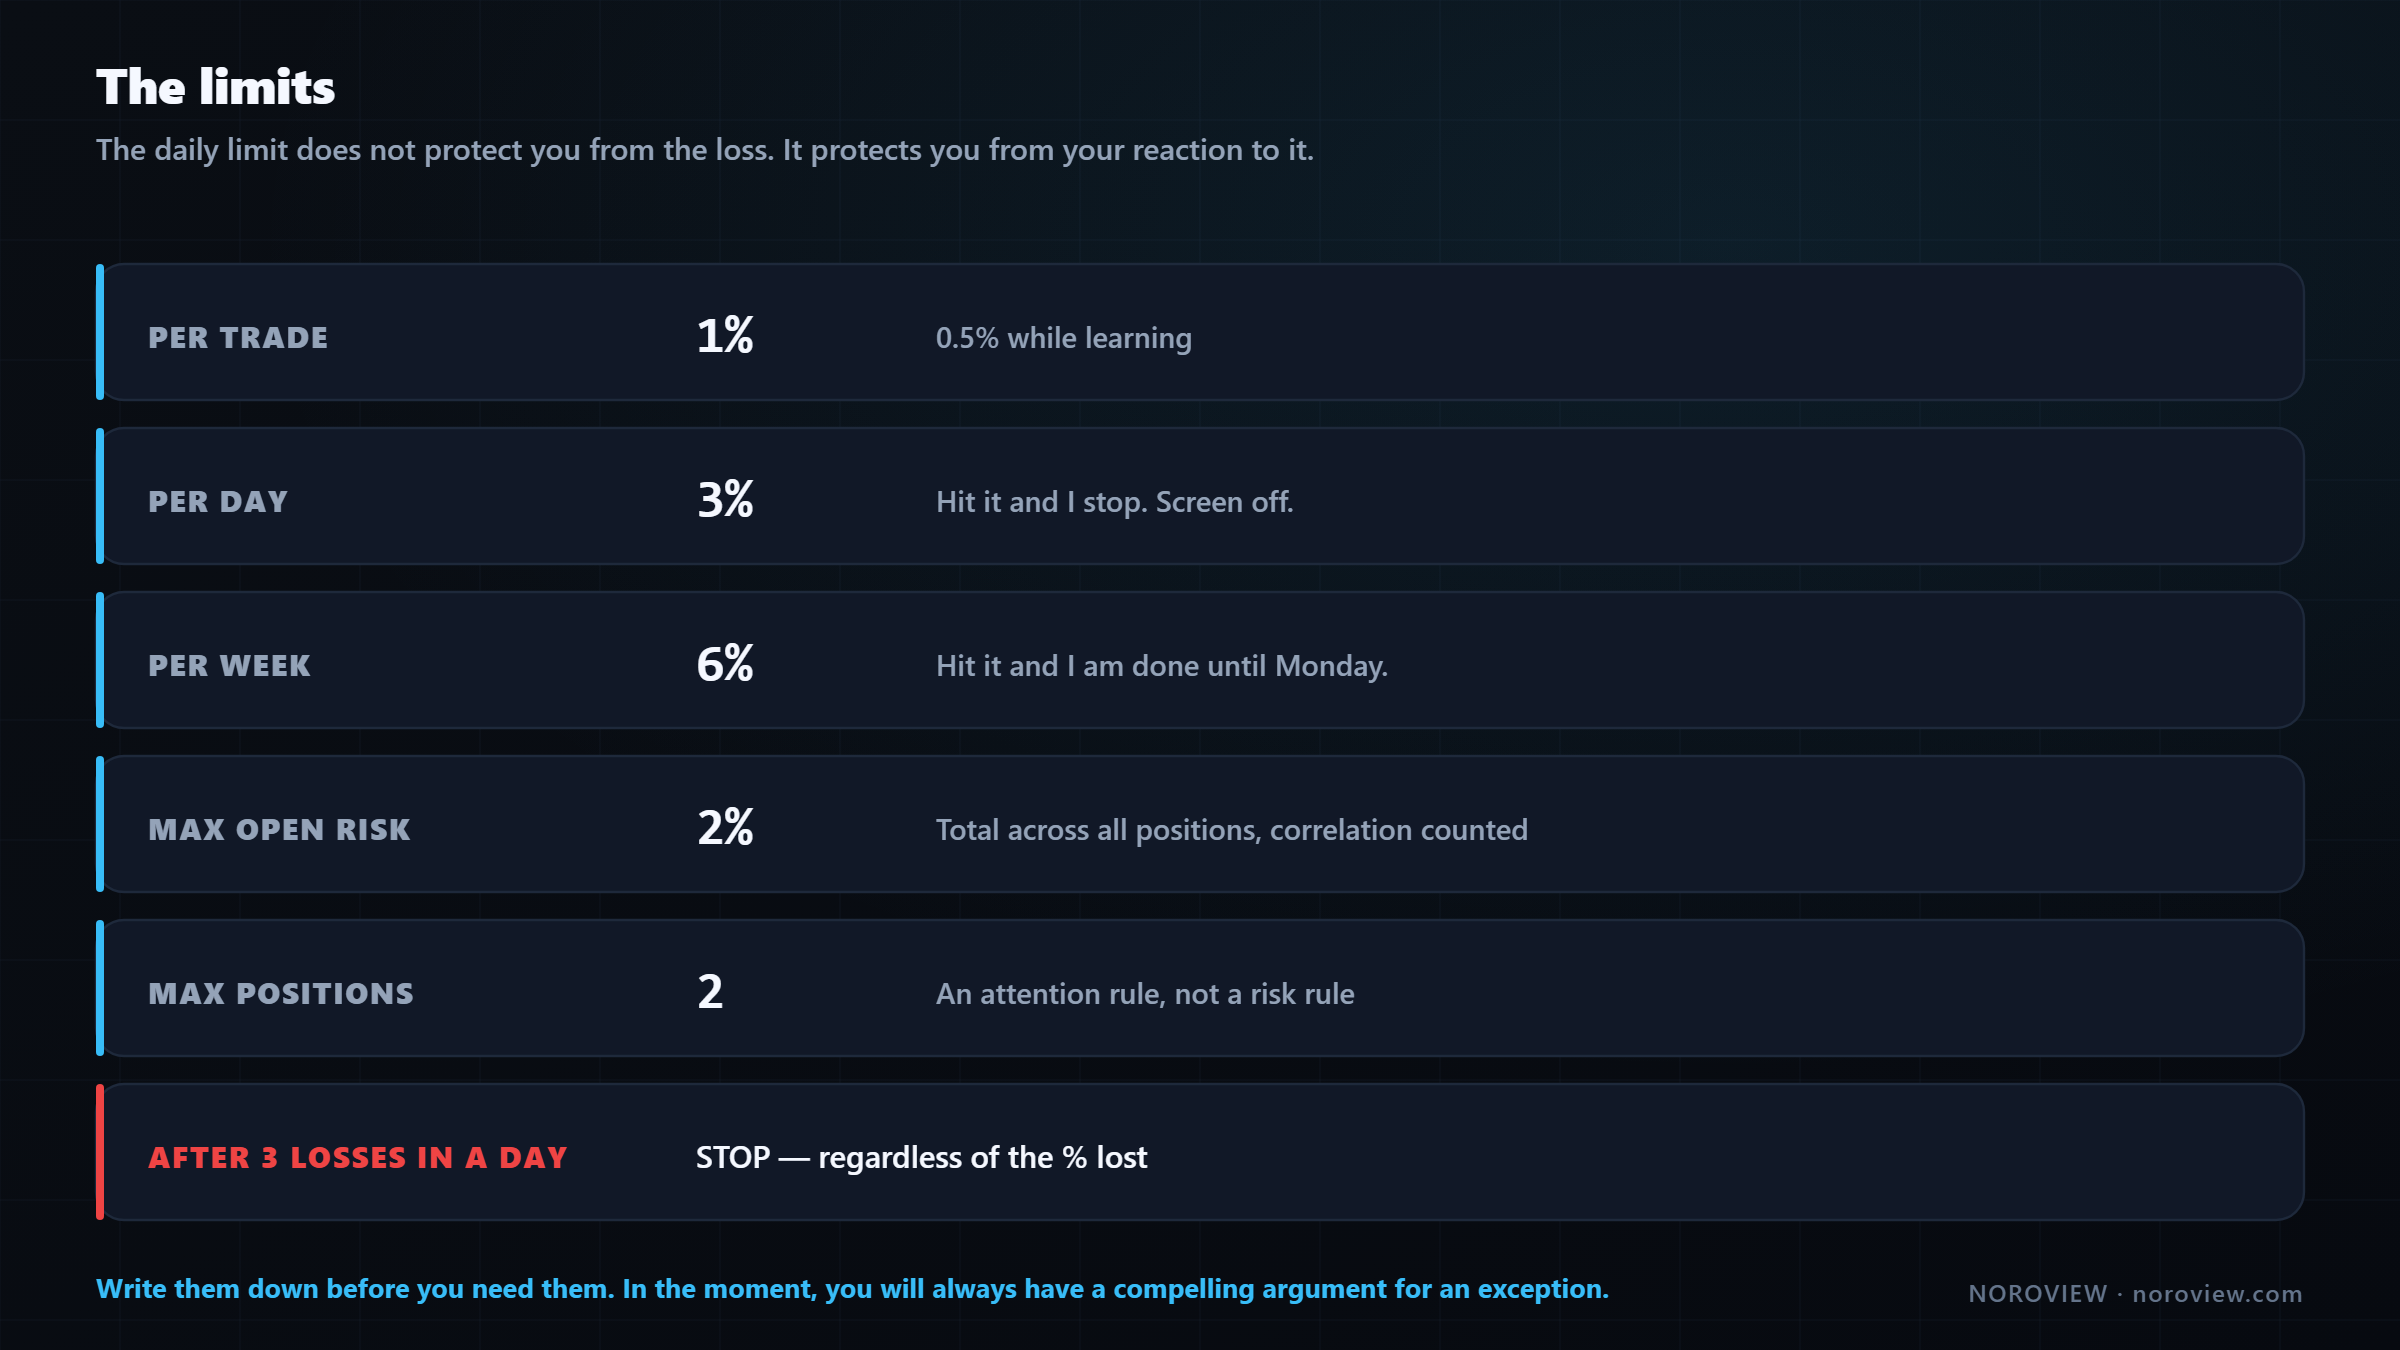
MY LIMITS

  Per trade         1%   (0.5% while learning)
  Per day           3%   — hit it, and I stop. Screen off.
  Per week          6%   — hit it, and I'm done until Monday.
  Max open risk     2%   — total across ALL open positions, correlation counted
  Max positions     2    — I cannot watch more than two properly

  After 3 losses in a day → stop, regardless of the % lost.
3% per day. Lose three percent in a day and you are finished for that day. Not "one more careful trade." Finished. Charts closed.
A 3% day is not a disaster on its own — that is recoverable in a week. What is not recoverable is what happens next, when you try to win it back on the same day. That is where 3% becomes 12%.
The daily limit doesn't protect you from the loss. It protects you from your reaction to it.
6% per week. Same principle, longer horizon. Almost always, a bad week means you are misreading the current market regime — and the correct response to misreading the market is to stop trading it, not to try harder.
2% maximum open risk, in total. The one people forget. Two positions open, each risking 1%, means 2% open risk. And if they are correlated, you do not really have two positions — you have one position at double size. Two long crypto positions in a market where everything moves together is one bet, and treating it as two is how people take a 4% loss on a "1% risk" plan.
Maximum two positions. Not a risk rule, an attention rule. You cannot properly watch order flow on more than two things. Anybody managing six positions is managing none of them.
Three losses in a day → stop, regardless of the amount. Three losses in one session usually means either the market is not offering your setup today, or you are not seeing it correctly today. Both have the same correct response.
Write your limits down BEFORE you need them. That's the whole trick.
Write them now, while you are calm, and treat them as external. Because in the moment you need them you will have a genuinely compelling argument for why today is an exception. You always do. The rule exists precisely because that argument is always available and always wrong.
Capital management: the layer above the account
Risk management is inside the account. Capital management is the layer above it, and it decides whether trading damages your life.
- Only money you could lose completely without changing your life. Not "would be annoying to lose." Could lose entirely.
- Never money that has a job. Rent, tuition, medical, money owed. Money with a deadline attached makes you trade to a deadline — and the market does not know about your deadline.
- Never borrowed money. Ever. Not a loan, not a credit card, not money from family. And the specific reason matters: borrowed money changes your decision-making, not just your risk. Every trade now carries an obligation that exists whether or not the trade works, so you cannot cut a loss cleanly when cutting it means you still owe the money. So you hold. And hoping is not a strategy.
- Do not keep all your trading capital on the exchange. Exchanges can be hacked, frozen, or restricted in your jurisdiction — a risk that has nothing to do with your trading. Working capital there, the rest elsewhere.
- Take profit out. When the account grows, withdraw some. It feels like it slows compounding, and it does, slightly. What it buys is more valuable: it makes the money real. Money that has never left the account is a number on a screen, and numbers on a screen are easy to gamble with.
Decision vs outcome
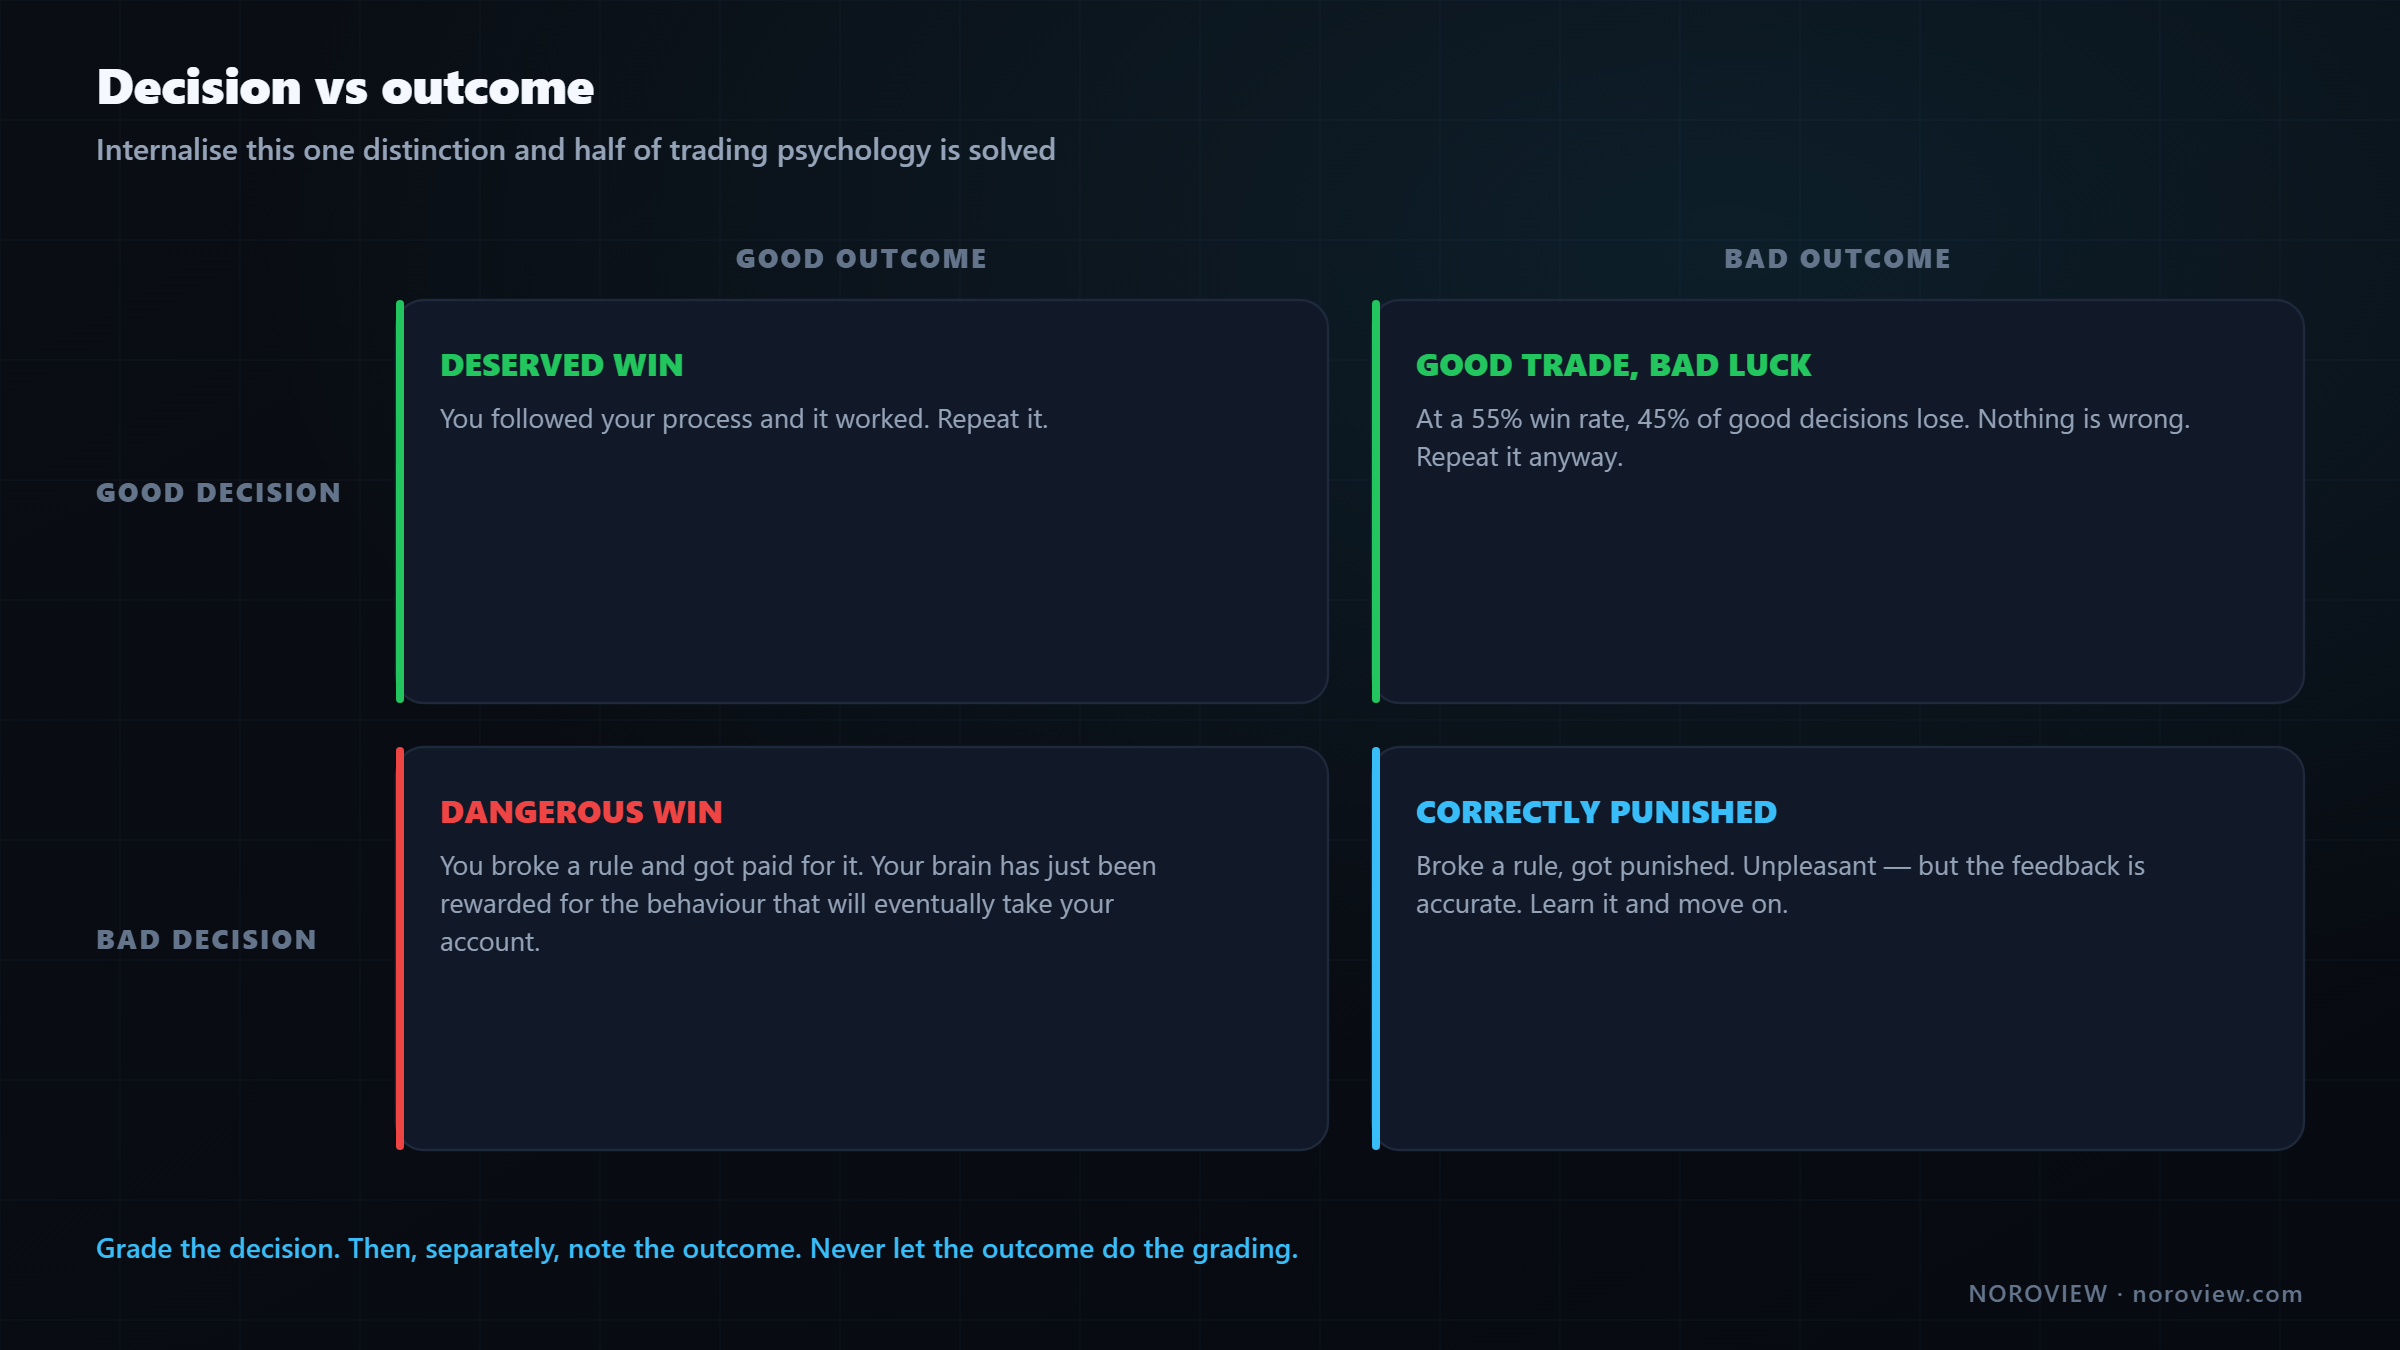
If you internalise one distinction, make it this one. It fixes about half of trading psychology on its own.
| Good outcome | Bad outcome | |
|---|---|---|
| Good decision | ✅ Deserved win — repeat it | ✅ Good trade, bad luck — repeat it anyway |
| Bad decision | ⚠️ Dangerous win — the worst box | ✅ Correctly punished — learn and move on |
Good decision, bad outcome is the box people cannot handle. They conclude the method is broken and change it. Nothing is wrong. At a 55% win rate, 45% of your good decisions lose money. That is not a malfunction, that is the distribution.
And the dangerous box:
A rule-breaking trade that WINS is the most expensive thing that can happen to you.
You chased an entry, skipped the blockers, doubled the size — and it worked. You made money. And you have just been rewarded for the exact behaviour that will eventually take your account. Your brain does not know it was a bad decision; it knows it made money. It will do it again, bigger, and eventually on the day that does not forgive it.
Grade the decision. Then, separately, note the outcome. Never let the outcome do the grading.
After every trade, ask in the right order: did I follow my process — yes or no? That is the grade. The profit or loss is a number that came afterwards, and over a small number of trades it carries almost no information about how well you traded.
The five states that break traders
Everybody experiences all five. What separates people is whether they can name them while they are happening.
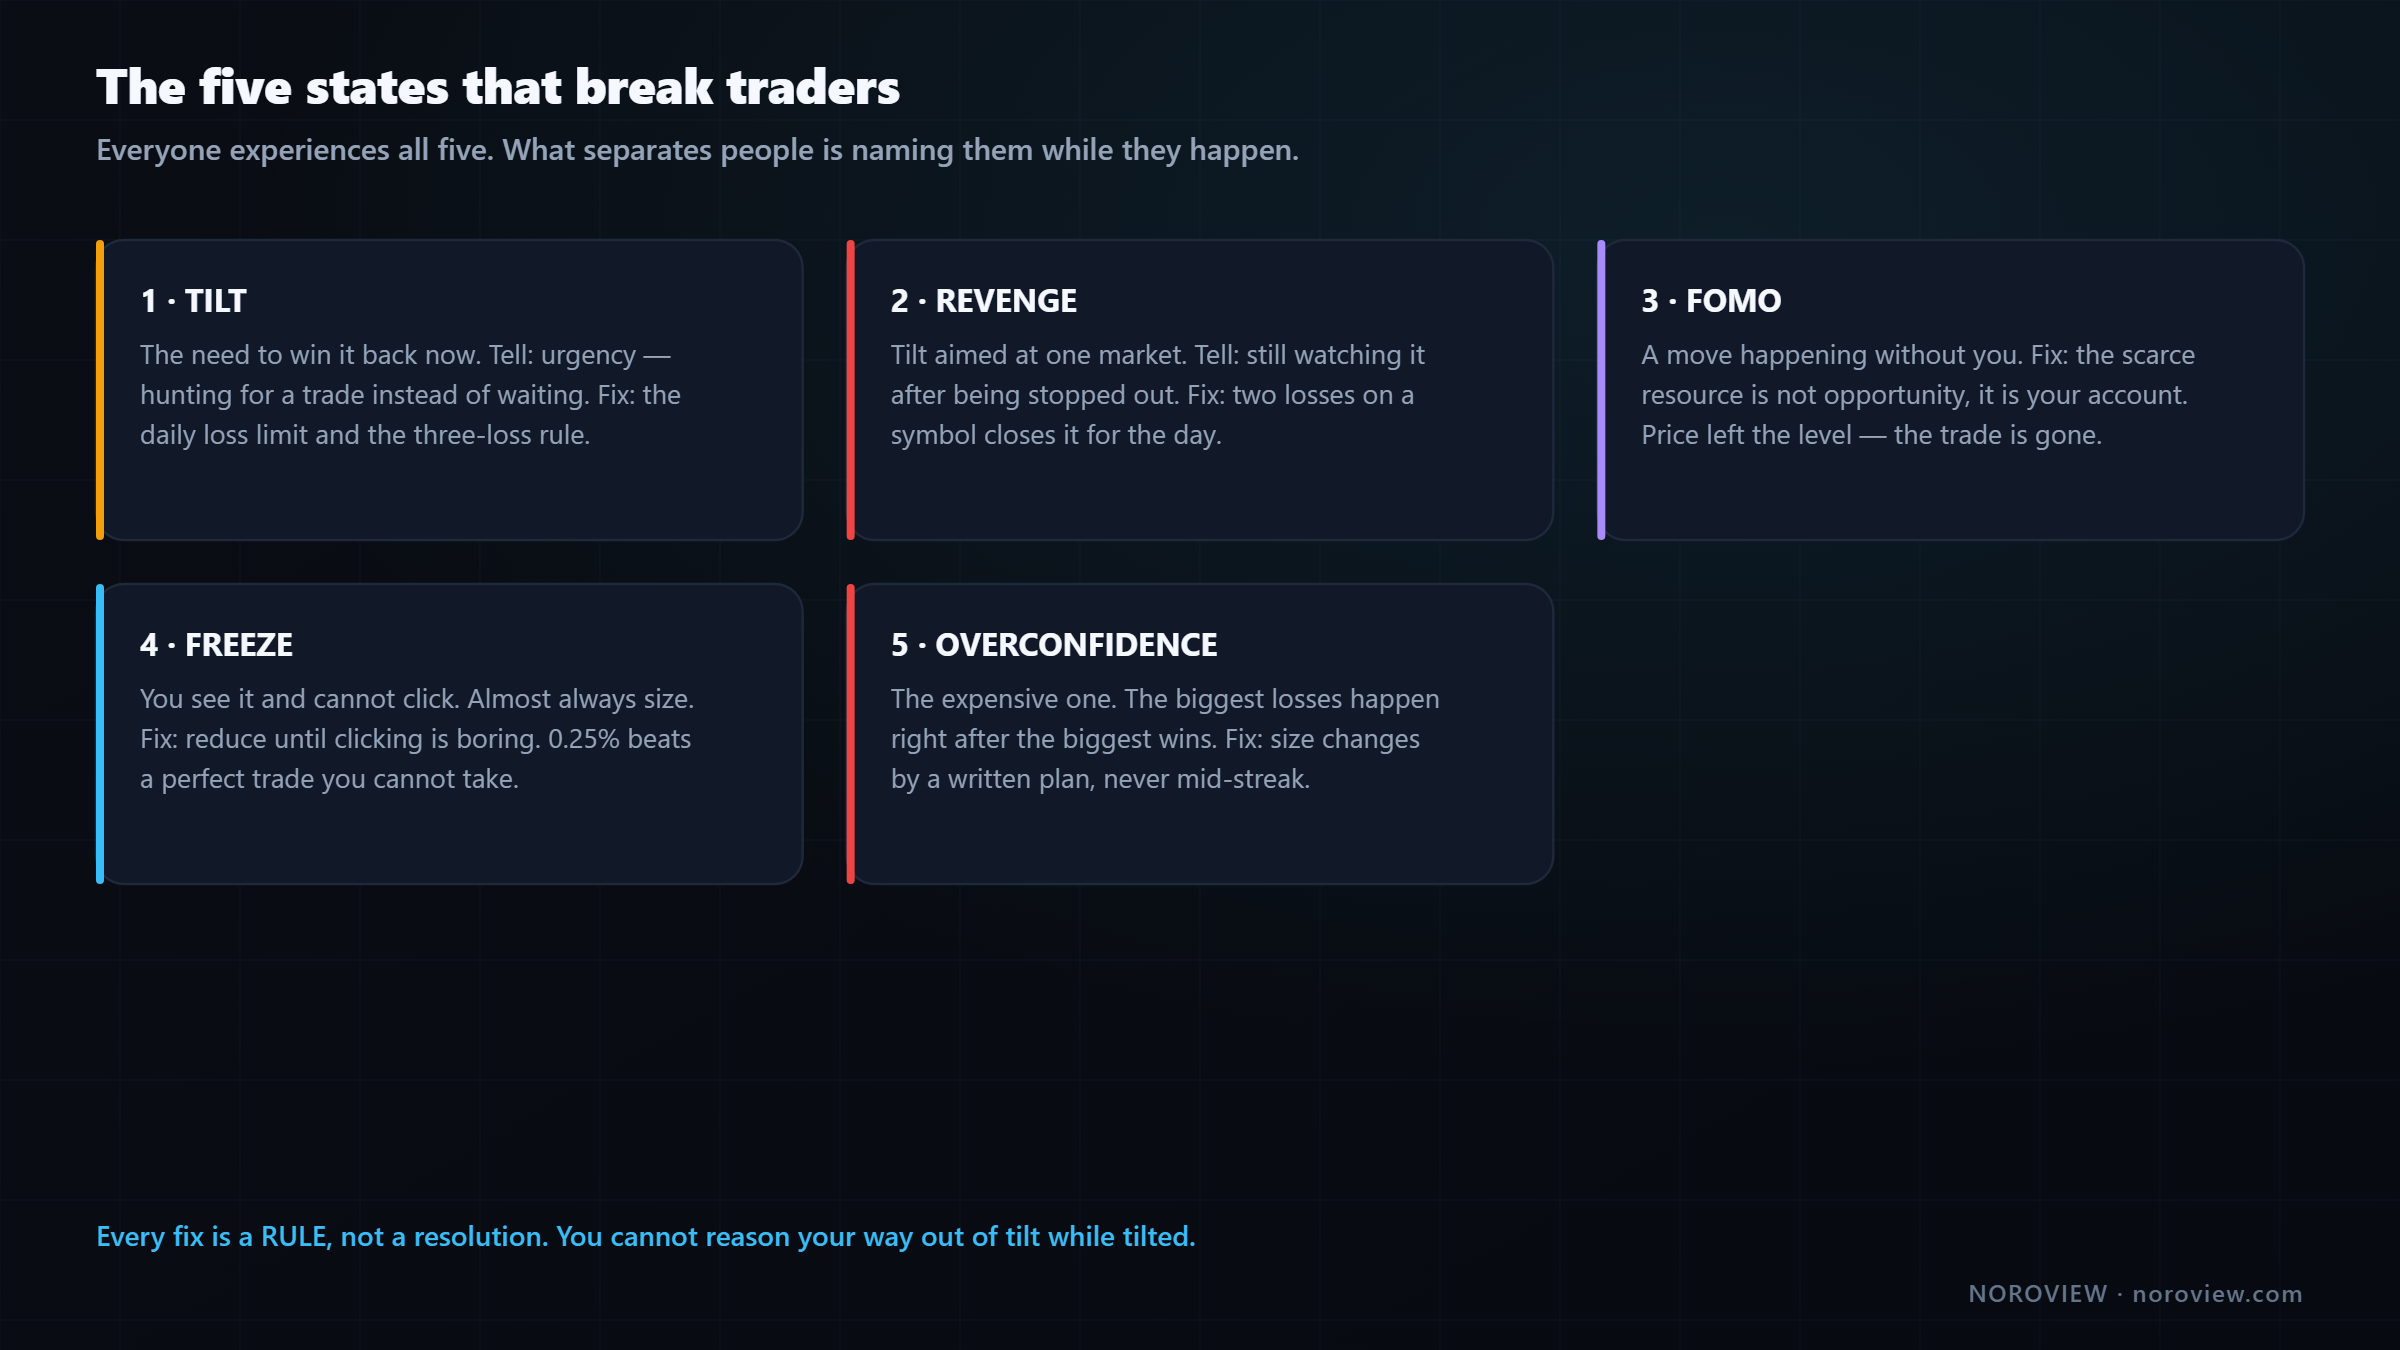
1. Tilt — the need to win it back
You have lost, and now you need to get it back. Right now, today, from the same market that just took it.
The tell is a change in urgency. You start looking for a trade instead of waiting for one, and you lower your standards without noticing — because the standards are now in the way of the thing you need.
The fix is mechanical, not emotional: the daily loss limit and the three-loss rule. You cannot reason your way out of tilt while tilted — that is what tilt is. You need a rule that operates without your consent.
2. Revenge — trading against the market that hurt you
Tilt aimed at a specific market. It took your money and now you want it back from that particular coin, that particular level.
The tell: you are still watching a market after you have been stopped out of it, waiting for it to be wrong.
The fix: after two losses on one symbol in a day, that symbol is closed for the day.
3. FOMO — the fear that this is the one
A move is happening without you and you feel it physically.
There is another trade tomorrow. And the day after. Forever.
There is an unlimited supply of setups and a very limited supply of capital. The scarce resource is not opportunity — it is your account. Once you genuinely believe that, FOMO loses most of its power.
The mechanical fix is lesson 11's rule: price has left the level, the trade is gone. Not "gone for now." Gone.
4. Freeze — you see it and you cannot click
Your setup appears, everything qualifies, and you cannot press the button. Then it runs without you and you feel terrible.
Freeze is almost always size. If a position is big enough to scare you, you will hesitate — and hesitation at the entry is your body correctly telling you the risk is too large.
The fix is to reduce size until clicking is boring. If 0.5% is still scary, go to 0.25%. A trade you can actually take at a small size beats a perfect trade you cannot take at all. (Freeze can also be the aftermath of a big loss. That is a recovery problem, not a discipline problem, and the answer is smaller size and time — not willpower.)
5. Overconfidence — the most expensive one
You have had a great week. Five winners, everything working, and you think: my edge is clearly real, so I should be sizing up.
The biggest losses in trading happen right after the biggest wins.
Almost every catastrophic loss I have seen, including my own worst ones, came directly after a run of wins. Not after losses — after wins, because that is the only time you feel entitled to take a bigger risk.
The fix is a rule made in advance: your size changes according to a plan, not according to how you feel. If you increase size after a good period, decide the increment now, in writing, and make it small. And never increase it in the middle of a hot streak.
Why these five exist at all
None of this is a personal weakness. It is well-documented behavioural economics. Kahneman and Tversky's prospect theory showed that losses are felt roughly twice as intensely as equivalent gains, which is why tilt and revenge feel urgent rather than optional. Odean's work on the disposition effect documented that investors systematically hold losers too long and sell winners too early — the exact pattern this course's rules are designed to override.
Knowing the name of the bias does not remove it. That is why every fix above is a rule, not a resolution.
The physical side
Short, practical, and not filler.
Your trading is a function of your body. It just is.
Do not trade when you are exhausted. Sleep-deprived decision-making is measurably worse, and the specific faculty that degrades first is impulse control — precisely the faculty this entire article depends on.
Do not trade when something big is happening in your life. A fight, a health scare, a crisis. Not because you are fragile, but because your risk tolerance moves without telling you, in both directions.
Trade at the same times. Consistency of schedule builds the pattern recognition that screen time is supposed to produce. Random hours produce random samples.
Measuring it honestly
You cannot manage what you do not measure, and self-reported memory is worthless — you will remember the wins.
NOROVIEW's paper-trading performance hub gives you the metrics that actually matter:
- Overview: ROI, win rate, profit factor, expectancy, trade count, max drawdown, streaks, average and largest win/loss, total fees, plus an equity curve and a calendar heatmap.
- Performance: Sharpe, Sortino and Calmar ratios, drawdown chart, average R-multiple, and average MFE / MAE — how far a trade ran in your favour and against you before it closed. MAE in particular tells you whether your stops are too tight or your entries too early.
- Benchmark: a comparison against simply buying and holding Bitcoin. This is the honest question nobody asks themselves: is my trading adding value over doing nothing?
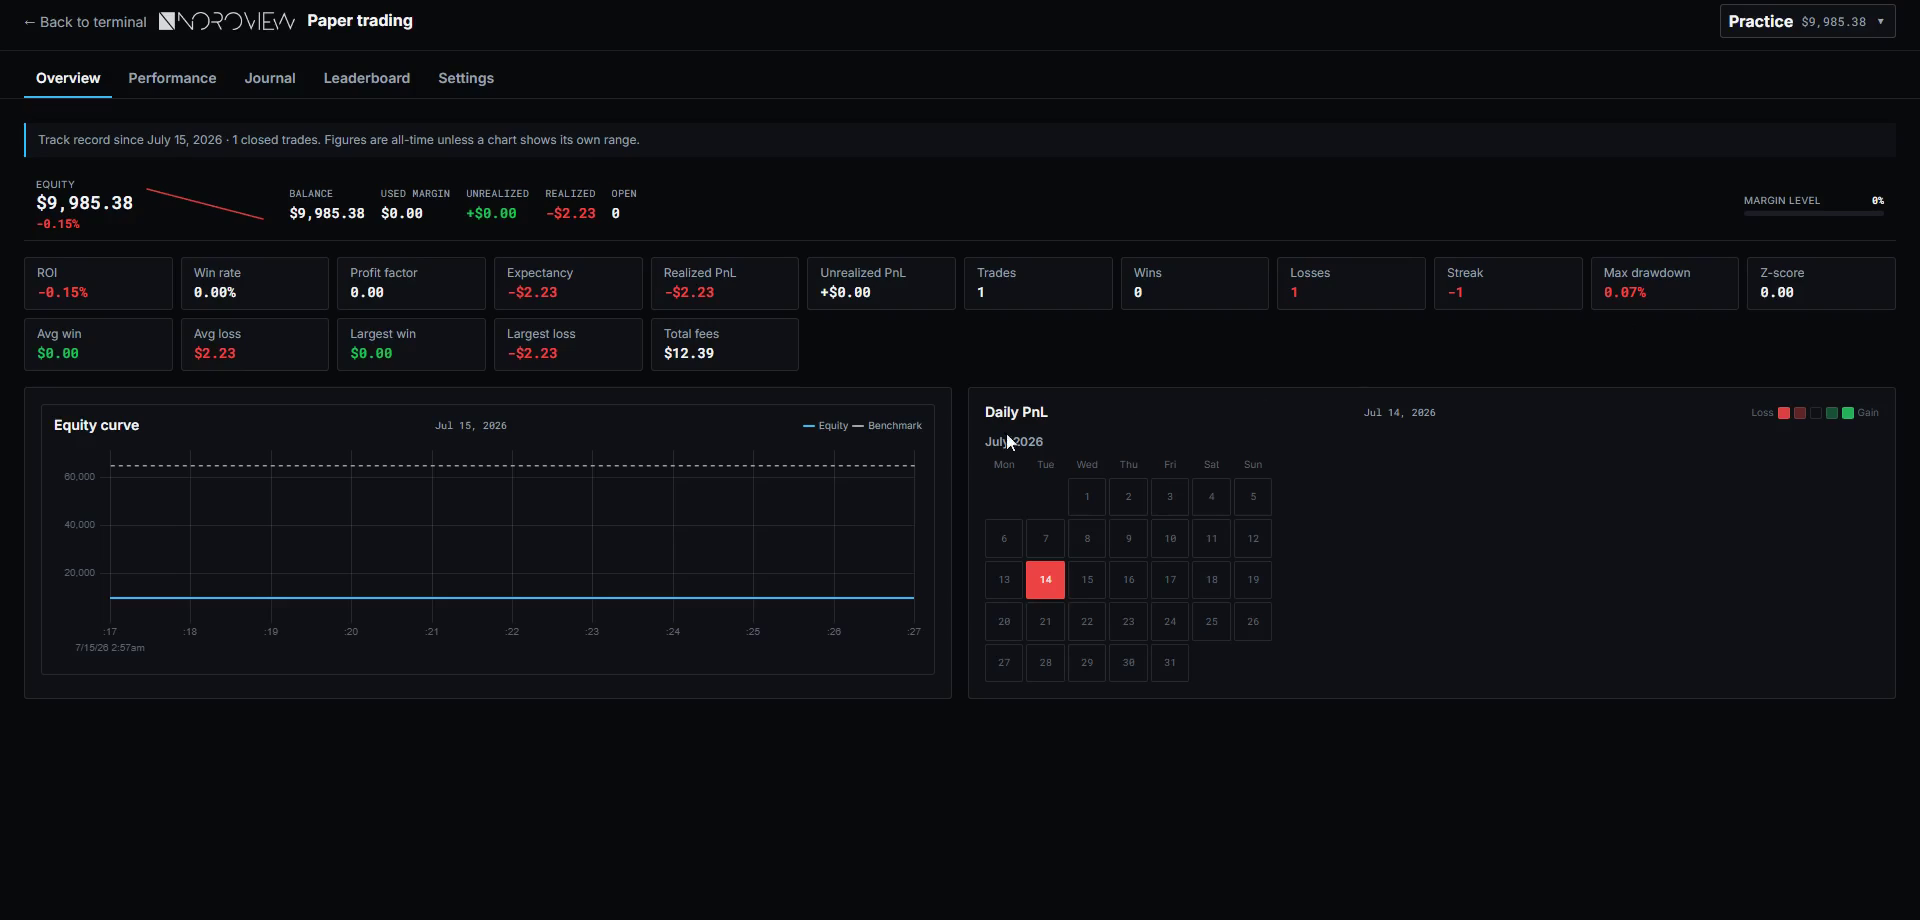
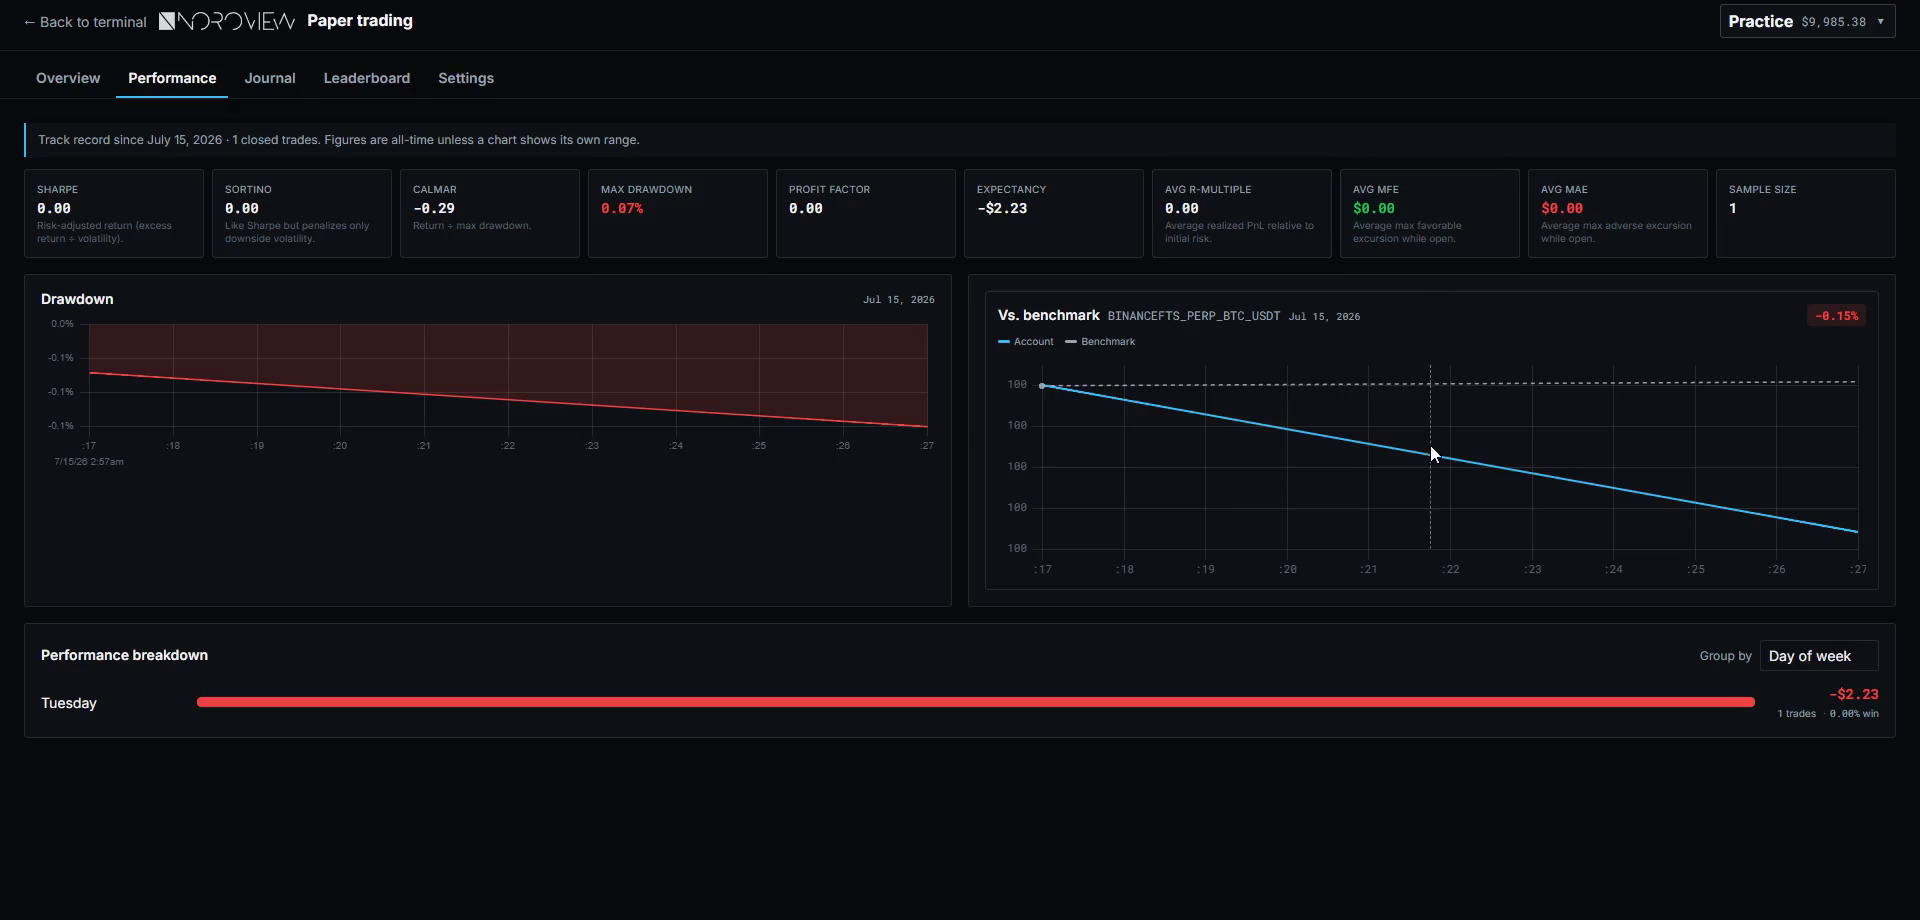
And the reason the track record means something: trades fill only on the live market in real time, every timestamp is server-stamped, the account's economics are fixed at creation, and closed trades can never be edited or deleted. There is no deposit button and no withdraw button — which is exactly the point. You cannot top up a losing account to hide a blow-up, and you cannot back-date a winning history.
The journal
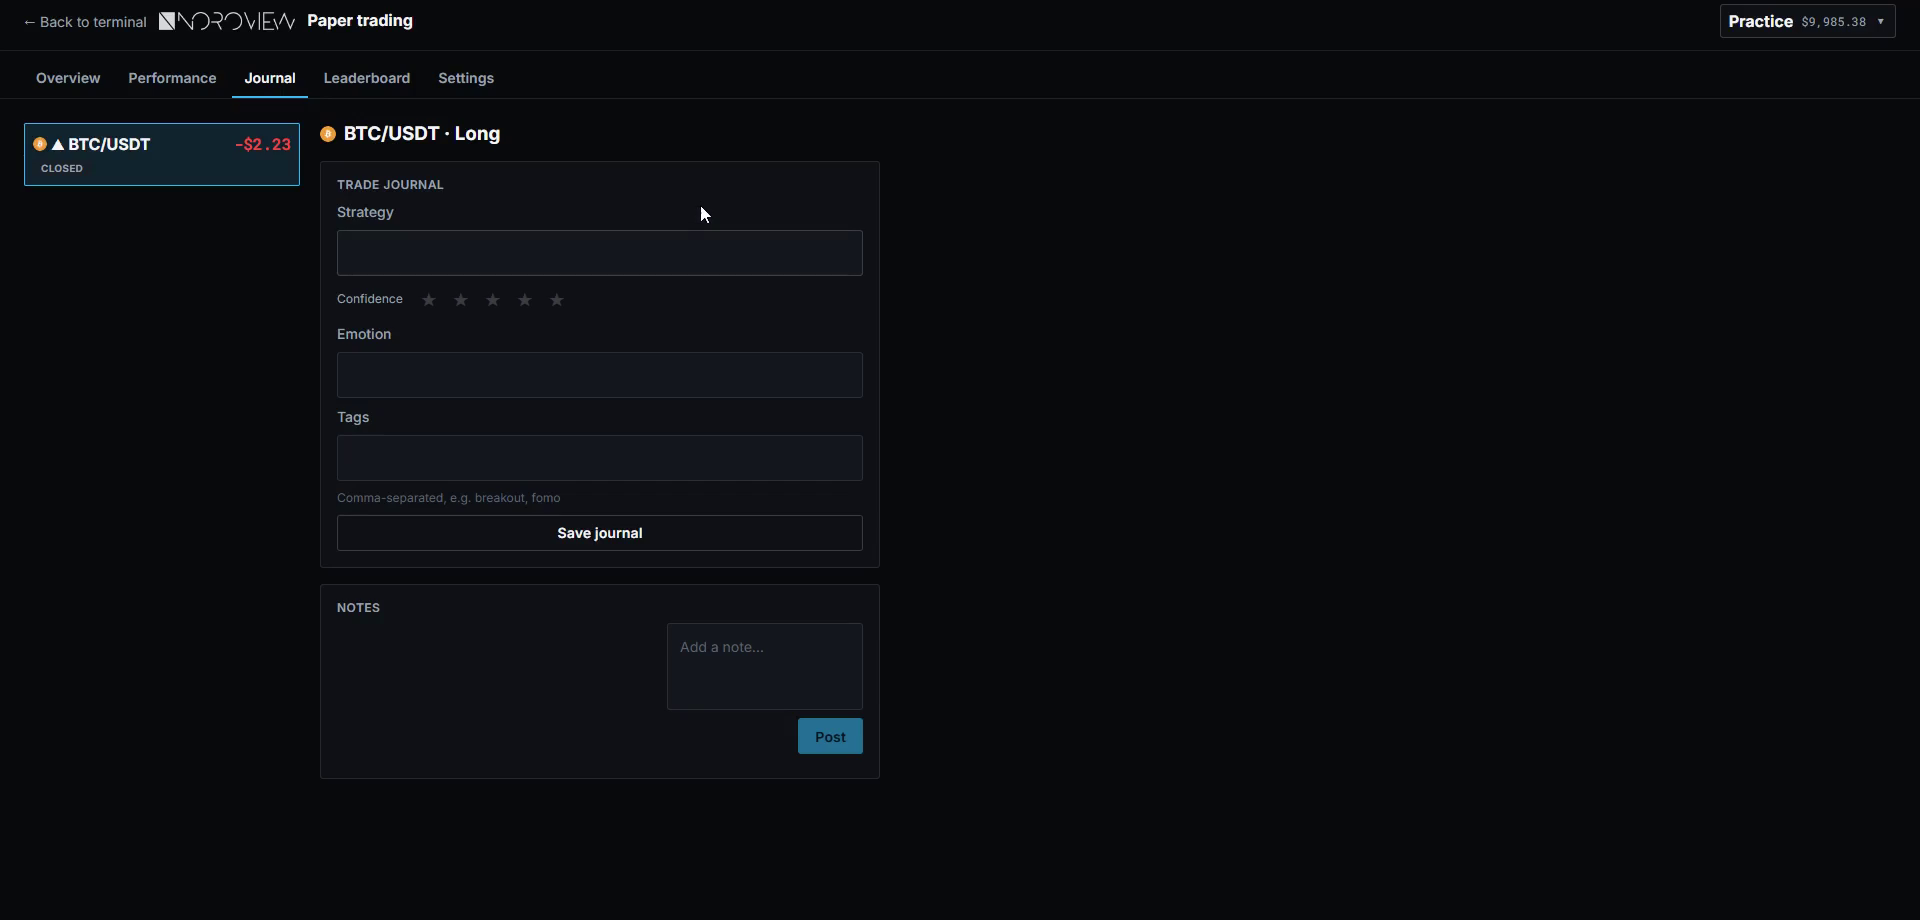
Numbers tell you what. A journal tells you why. Log the strategy, your confidence, your emotional state and tags for each trade. Then, once a week, sort your losses by cause rather than by size.
Almost everyone discovers the same thing: a small number of rule violations account for most of the damage. That is an enormously encouraging finding, because it means the fix is a checklist rather than a personality transplant.
Common mistakes
- Picking a size and then finding a stop to fit it.
- Risking more after a winning streak because the edge "feels real."
- Treating two correlated positions as two positions.
- Trying to win back a losing day on the same day.
- Grading trades by profit and loss instead of by process.
- Changing the method after a normal losing streak.
- Using money that has a job, or borrowed money in any form.
- Never withdrawing anything, so the money stays abstract.
Your homework
About an hour, and then it becomes a weekly habit.
- Write your limits on paper — per trade, per day, per week, max open risk, max positions, plus the three-loss rule. Put it where you can see it.
- Go back to lesson 1's three questions (why do I want to trade, how much could I genuinely lose, what is my deadline and where did it come from) and read your answers. This is the uncomfortable part, and it is the point.
- Open a paper account with a realistic starting balance, and take ten trades at 0.5% risk using the risk calculator. Grade each one by process, not by outcome, before you look at the P&L.
Three things to remember
- Survival is the objective. Size is an output of your stop and your fixed risk percentage — never an input.
- Eight losses in a row is normal. At 1% risk that is a bad fortnight; at 10% it is the end of the account. Same eight trades.
- Grade the decision, not the outcome — and understand that the most dangerous trade you will ever take is a rule-breaking one that wins.
← Previous: Fair Value Gaps With Order Flow · Course index: Order Flow Trading Course · Next → How to Day Trade Crypto With Order Flow
Frequently asked questions
How much should I risk per trade? One percent of account equity per trade is a standard professional figure, and half a percent while you are still learning and your edge is unproven. The number matters less than its consistency — fixed fractional risk is what makes a losing streak countable and survivable rather than random damage.
What is the 1% rule in day trading? The 1% rule means no single trade may lose more than 1% of your account. Position size is calculated by dividing that dollar amount by your stop distance, so wide-stop trades get small positions and tight-stop trades get large ones, and every loss costs the same.
How many losses in a row is normal? At around a 50% win rate, five consecutive losses is almost certain over a hundred trades, six is likely and eight happens. Losing streaks are a property of randomness, not evidence that a method has stopped working — which is why position size, not streak avoidance, is the defence.
How much do you need to gain to recover a drawdown? Recovery is asymmetric: −10% needs +11%, −30% needs +43%, −50% needs +100% and −90% needs +900%. At a strong 10% monthly return, recovering a 50% drawdown takes roughly seven months of trading well while sitting in a hole.
How do you stop revenge trading? With a mechanical rule rather than willpower, because you cannot reason your way out of tilt while tilted. A daily loss limit, a hard stop after three losses in a day, and closing a symbol for the day after two losses on it are all rules that operate without your consent.
What is tilt in trading? Tilt is the state of needing to win money back immediately from the market that just took it. The tell is a change in urgency — you start hunting for a trade rather than waiting for one, and your standards quietly drop because they are now obstructing what you need.
Why do I lose money after a winning streak? Because a run of wins is the only time you feel entitled to take more risk. Almost every catastrophic loss follows a strong period rather than a weak one. The defence is a written plan for when and by how much size increases — never a mid-streak decision.
What should a trading journal record? The strategy used, your confidence level, your emotional state, tags for setup type, and whether you followed your process. Sorted weekly by cause rather than by size, most traders find that a small number of repeated rule violations account for most of their losses.
Sources
- Chague, F., De-Losso, R. & Giovannetti, B. (2020). Day Trading for a Living? — SSRN
- Kahneman, D. & Tversky, A. (1979). Prospect Theory: An Analysis of Decision under Risk — Econometrica
- Odean, T. (1998). Are Investors Reluctant to Realize Their Losses? — Journal of Finance
- Investopedia — Sharpe ratio
Soroosh Moghimi — six years inside financial markets: algorithmic trading, HFT, crypto and AI, after a decade building startups. He publishes this course free because he already paid for the lessons in it. There is no paid course and no signal group. @sorooshmoghimi · About
Start reading real order flow
You cannot learn this from a candlestick chart, and you do not need to spend a cent to begin. The standard footprint chart is free for every NOROVIEW user, market replay is free, and the paper-trading simulator is free.
Open NOROVIEW free → · Compare plans →
⚠️ DISCLAIMER — EDUCATIONAL CONTENT ONLY
This article is for educational and informational purposes only. It is not financial, investment, or trading advice, and nothing in it is a recommendation to buy, sell, or hold any asset. Trading cryptocurrencies and leveraged derivatives is high risk and can result in the loss of some or all of your capital. Only risk money you can afford to lose. Any levels, indicators, signals or results shown are illustrative and are not a promise or prediction of future performance. Charts may be shown on a demo or paper-trading account and do not represent real trades or returns. Always do your own research. You alone are responsible for your decisions.
Keep reading
Related posts

16. Trade Management: Break-Even, Partials and Trailing Stops
Trade management explained: when break-even stops cost you money, partial exits, four kinds of trailing stop, the order-flow exit, and diagnosing yourself with MFE and MAE.

15. How to Day Trade Crypto With Order Flow (Starting Small)
How to day trade crypto with order flow: exchange security, spot vs perpetuals, leverage and liquidation, order types, fees, and an honest $100 starting plan.

13. Fair Value Gaps, Confirmed With Order Flow
Most fair value gaps do nothing. Five order-flow checks that tell you in advance which FVGs are worth trading and which are decoration.

5. Market Structure and Trend: How to Pick Your Side Objectively
How to identify market structure objectively: higher highs and higher lows, swing point rules, impulse vs correction, and the arithmetic behind trading with the trend.

11. My Order Flow Entry Model, Step by Step
A complete order flow entry model: the four conditions, the exact trigger candle, the value-area filter, and the ten-item blocker list that vetoes a trade.

9. The Only Support and Resistance Levels I Actually Trade
Order flow support and resistance: how to find levels built from participants rather than price — high-ATS levels, automatic S&R and untested POCs.
Discussion (0)
Want to join the discussion? Comments live inside the platform.
Open NOROVIEW