
11. My Order Flow Entry Model, Step by Step
A complete order flow entry model: the four conditions, the exact trigger candle, the value-area filter, and the ten-item blocker list that vetoes a trade.
11. My Order Flow Entry Model, Step by Step
Two sentences before the model, and they matter more than anything else here.
One: this is my entry model. It is not the entry model. There is no single correct entry, and anyone who tells you there is has never traded through a regime change. This is a worked example of what a complete model looks like — every condition specified, nothing left to feeling.
Two: the part that will make you the most money is not the entry conditions. It is the blockers — the list of things that cancel a trade even when everything else looks perfect. Most people have half an entry model. Almost nobody has a veto list.
Open a footprint chart and follow the trigger-candle section on live price.
What you'll learn in this lesson
- The four conditions that build a trade, in order
- The difference between evidence and a trigger — and why entering on evidence is why you keep getting stopped out
- The exact form of the trigger candle, criterion by criterion
- Why negative delta with a strong close is a better long signal than positive delta
- The single rule that saves the most money: do not buy at the high
- Why the same volume means different things inside and outside the value area
- The complete ten-item blocker list
Lesson 11 of 16 · Part 2 — Technique. Part of the free order flow trading course. Previous: Absorption, Exhaustion, Icebergs and Imbalance. Next: Cumulative Volume Delta (CVD).
▶ Prefer to watch it?
Turning your setup into a scanner: Smart Support/Resistance & Scan for Any Setup (Ep 17) · The three reads I take entries from: Footprint Charts Changed How I See the Market · Drilling the trigger without risking money: Bar Replay & Backtesting for Order Flow (Ep 3)
The model on one card
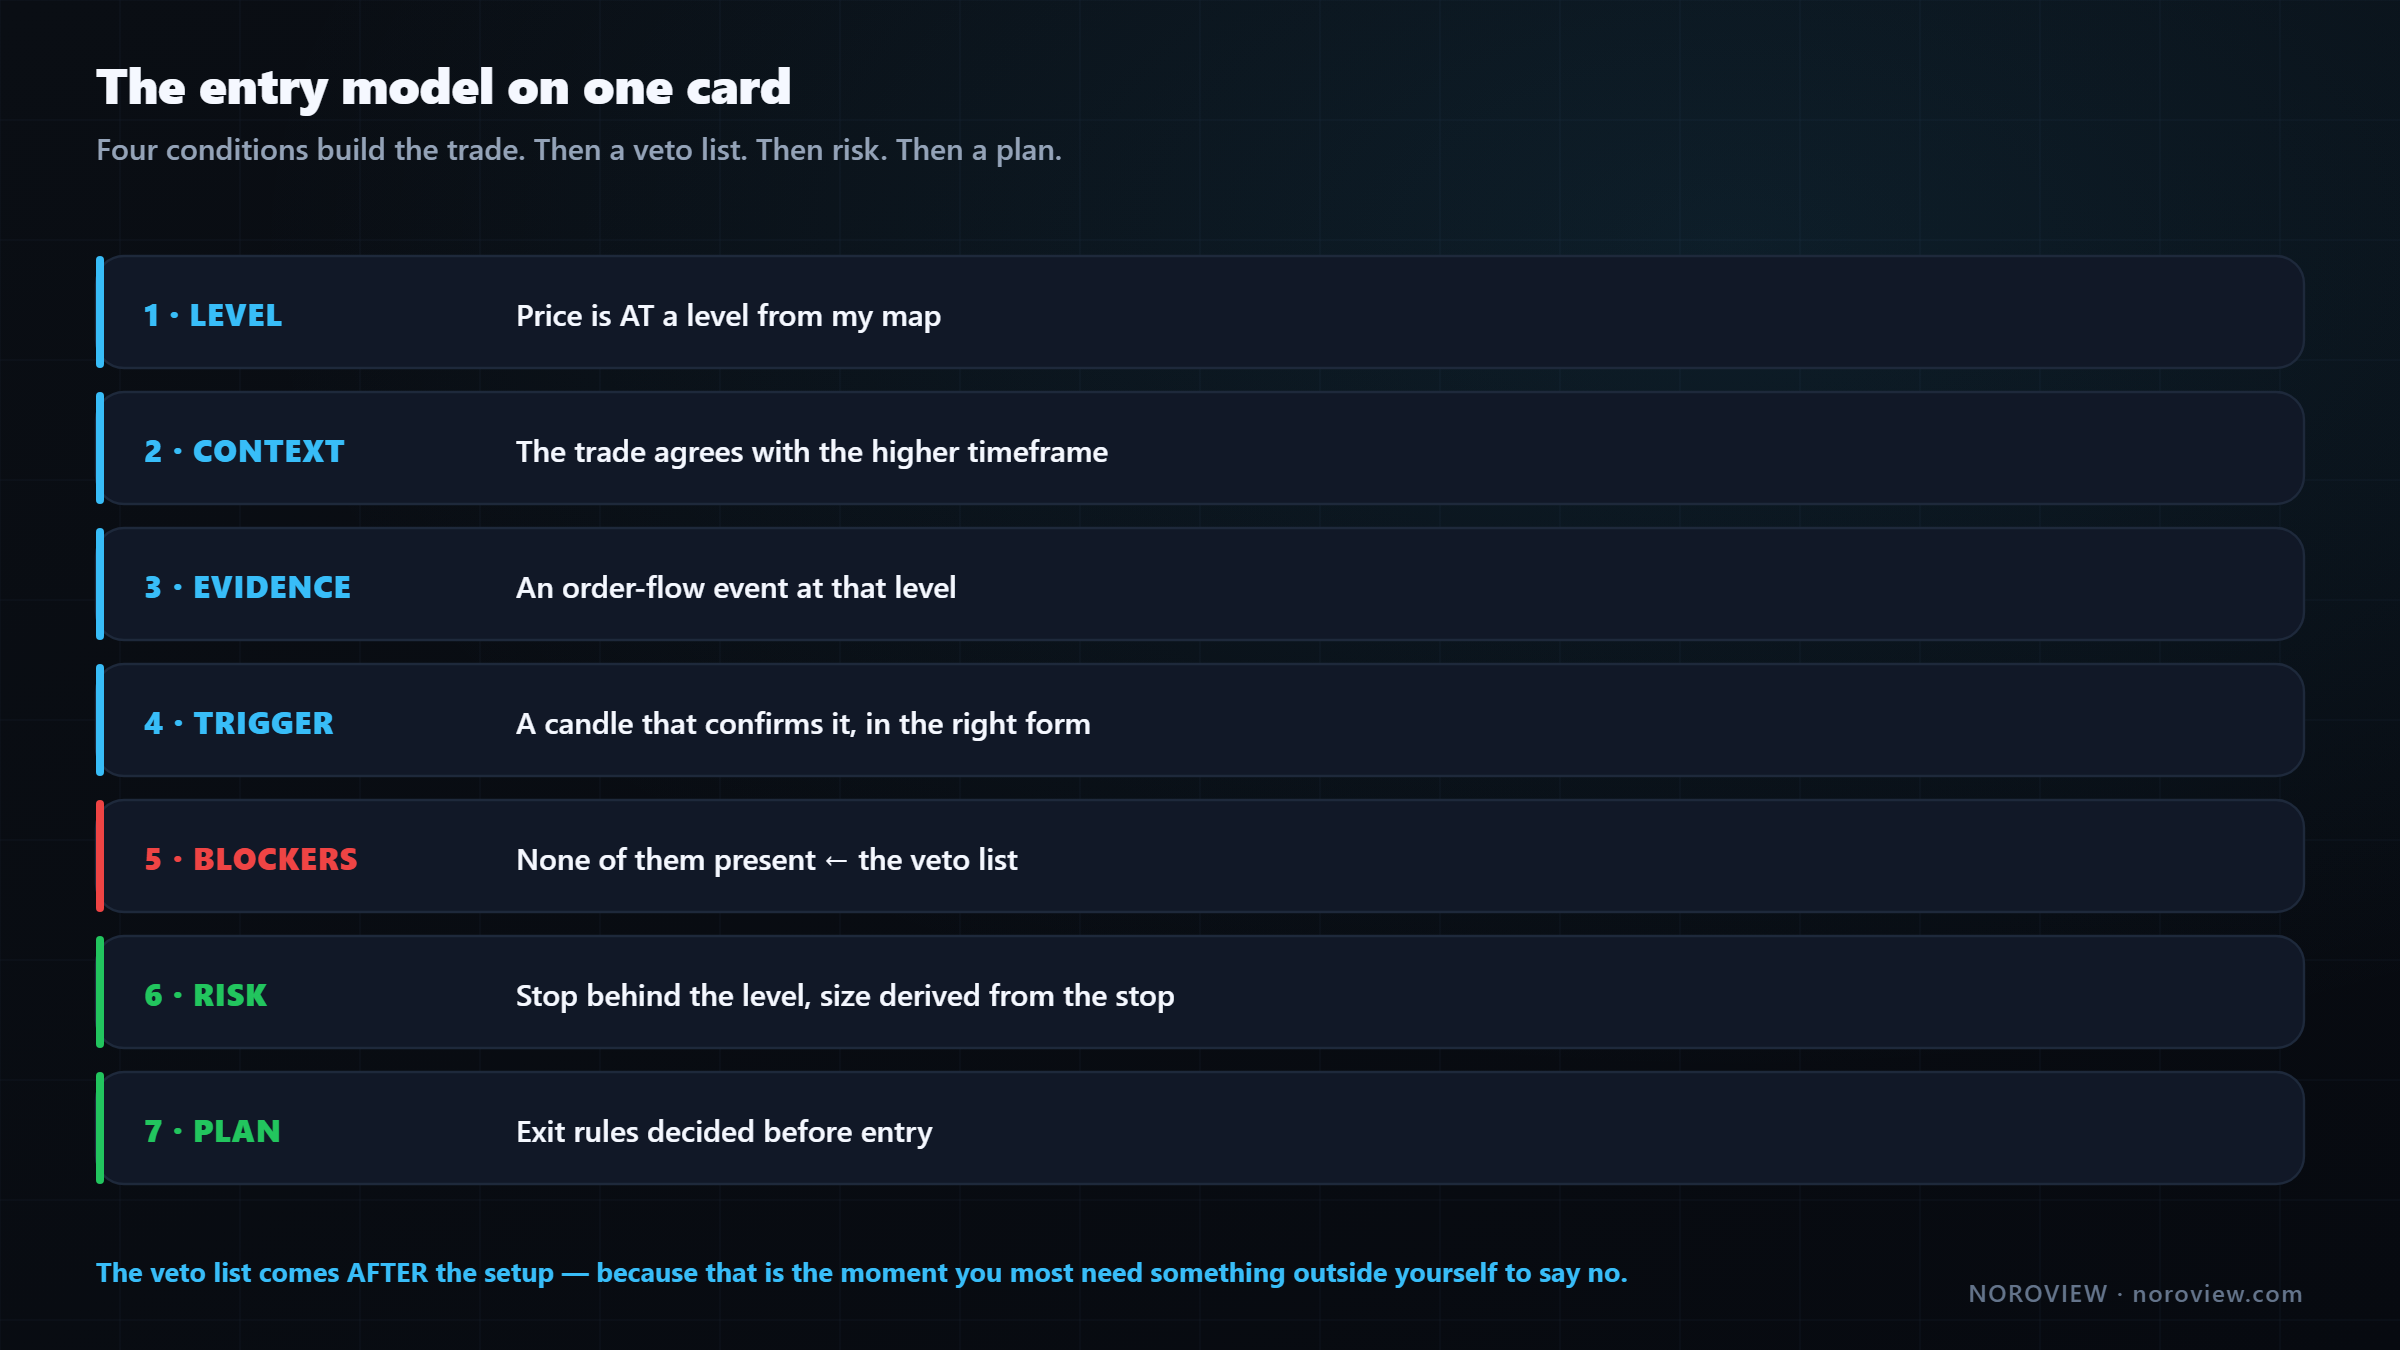
THE ENTRY

  1 · LEVEL       price is AT a level from my map            (Lesson 9)
  2 · CONTEXT     the trade agrees with the higher timeframe (Lesson 5)
  3 · EVIDENCE    an order-flow event at that level          (Lesson 10)
  4 · TRIGGER     a candle that confirms it, in the right form

  THEN:
  5 · BLOCKERS    none of them present                       ← the veto list
  6 · RISK        stop behind the level, size from the stop  (Lesson 14)
  7 · PLAN        exit rules decided before entry            (Lesson 16)
Notice the order, because it is deliberate: the veto list comes after the setup, not before. I do not filter the market for blockers first. I find the setup, get excited, and then run the veto list — because that is the exact moment when I most need something outside myself to say no.
The veto list exists for the moment you don't want to use it.
Conditions 1 and 2: level and context
Condition 1 — price is AT a level from my map. Not near. At. From the map built in lesson 9: a high-ATS level, an automatic order-flow level, or a genuine confluence zone.
No level, no trade. There is no exception to this.
The reason it is first and absolute is structural, not stylistic. Without a level you have no stop. You cannot define where you are wrong, so you cannot size the position, so you cannot control the loss. Everything downstream falls apart.
Condition 2 — the trade agrees with the higher timeframe. From lesson 5: the daily gives the bias you are allowed to have, the hourly gives the trend you are actually trading. Daily up, hourly up, and a long at support is the cleanest version, taken at full size.
If they disagree there are exactly three options: take it smaller, wait, or skip it. What you do not do is decide the higher timeframe does not matter today because this setup looks really good.
"This one's different" is the most expensive sentence in trading.
Condition 3: the evidence
Price is at your level. Now look inside the candles and ask one question: is anybody actually defending this price?
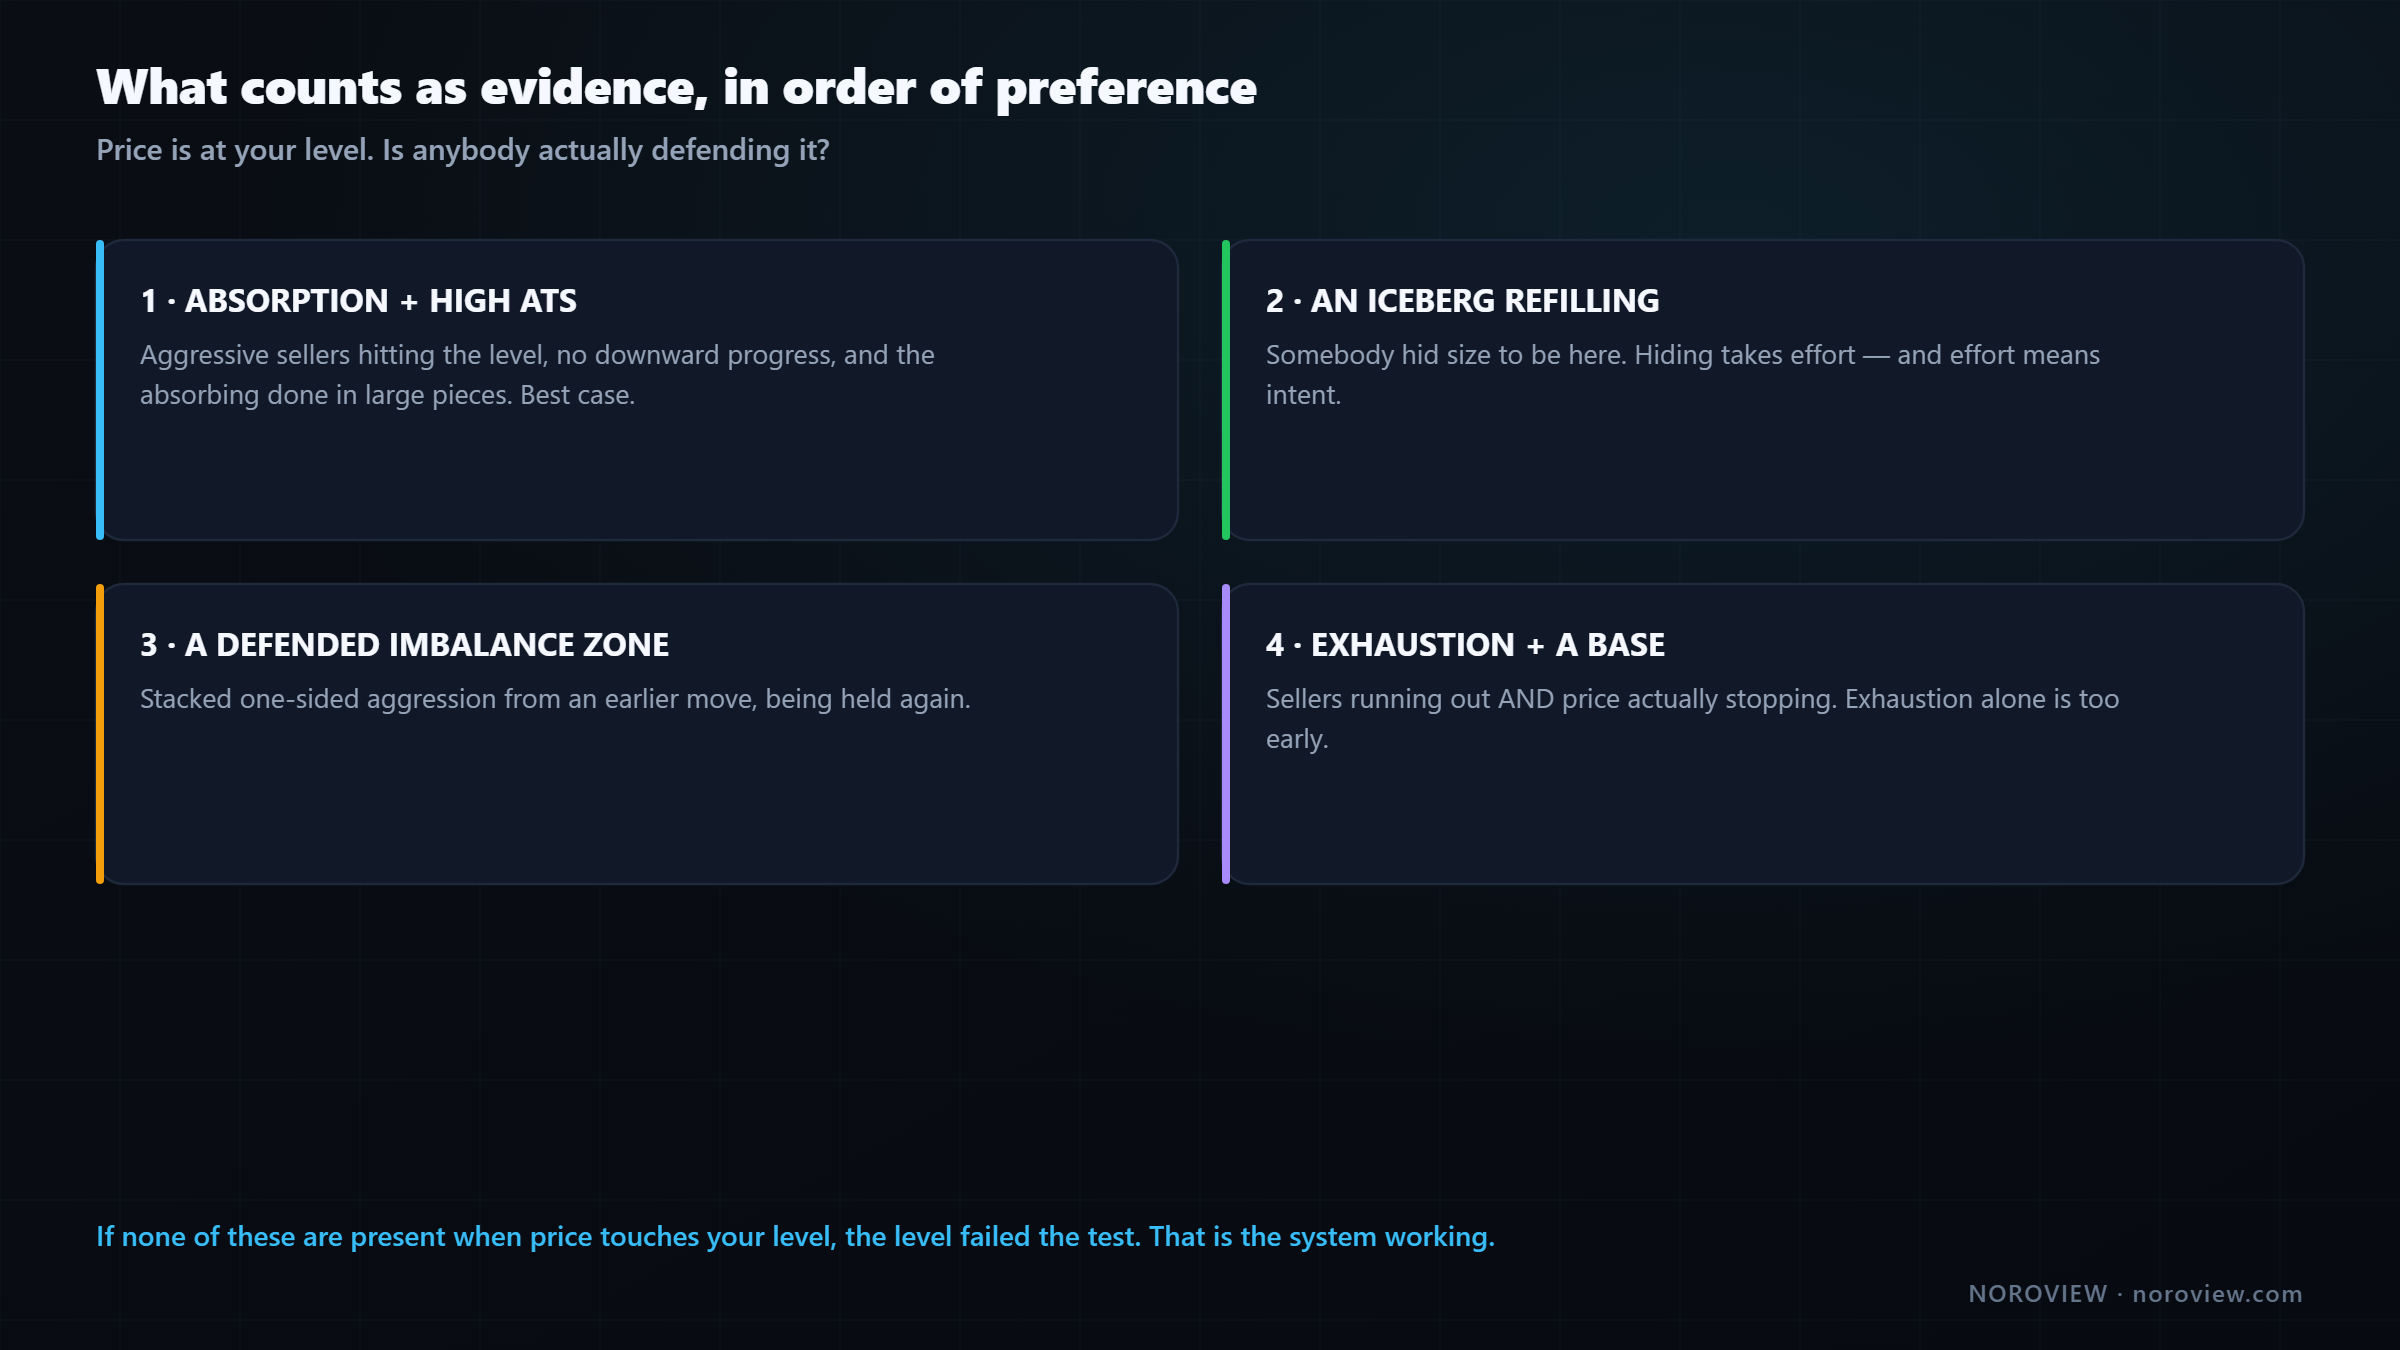
What I want to see, in order of preference:
- Absorption at the level, with elevated ATS. Aggressive sellers hitting the level, no downward progress, and the absorbing happening in large pieces. One big participant, at a price other people are watching. Best case.
- An iceberg refilling at the level. Somebody hid size to be here, and hiding takes effort.
- A stacked imbalance zone being defended.
- Exhaustion, plus a base actually forming. Remember lesson 10 — exhaustion on its own is too early. You need price to actually stop going down and start building, not just sellers getting tired.
And here is the discipline that separates this from gambling. If price arrives at your level and none of those are present — if the level just gets touched and nothing happens in the order flow — you do not trade.
A touched level with no evidence is a level that failed the test.
That is not a missed opportunity. That is the system working. Most levels get touched and produce nothing, and the entire point of having order flow is to know which ones those are before you are in the trade rather than after.
Condition 4: the trigger
This is where most people lose money even with a good read.
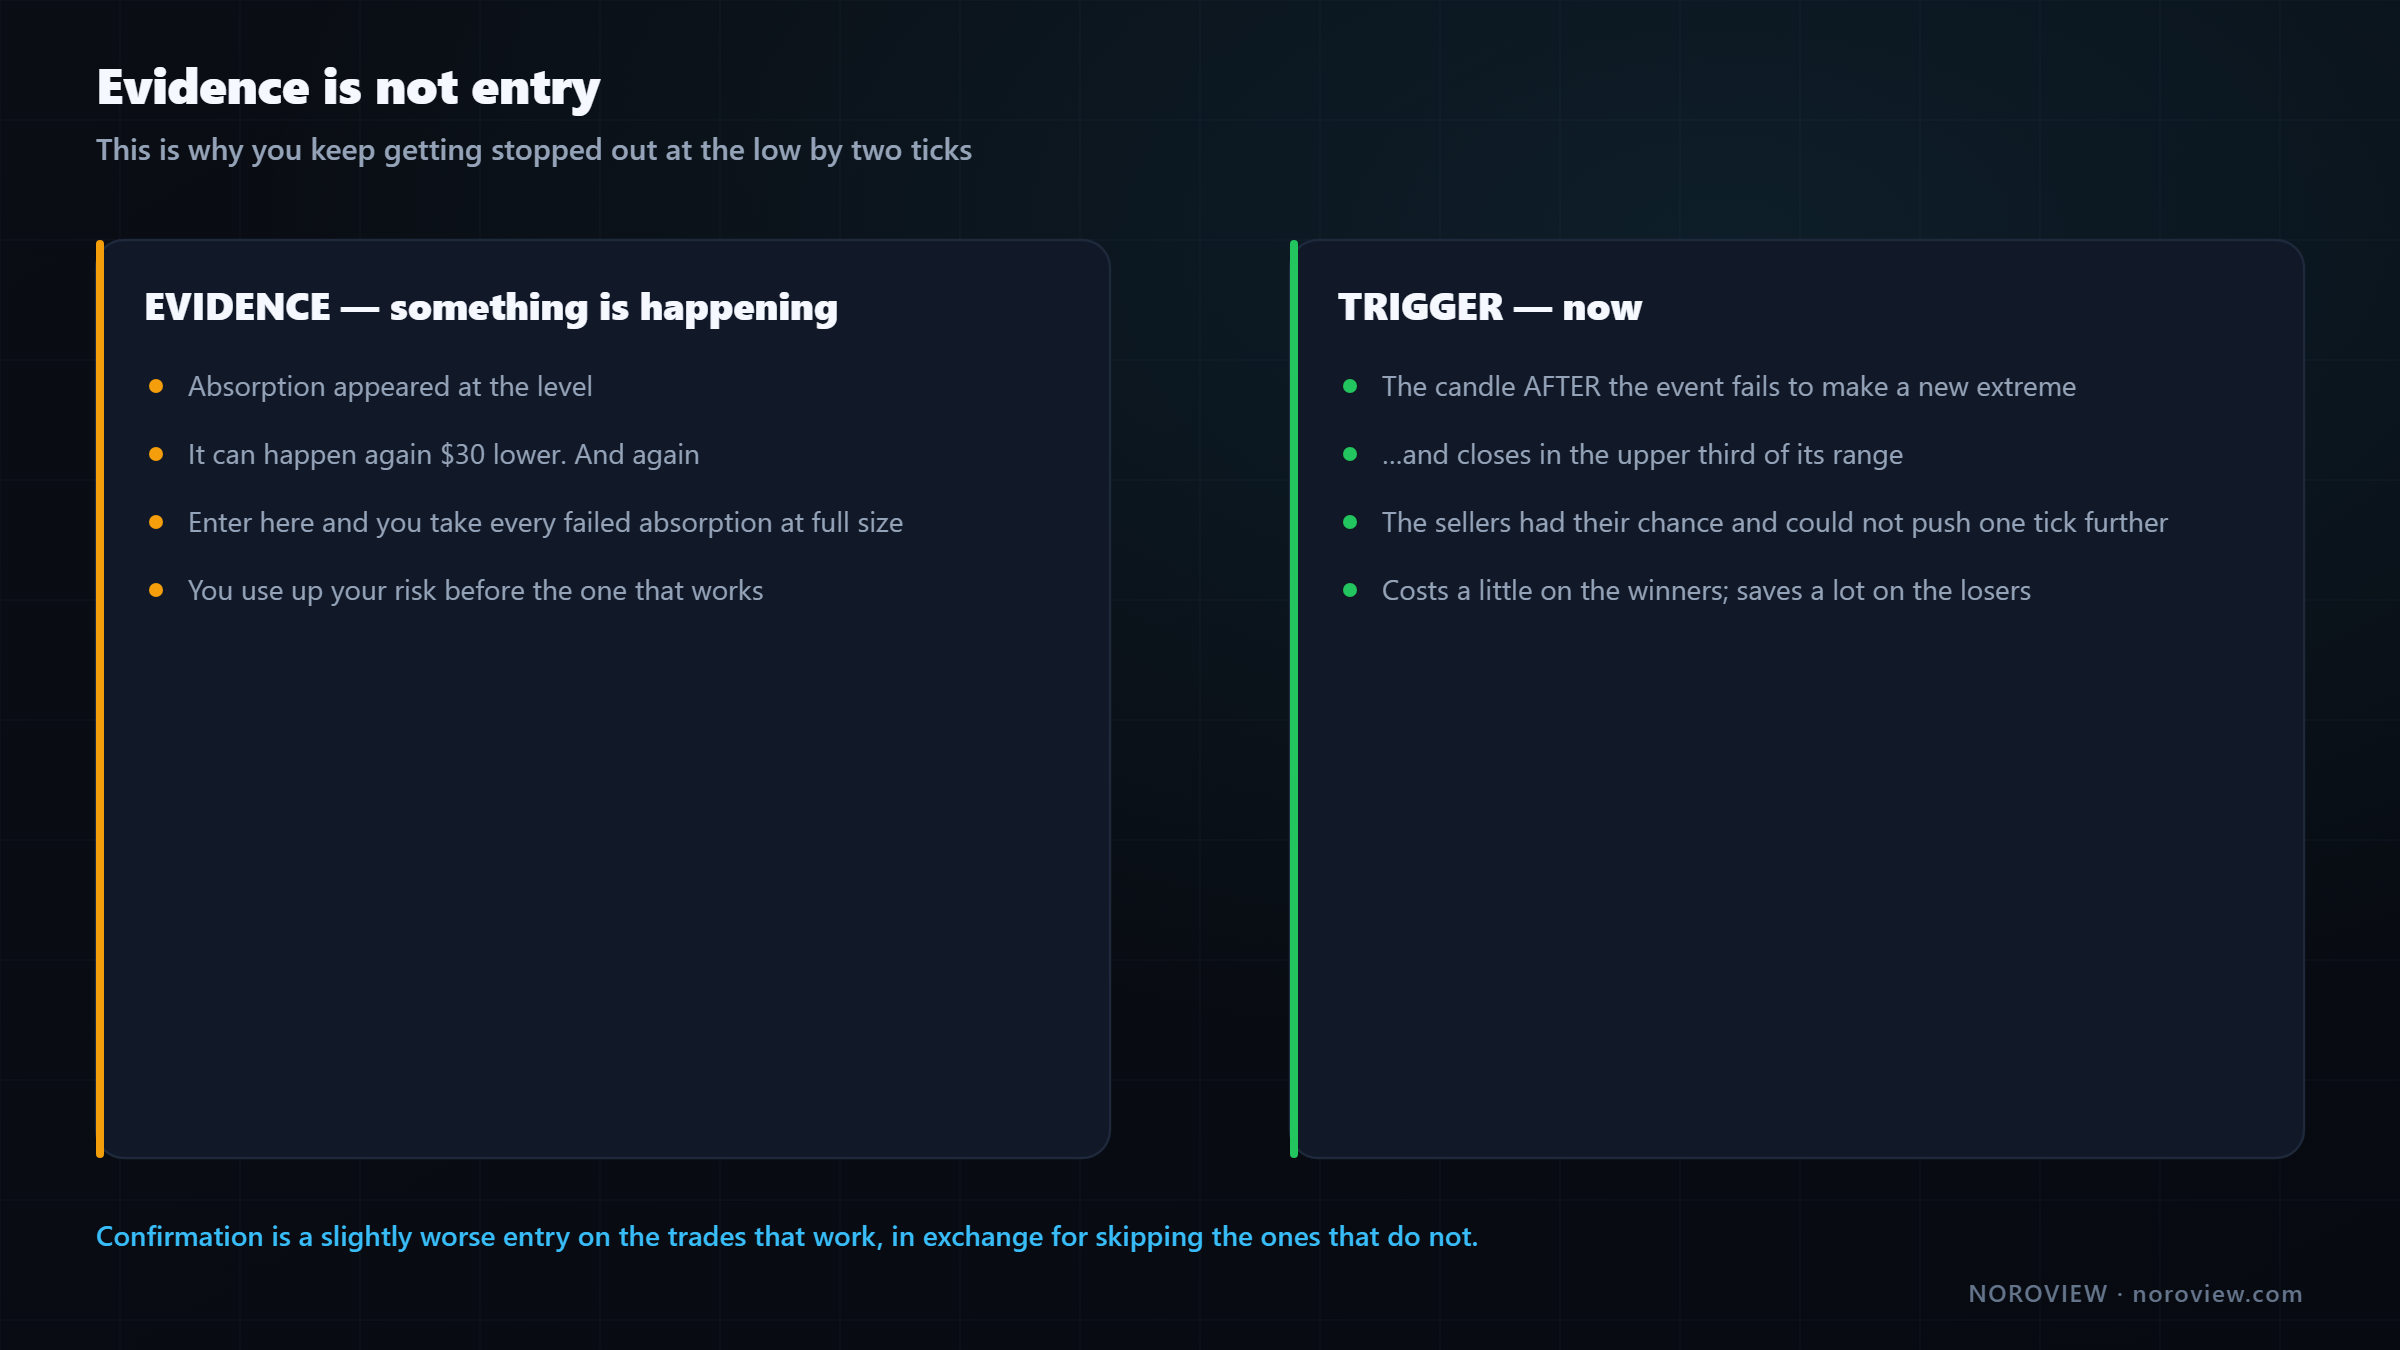
Evidence says something is happening. A trigger says NOW.
You can see absorption and still be too early. Absorption can happen, then price drops another $30 and absorbs again, and again — and each time you enter, you get stopped out. Then the fourth one works and you are not in it, because you have used up your risk.
My trigger is confirmation by the following candle. After the absorption, I want the next candle to fail to make a new low and to close in the upper part of its range.
Trigger: the candle AFTER the event fails to make a new extreme, and closes strong.
Small thing. Does a lot of work. Think about what a failure to make a new low means: the sellers had their chance. They had all the momentum, price was at the low, and they could not push it one tick further. That is the difference between "somebody absorbed some selling" and "the selling has actually stopped."
The honest cost of waiting
Waiting for confirmation means you enter worse than the person who caught the exact low. Your stop is a bit wider or your entry a bit higher, so your reward-to-risk is slightly worse on the trades that work.
Confirmation costs you a little on the winners and saves you a lot on the losers.
I accept that completely, because the alternative — entering into the absorption itself — means taking every single failed absorption at full size. The maths is not close: a slightly worse entry on the winners is much cheaper than a full loss on all the losers.
This is also the honest answer to "why do I keep getting stopped out at the low by two ticks?" You were entering on evidence instead of on a trigger.
▶ Try this now
In Market Replay, find an absorption candle and then step forward exactly one bar with the Next bar button. Ask before you step: will the next candle make a new low? Do that thirty times and you will have trained the single most valuable reflex in this article. Launch NOROVIEW free →
The exact form of the trigger candle
"Closes strong" is not precise enough to execute on. Here is the full specification for a long.
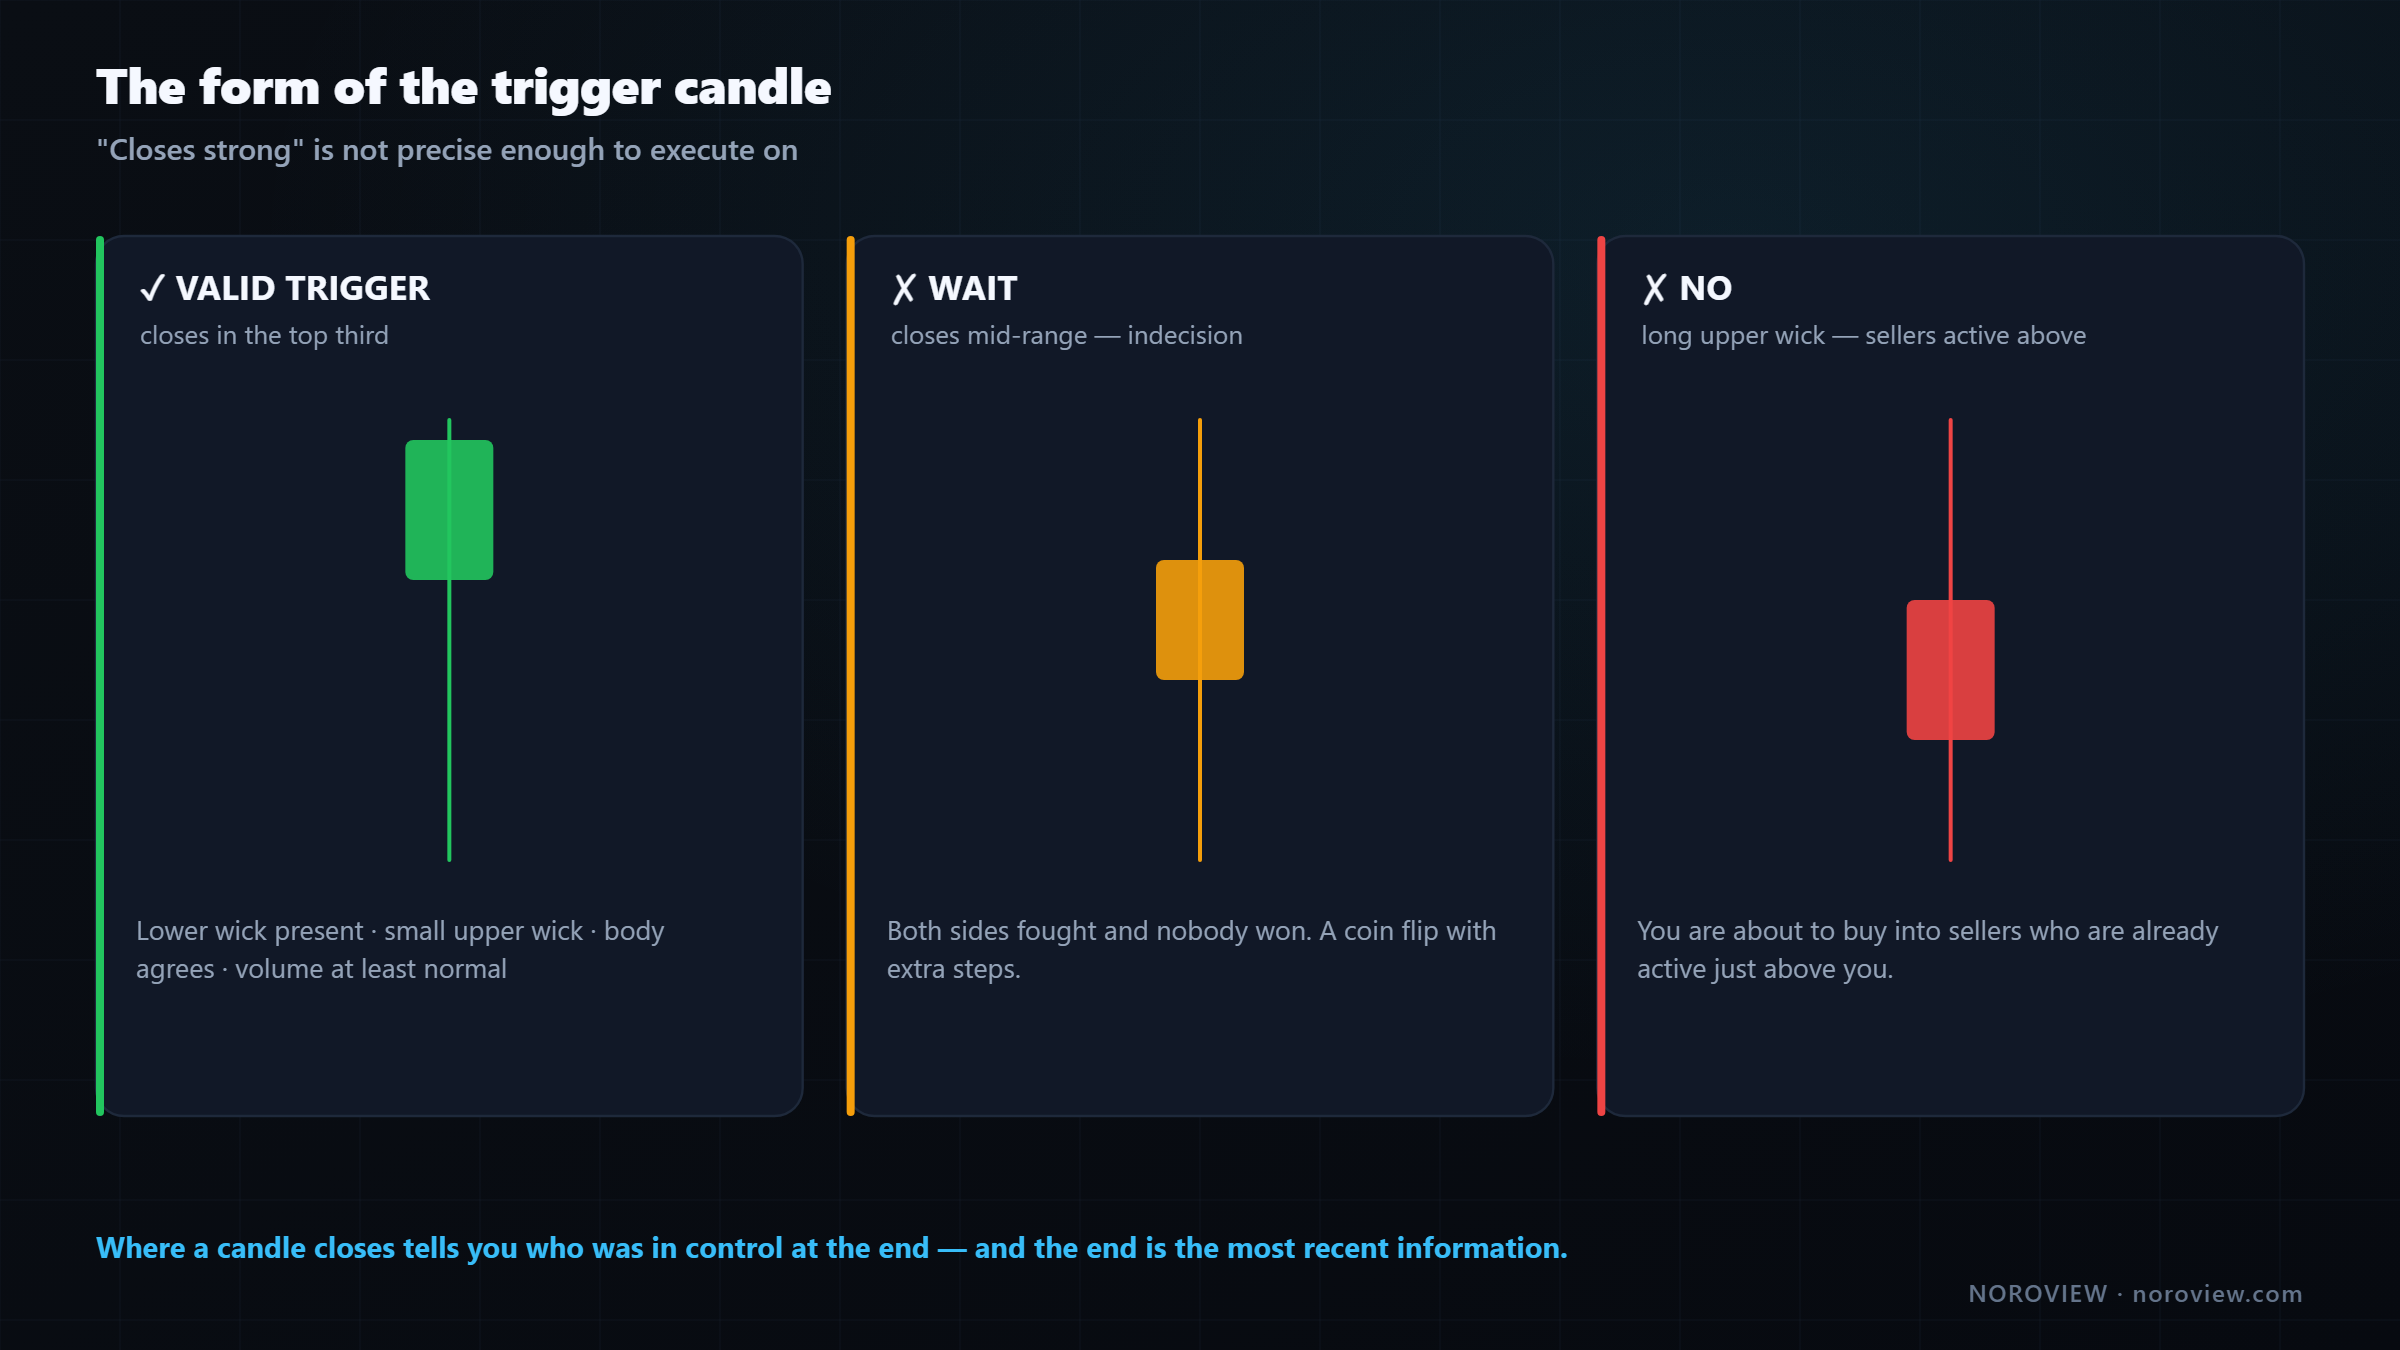
What I want to see
| ✓ | Criterion | Why |
|---|---|---|
| ✓ | Closes in the top third of its range | The single most important one. Where a candle closes tells you who was in control at the end |
| ✓ | Lower wick present | Price went down there and got rejected. The wick shows you where the buyers were |
| ✓ | Upper wick small | A big upper wick means sellers were active above even as it closed strong. Somebody is waiting up there |
| ✓ | Body direction agrees | Green for a long. Obvious — but people talk themselves into red candles |
| ✓ | Delta agrees, OR delta is negative while price closed up | The second case is better. See below |
| ✓ | Volume at least normal | A strong close on no volume is a candle nobody participated in |
The criterion that sounds wrong
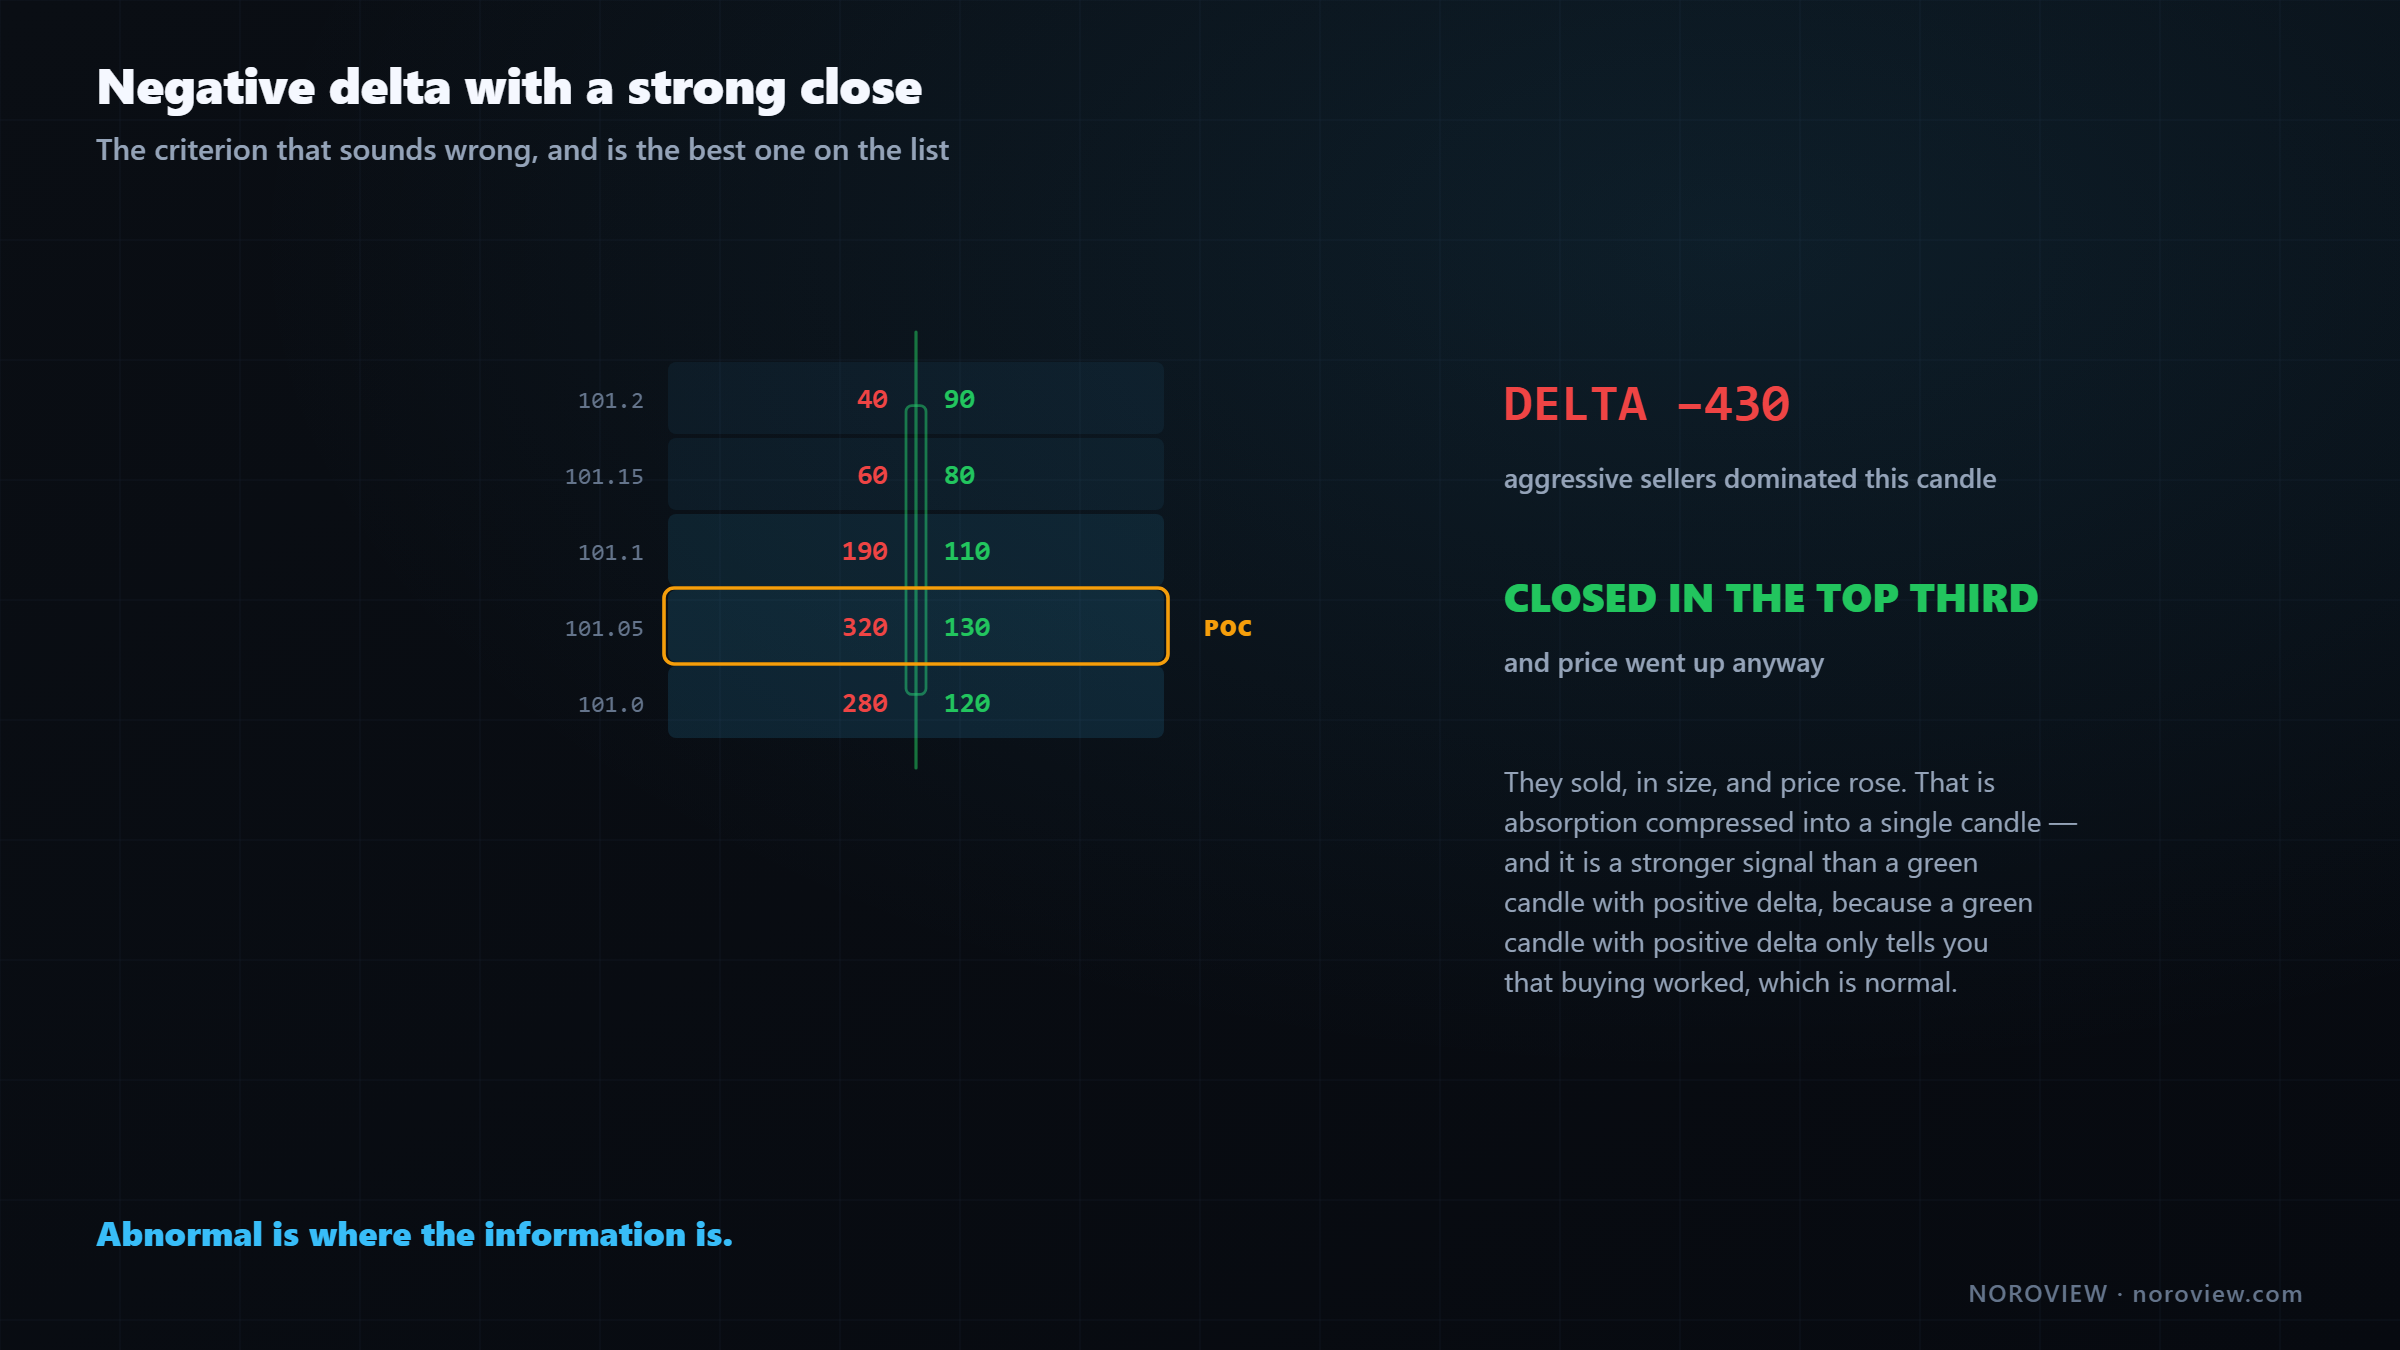
Negative delta + a strong close = selling that achieved nothing. That's absorption.
Think it through. Negative delta means aggressive sellers dominated during that candle. And price closed in the top third anyway. So they sold, in size, and price went up.
That is absorption expressed in a single candle, and it is a stronger signal than a green candle with positive delta — because a green candle with positive delta just tells you buyers bought and it worked, which is normal. Sellers selling and price rising is not normal. Abnormal is where the information is.
And volume must be at least normal. A beautiful strong close on almost no volume means nothing: a move on no volume is an empty book, not an event.
What makes me wait
| ✗ | Signal | What it means |
|---|---|---|
| ✗ | Closes in the middle of the range | Indecision. Both sides fought, nobody won. A coin flip with extra steps |
| ✗ | Long upper wick on a long entry | You are about to buy into sellers already active just above you |
| ✗ | Tiny range | No commitment either way |
| ✗ | Volume far below normal | Nobody was there |
Nothing is a perfectly valid outcome. Most candles are nothing.
The mirror, for shorts
Everything inverts: closes in the bottom third, upper wick present showing rejection from above, small lower wick, red body, and ideally positive delta with a weak close.
Positive delta + a weak close = buying that achieved nothing.
Where exactly to enter
Entry: at the close of the trigger candle, or on a small pullback into it.
Do not chase it if it runs away from the close. Which leads directly to the most valuable rule in the model.
Don't sell at the low. Don't buy at the high.
This sounds obvious to the point of being insulting. Everybody knows you should buy low and sell high. And almost everybody does the opposite, every single week. Here is exactly why.
Price starts moving up. You are watching. At the start you are unsure, so you wait. It keeps going. Now you are more confident — because it is going up, and going up is evidence. It goes further. Now you are certain.
Your confidence grows with the move. So does your risk.
Your confidence is built by the move itself, which means you are most confident at exactly the point where price is highest, furthest from any level, and most extended. That is the mechanism. It is not stupidity — it is a completely reasonable-feeling process that systematically puts you in at the worst price.
What that does to the arithmetic
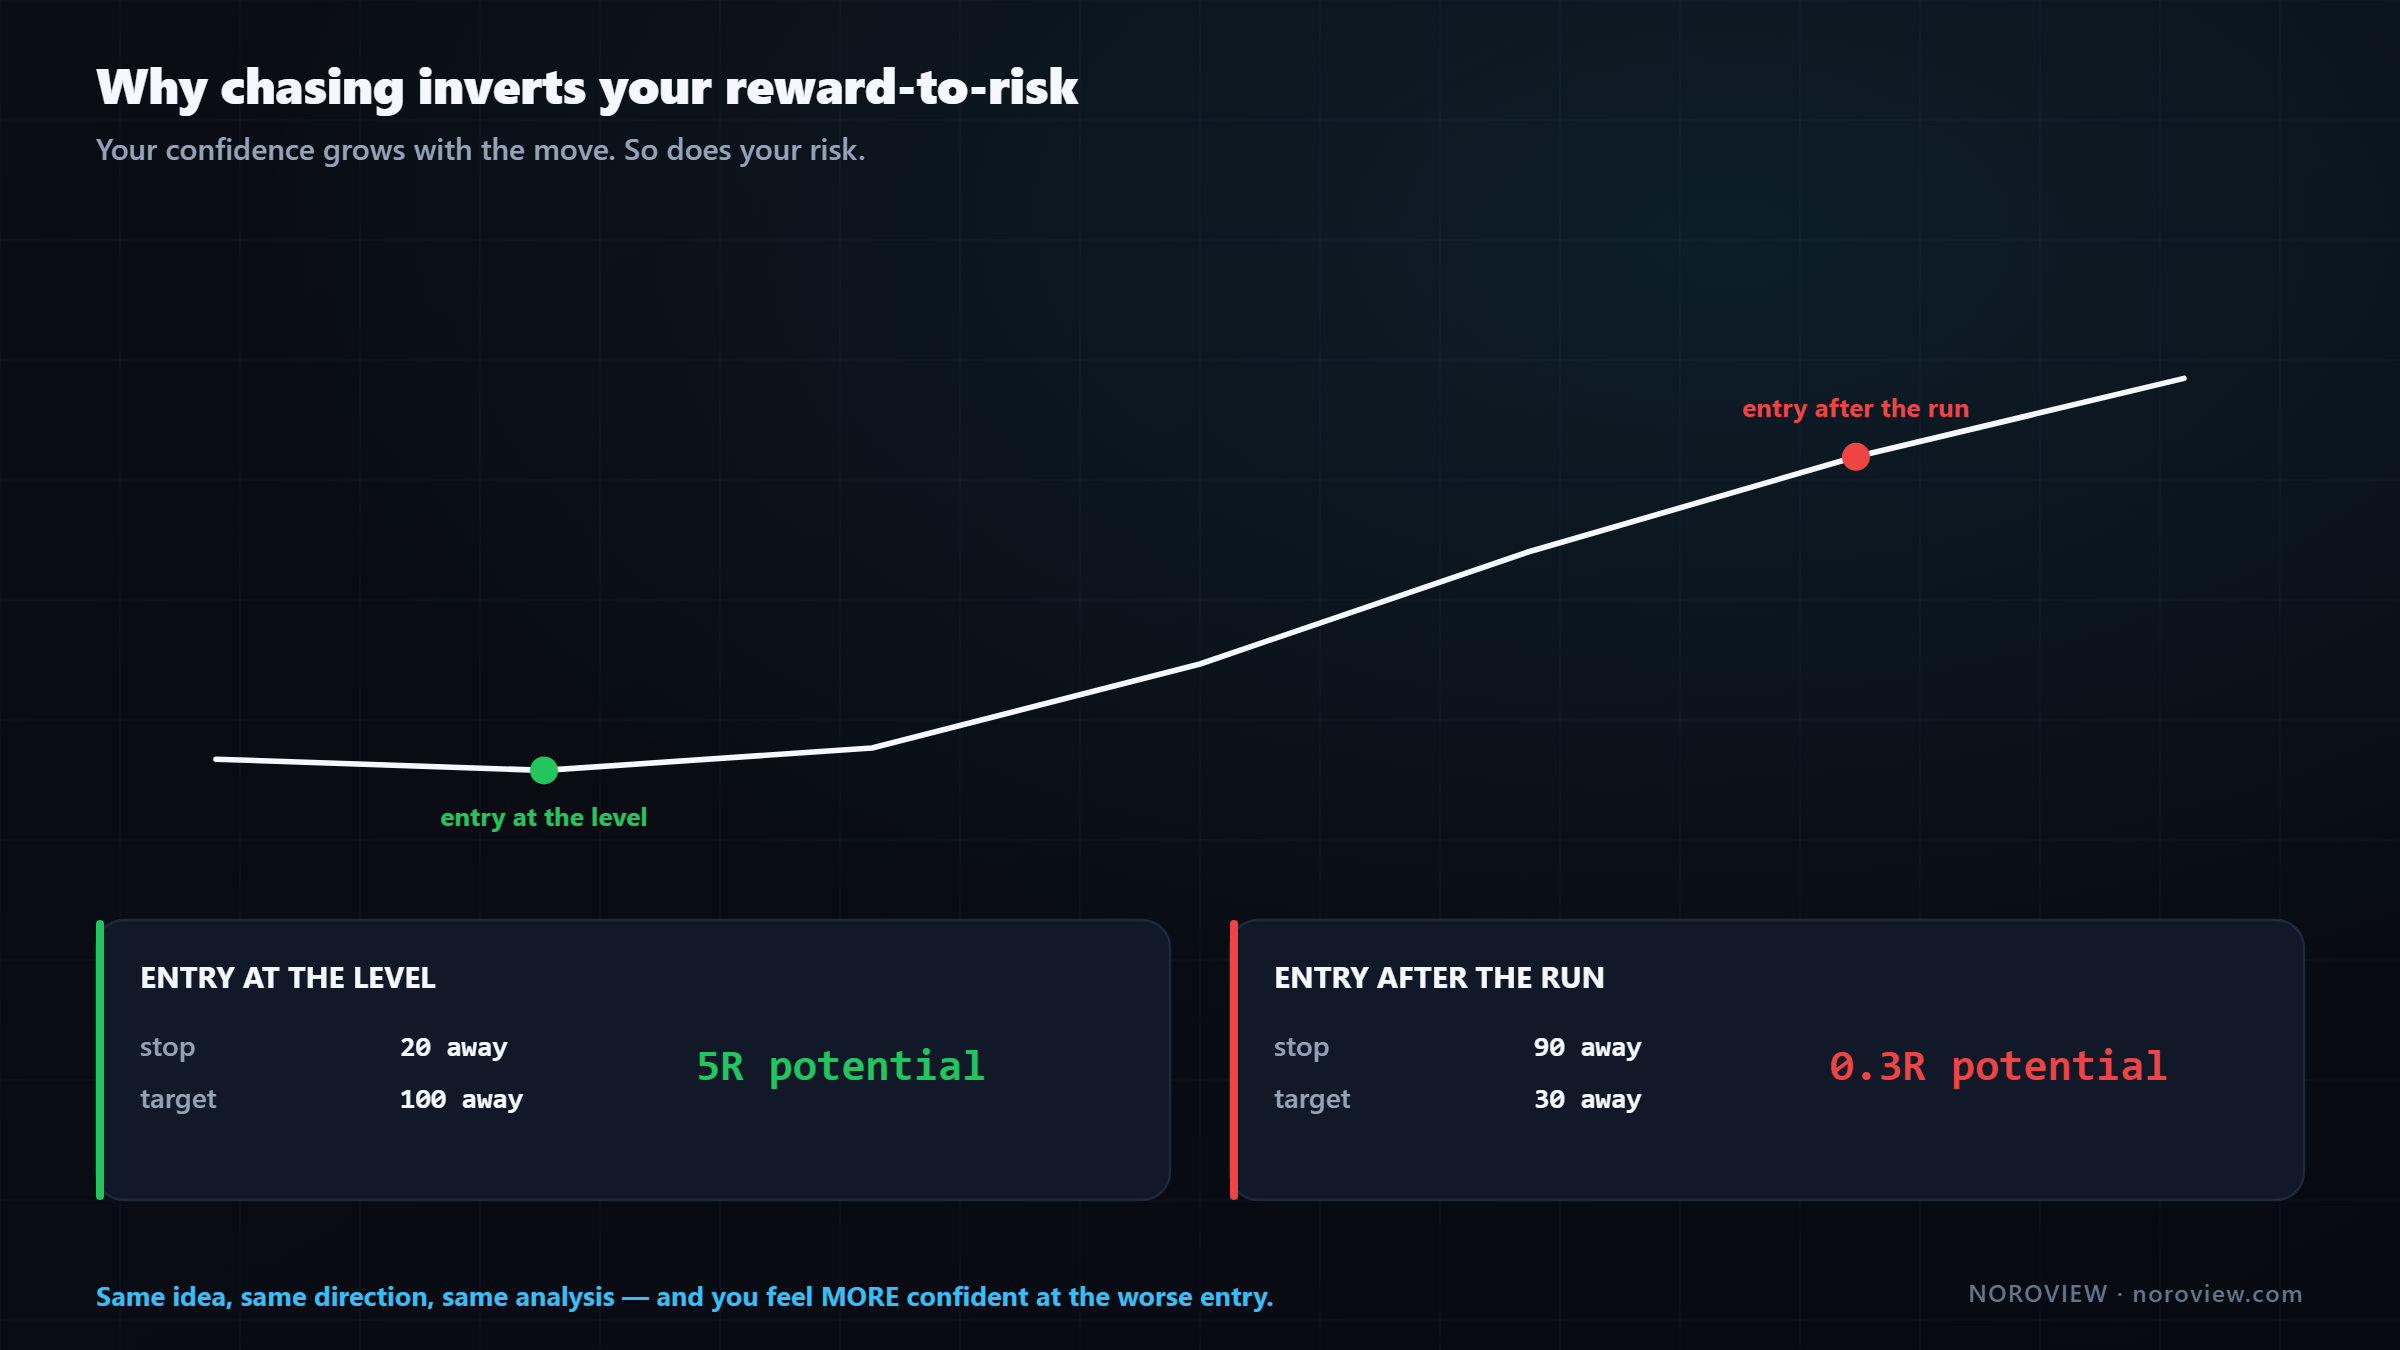
| Stop distance | Target distance | Potential | |
|---|---|---|---|
| Entry at the level | 20 away | 100 away | 5R |
| Entry after the run | 90 away | 30 away | 0.3R |
Same idea. Same direction. Same analysis. Completely different trade.
Enter at the level and your stop is close, because the level is right there, and your target is far, because the move has not happened yet. Enter after the run and your stop has to go all the way back behind the level — which is now far away — while your target is whatever is left of the move. You have inverted your reward-to-risk from excellent to unacceptable, while feeling more confident than you did at the good entry.
The best entries feel uncomfortable. The comfortable ones are expensive.
There is also an order-flow version of the same point: who are you buying from at the high? If price has been running up for twenty minutes and you buy, somebody is selling to you — and it is usually the participant who bought at the level you ignored.
The rule
- Enter at levels. Not in the middle of moves.
- If price has already left the level, the trade is gone. Wait for the next one.
The honest part: you will miss trades because of this. Some will be big, and you will watch them run without you. That is genuinely painful, and it is the cost of the rule. What you buy with that cost is that every trade you take has a defined, tight risk — you will never be down four times what you planned because you entered at the top and your stop was miles away.
Missing a trade costs you nothing. Chasing one costs you the trade AND the next three.
Missing a trade costs zero. It is the only completely free outcome in this business. Chasing a trade costs the loss, plus the confidence, plus usually the next two or three decisions.
And the mirror: do not sell at the low. Price has already dropped a long way, everything looks terrible, and shorting feels safe — because it has been going down. You are selling to the buyers stepping in at a level, giving somebody a good entry from a bad one.
Practise the trigger a hundred times before you risk anything
Market Replay steps bar by bar through real order flow, and the paper-trading simulator fills only on the live market. Both are free. Create a free account → · Compare plans
Volume outside the value area
This filter upgrades everything in the model.
The same volume means different things inside and outside the value area.
Remember what the value area is: the range where the bulk of business happened — the prices the market considers acceptable.
Inside the value area, heavy volume is completely normal. That is what a value area is — it is defined by having lots of volume. Business happening at an accepted price is just business. It carries very little information.
Outside the value area is a different situation entirely. These are prices the market has rejected — prices where it does not want to trade. Volume out there should be small, because price should be moving through quickly.
Big volume inside value = business as usual. Big volume outside value = someone made a deliberate decision at a rejected price.
When you see a large amount of business at a price the market has rejected, that is not the crowd. The crowd is inside value. That is somebody who wanted that specific price badly enough to transact where almost nobody else was willing to.
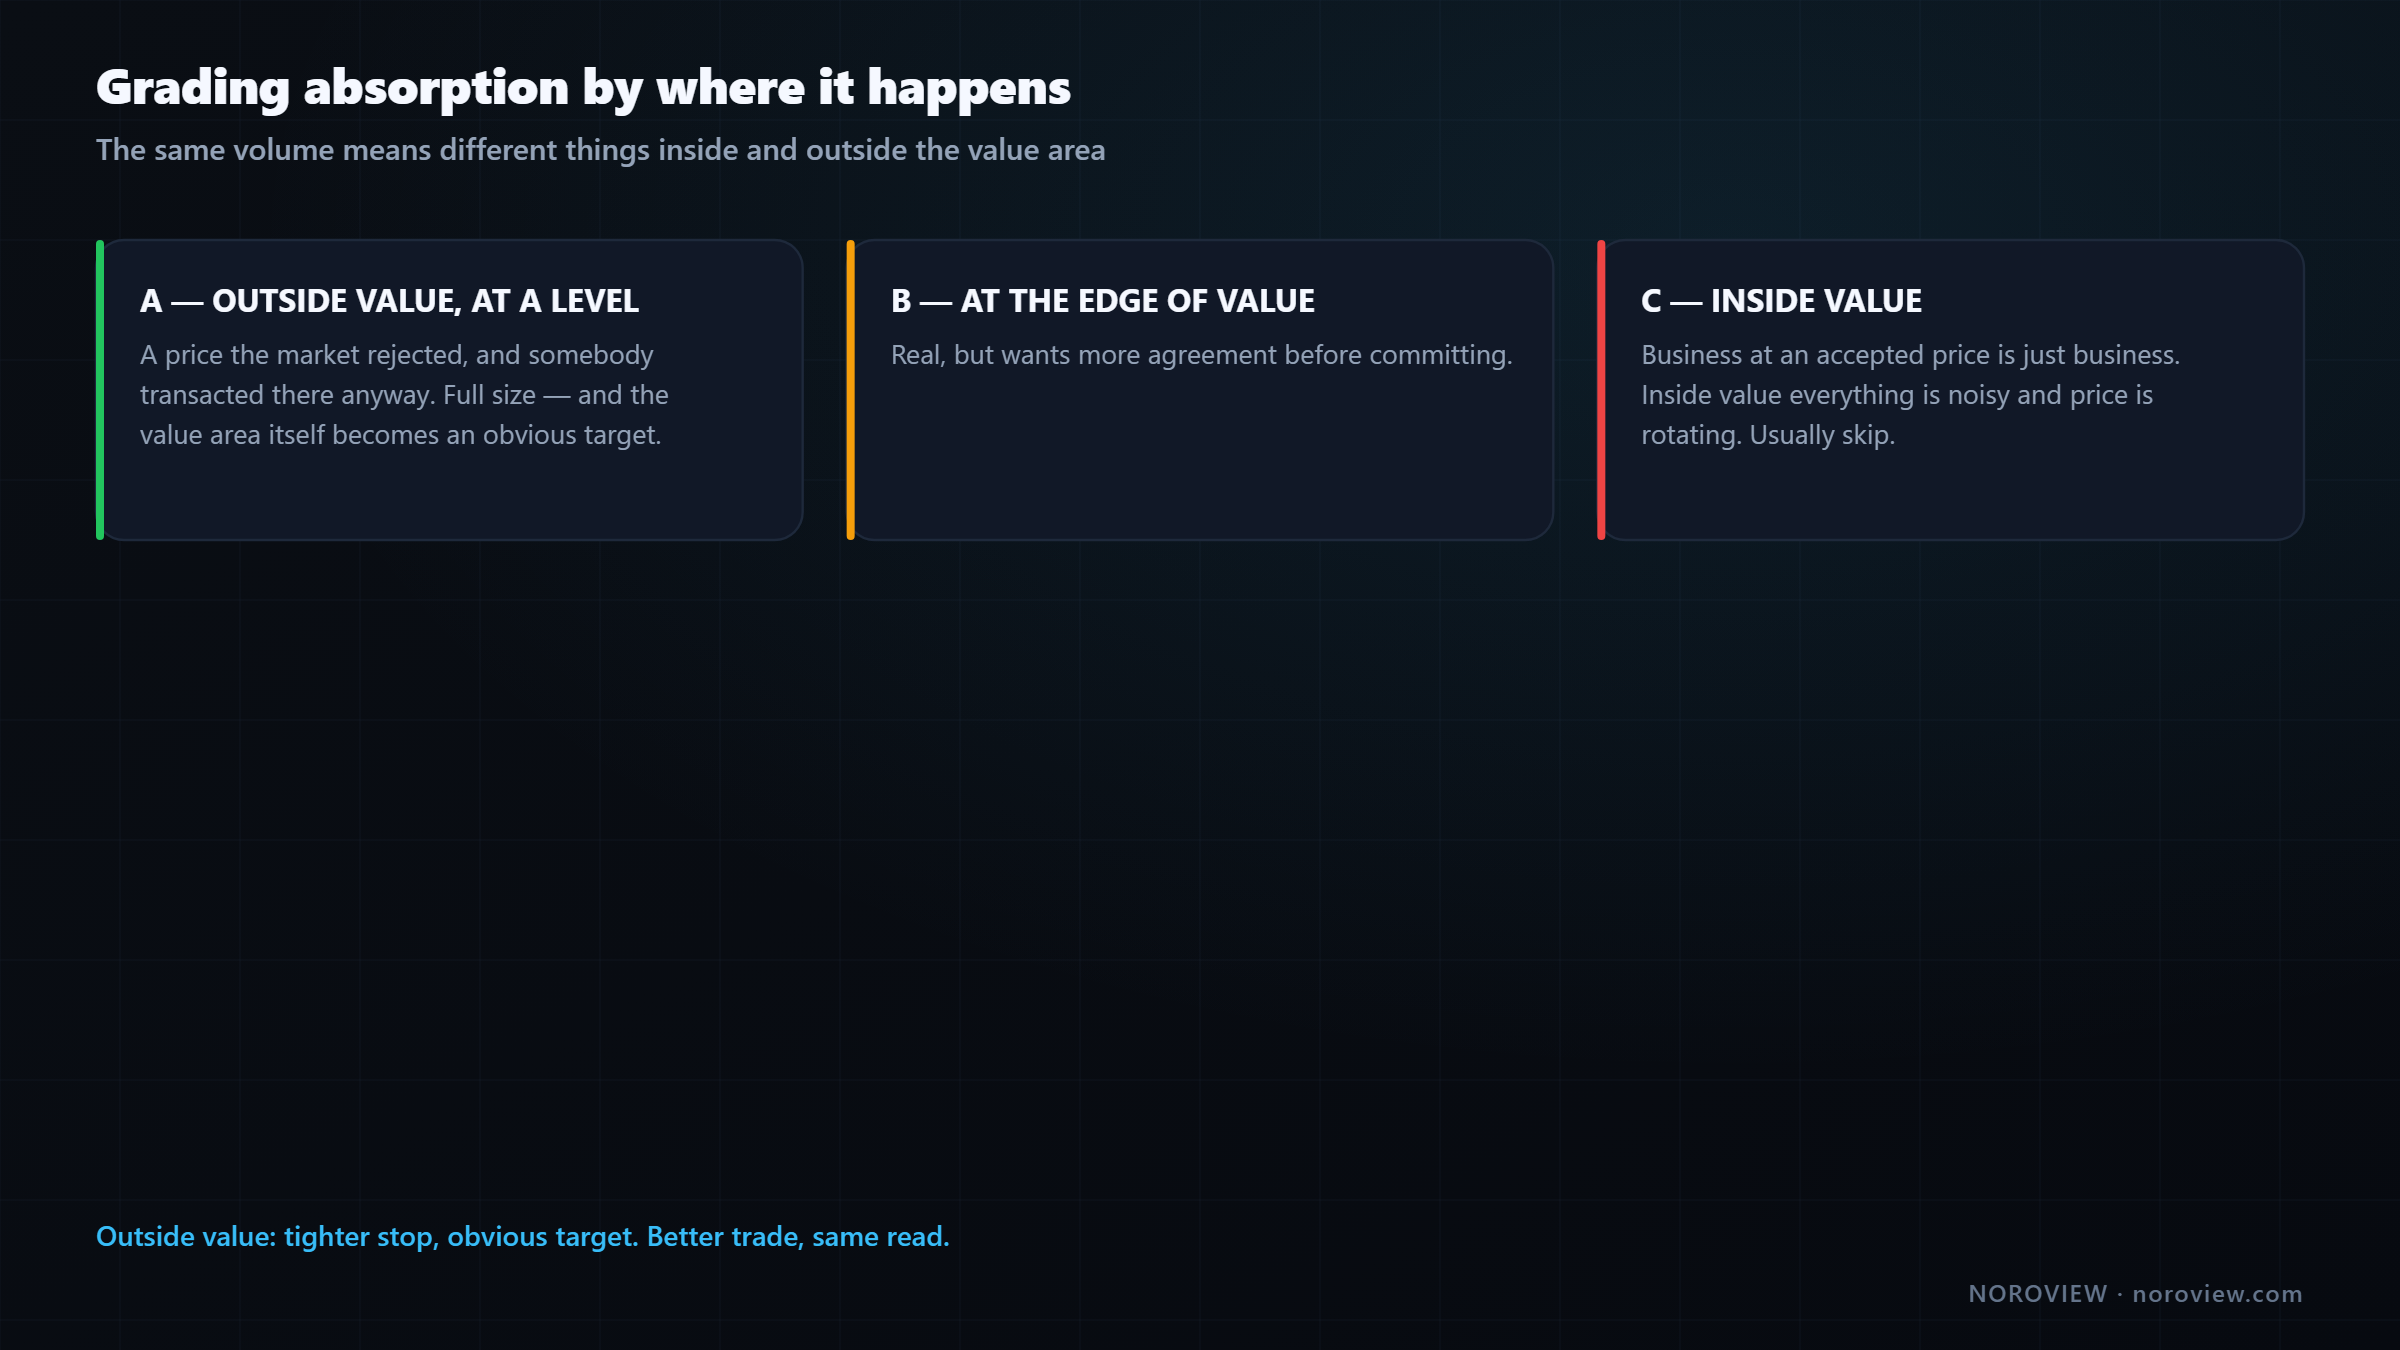
| Grade | Situation | Action |
|---|---|---|
| A | Absorption outside value, at a level | Full size |
| B | Absorption at the edge of value | Real, but wants more agreement before committing |
| C | Absorption inside value | Usually skip — inside value everything is noisy and price is rotating |
There is a practical bonus too: outside the value area you are near an extreme, which makes the value area itself an obvious target. Tight stop behind your level, natural well-defined target back inside value.
Outside value: tighter stop, obvious target. Better trade, same read.
Same evidence, better geometry. That is what a good filter does — it does not just improve your win rate, it improves the shape of the trade.
The blockers
The most valuable section here, and the one nobody teaches.
A blocker cancels the trade. Even when everything else is perfect. Especially then.
The reason this list exists is simple: when the setup looks perfect, your judgement is at its worst. Which is exactly when you need a rule that is not subject to your judgement.
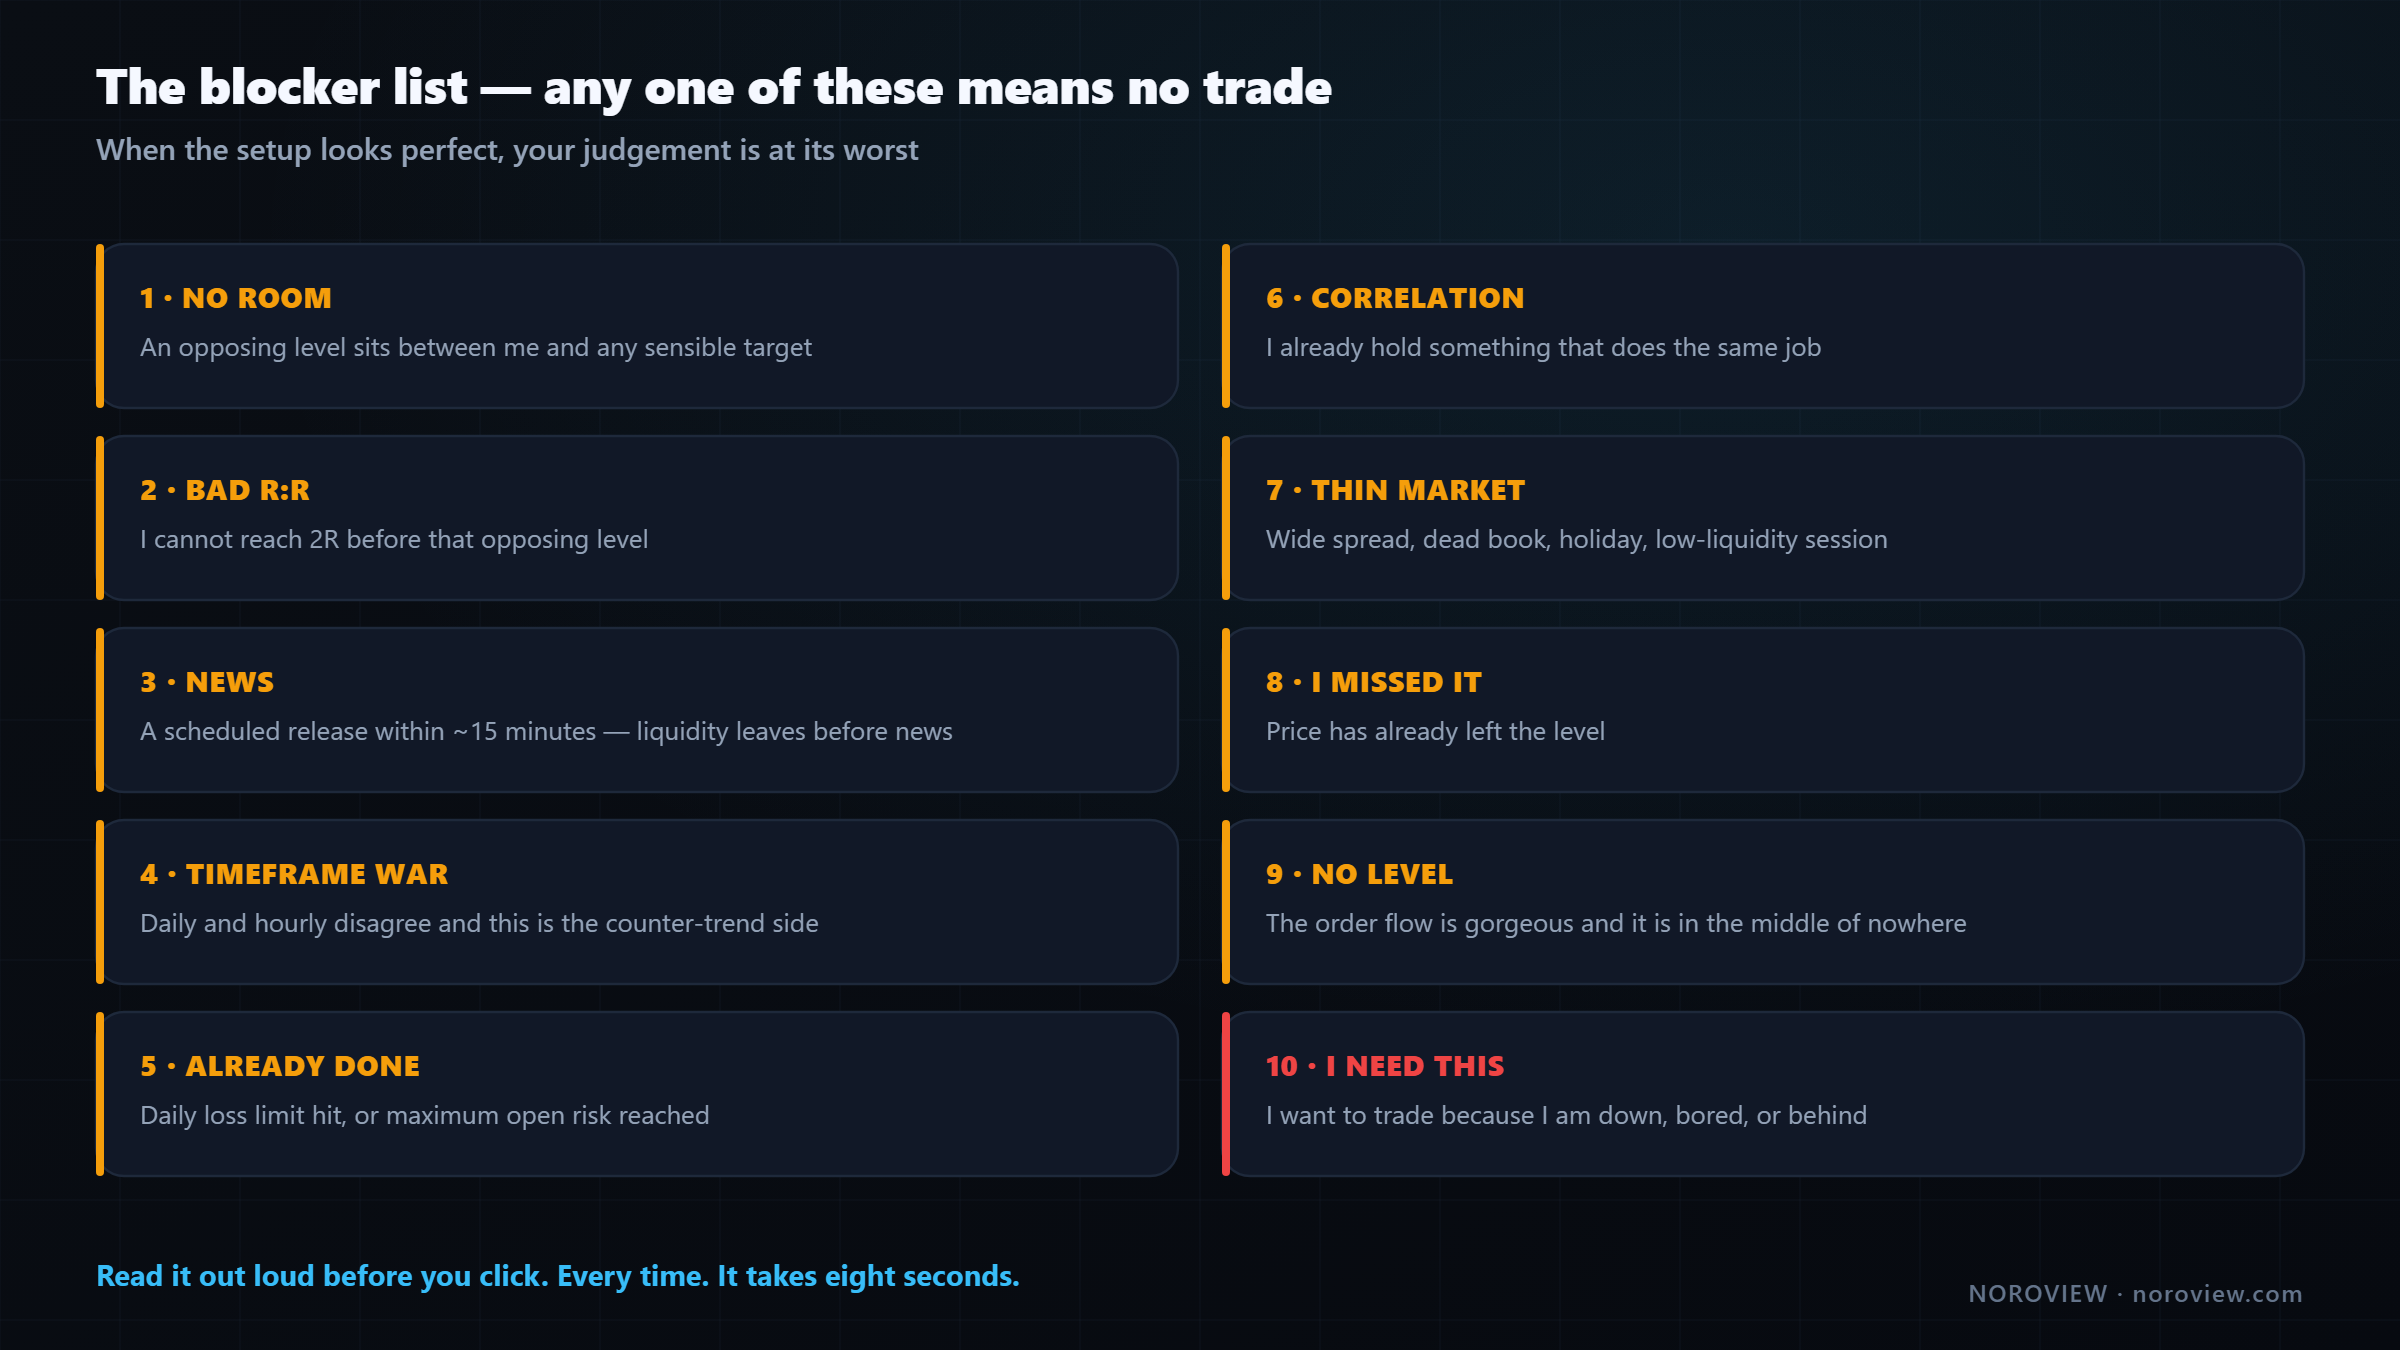
| # | Blocker | Why it vetoes |
|---|---|---|
| 1 | No room | An opposing level sits between me and any sensible target. Even if I am completely right, price stops there. A correct trade with nowhere to go is a losing trade with extra paperwork |
| 2 | Bad R:R | I cannot reach 2R before that opposing level. Arithmetic, not preference — at my win rate, trades below that ratio do not survive the losing streaks |
| 3 | News | A scheduled release within ~15 minutes. Not because news is unpredictable, but because liquidity leaves before news. Spreads widen and your stop stops being your stop |
| 4 | Timeframe war | Daily and hourly disagree and this is the counter-trend side. Smaller, or skip |
| 5 | Already done | Daily loss limit hit, or maximum open risk reached. Absolute, and not negotiable by any setup quality (lesson 14) |
| 6 | Correlation | I already hold something that does the same job. Two longs in two correlated crypto pairs is one position at double size |
| 7 | Thin market | Wide spread, dead book, holiday or low-liquidity session. Your stop can be jumped straight over |
| 8 | I missed it | Price has already left the level. The trade existed; now it does not |
| 9 | No level | The order flow is gorgeous and it is in the middle of nowhere. This tempts you most in the weeks right after learning footprints |
| 10 | I need this | I want to trade because I am down, bored, or behind |
Number ten deserves its own paragraph
If you are down for the day and looking for a way back. If you have been flat for three days and you are bored. If you missed a big move and you want in on the next one. If somebody is watching.
If you NEED the trade, you're not allowed to take it.
That is not a soft rule about mindset. It is a hard veto, and it belongs on the same list as the technical ones — because it destroys more accounts than every technical error combined. Regulators publish the aggregate outcome of this behaviour: ESMA's retail intervention measures exist precisely because the majority of retail accounts lose money, and the mechanism is rarely a bad chart read.
Read the blocker list out loud before you click. Every time.
Print it. Put it next to your screen. Read it — out loud if you are alone — before every entry. It takes eight seconds, it will feel ridiculous for about two weeks, and then it will save you a trade that would have cost more than the whole exercise.
Automating the trigger (optional)
Once the model is second nature you can have the platform watch for it. The smart candle filter is a rule builder: pick an order-flow content, compare it against a calibrated threshold or a manual value, add price-action conditions, and every matching candle gets marked.
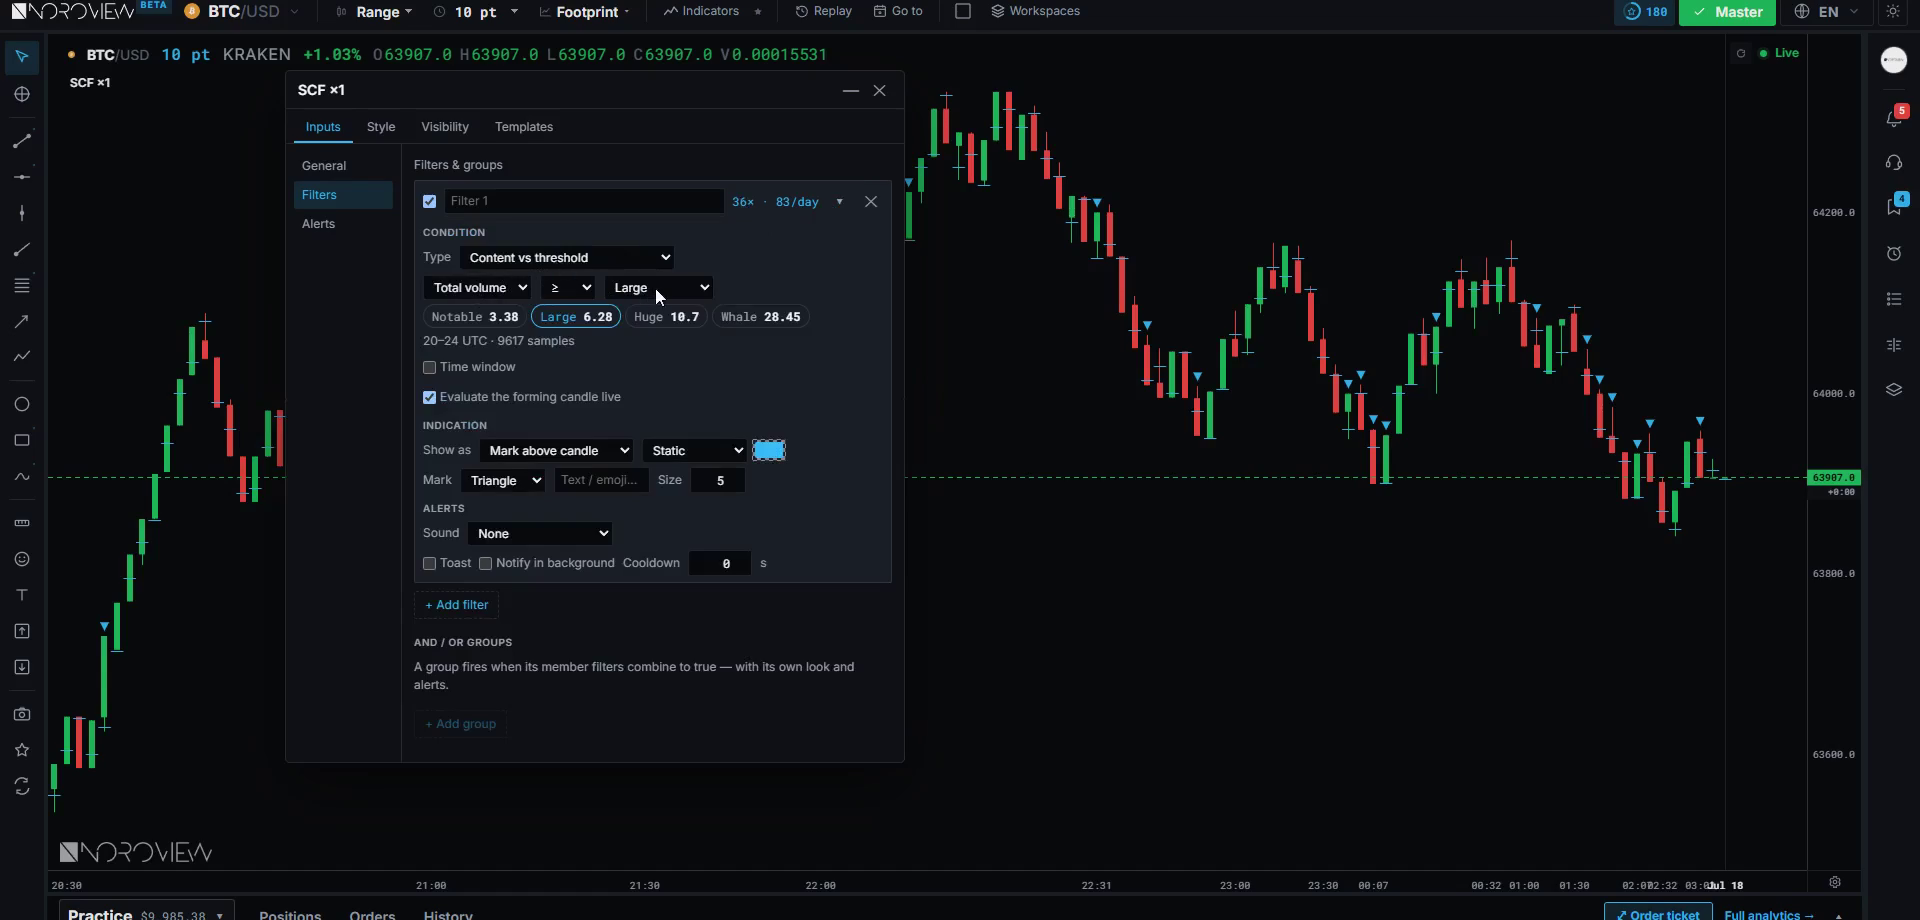
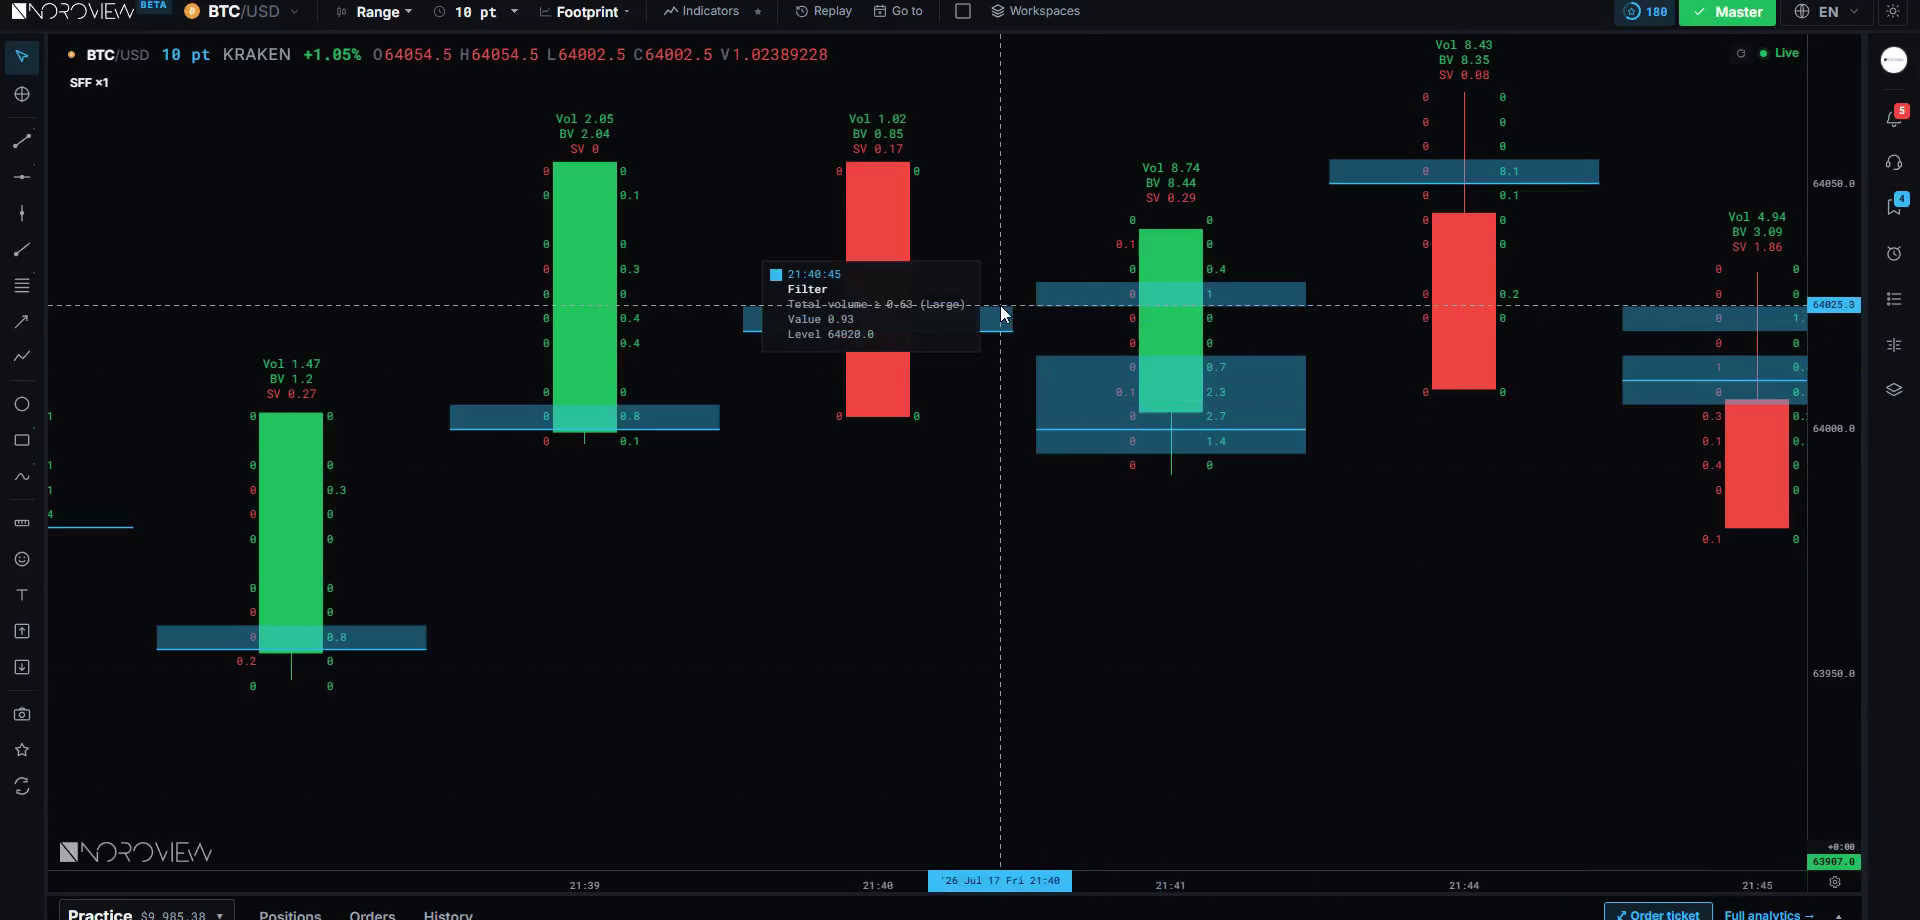
This does not replace the model. It finds candidates; you still run steps 1, 2, 5, 6 and 7 by hand.
Stop and size, in one paragraph
The stop goes behind the level, at the price where the thing you observed has factually failed — below the absorbed level for a long, above it for a short, with a small tolerance so a wick does not take you out. Then the position size is calculated from that stop distance, so the loss costs a fixed, small percentage of the account. Never the other way round. Never pick a size and then find a stop that fits it. The full treatment is lesson 14, and what to do after entry is lesson 16.
Common mistakes
- Entering on evidence rather than a trigger. This is why you get stopped out at the low by two ticks.
- Taking a trade with no level because the order flow looked beautiful.
- Chasing after price leaves the level. The trade existed; it does not any more.
- Treating a mid-range close as a trigger. That is indecision, not confirmation.
- Ignoring the upper wick on a long entry. Sellers are active right above you.
- Grading all absorption equally instead of filtering by the value area.
- Skipping the blocker list when the setup looks perfect. That is precisely when it exists.
- Sizing first and finding a stop afterwards.
Your homework
About two hours, and this is the most important homework in the course.
- Write your own blocker list on paper. Start from the ten above, delete any that genuinely do not apply to you, and add at least one from your own history. Put it next to your screen.
- In replay, find ten valid trigger candles using the full form specification. For each, note whether delta agreed or was negative with a strong close.
- Find three trades you would have chased, and calculate the R:R at the level versus the R:R after the run. Write both numbers down.
Open Market Replay and drill the trigger →
Three things to remember
- Four conditions build the trade: level, context, evidence, trigger. Miss any one and it is not a trade.
- Evidence is not entry. The trigger is the candle after the event failing to make a new extreme and closing strong — and negative delta with a strong close is the best version of it.
- The blocker list is the most valuable part of the model, and it is read after you find a setup, out loud, every time.
← Previous: Absorption, Exhaustion, Icebergs and Imbalance · Course index: Order Flow Trading Course · Next → Cumulative Volume Delta (CVD)
Frequently asked questions
What is an order flow entry model? A defined sequence that converts a market read into a position: price must be at a mapped level, the trade must agree with higher-timeframe context, the order flow must show a specific event such as absorption, and a trigger candle must confirm it. A veto list is then run before risk is sized.
Why do I keep getting stopped out at the low by a few ticks? Almost always because you entered on evidence rather than on a trigger. Absorption can occur several times before the level actually holds. Waiting for the following candle to fail to make a new extreme costs a slightly worse entry and removes most of those repeated losses.
Should I enter on the close of the candle or wait for a pullback? Either, provided you do not chase. Entering at the close of the trigger candle or on a shallow pullback into its body both keep the stop tight behind the level. What breaks the model is entering after price has already travelled away from the level.
What is a trading veto list? A fixed list of conditions that cancel a trade regardless of how good the setup looks — no room to a target, poor reward-to-risk, imminent news, correlation with an existing position, a thin market, or simply needing the trade. It works because it is applied when judgement is weakest.
When should you not take a trade? When there is no level, when price has already left the level, when an opposing level blocks any sensible target, when you cannot reach roughly twice your risk, when a scheduled news release is imminent, when you have hit your daily loss limit, or when you feel you need the trade.
Where do you place your stop in an order flow trade? Behind the level, at the price where the observation has factually failed — below the absorbed level for a long, above it for a short, with enough tolerance that a wick does not remove you. Position size is then calculated from that distance, never the reverse.
Is negative delta on a green candle bullish? It can be a strong bullish signal. If aggressive sellers dominated the candle and price still closed in the top third of its range, their selling achieved nothing — which is absorption compressed into a single candle, and more informative than a green candle where buying simply worked.
Sources
- Investopedia — risk/reward ratio
- European Securities and Markets Authority — retail investor protection measures
Soroosh Moghimi — six years inside financial markets: algorithmic trading, HFT, crypto and AI, after a decade building startups. He publishes this course free because he already paid for the lessons in it. There is no paid course and no signal group. @sorooshmoghimi · About
Start reading real order flow
You cannot learn this from a candlestick chart, and you do not need to spend a cent to begin. The standard footprint chart is free for every NOROVIEW user, market replay is free, and the paper-trading simulator is free.
Open NOROVIEW free → · Compare plans →
⚠️ DISCLAIMER — EDUCATIONAL CONTENT ONLY
This article is for educational and informational purposes only. It is not financial, investment, or trading advice, and nothing in it is a recommendation to buy, sell, or hold any asset. Trading cryptocurrencies and leveraged derivatives is high risk and can result in the loss of some or all of your capital. Only risk money you can afford to lose. Any levels, indicators, signals or results shown are illustrative and are not a promise or prediction of future performance. Charts may be shown on a demo or paper-trading account and do not represent real trades or returns. Always do your own research. You alone are responsible for your decisions.
Keep reading
Related posts

16. Trade Management: Break-Even, Partials and Trailing Stops
Trade management explained: when break-even stops cost you money, partial exits, four kinds of trailing stop, the order-flow exit, and diagnosing yourself with MFE and MAE.
15. How to Day Trade Crypto With Order Flow (Starting Small)
How to day trade crypto with order flow: exchange security, spot vs perpetuals, leverage and liquidation, order types, fees, and an honest $100 starting plan.

14. Risk, Drawdown and the Mind: Day Trading's Real Edge
Day trading risk management and psychology: position sizing math, drawdown recovery arithmetic, hard limits, decision vs outcome, and the five states that break traders.

13. Fair Value Gaps, Confirmed With Order Flow
Most fair value gaps do nothing. Five order-flow checks that tell you in advance which FVGs are worth trading and which are decoration.

5. Market Structure and Trend: How to Pick Your Side Objectively
How to identify market structure objectively: higher highs and higher lows, swing point rules, impulse vs correction, and the arithmetic behind trading with the trend.

9. The Only Support and Resistance Levels I Actually Trade
Order flow support and resistance: how to find levels built from participants rather than price — high-ATS levels, automatic S&R and untested POCs.
Discussion (0)
Want to join the discussion? Comments live inside the platform.
Open NOROVIEW