
13. Fair Value Gaps, Confirmed With Order Flow
Most fair value gaps do nothing. Five order-flow checks that tell you in advance which FVGs are worth trading and which are decoration.

13. Fair Value Gaps, Confirmed With Order Flow
Most fair value gaps do nothing. Price walks straight through them as though they are not there. That is not because the concept is wrong — the concept is genuinely sound and I use it — it is because the standard way of identifying them has no filter.
A fair value gap is a three-candle price pattern that infers missing volume. Volume tools measure it. This article gives you five checks, using footprint data, that tell you in advance which gaps are worth trading and which ones are decoration.
If you already trade ICT concepts or price action, this one is for you specifically. You are already finding the right locations. This is how to know which of them will hold. Open a chart and run check 1 on your next gap — it takes four seconds.
What you'll learn in this lesson
- The precise definition, and what is physically happening inside a gap
- Why "fair value gap," "low volume node" and "imbalance" describe the same event
- The three real mechanisms behind gaps filling — and the trap hiding in the third
- Why marking every gap destroys the signal
- The five checks, in order, with the one that eliminates more bad gaps than everything else combined
- Which part of the gap to use (and why the argument is mostly pointless)
- Inversion: what to do when a gap fails
Lesson 13 of 16 · Part 2 — Technique. Part of the free order flow trading course. Previous: Cumulative Volume Delta (CVD). Next: Day Trading Risk Management and Psychology.
▶ Prefer to watch it?
Check 3 lives here — Order-Flow Imbalance, Unfinished Auction & Trapped Traders (Ep 15) shows the imbalance detector measuring what the three-candle rule only infers.
What a fair value gap actually is
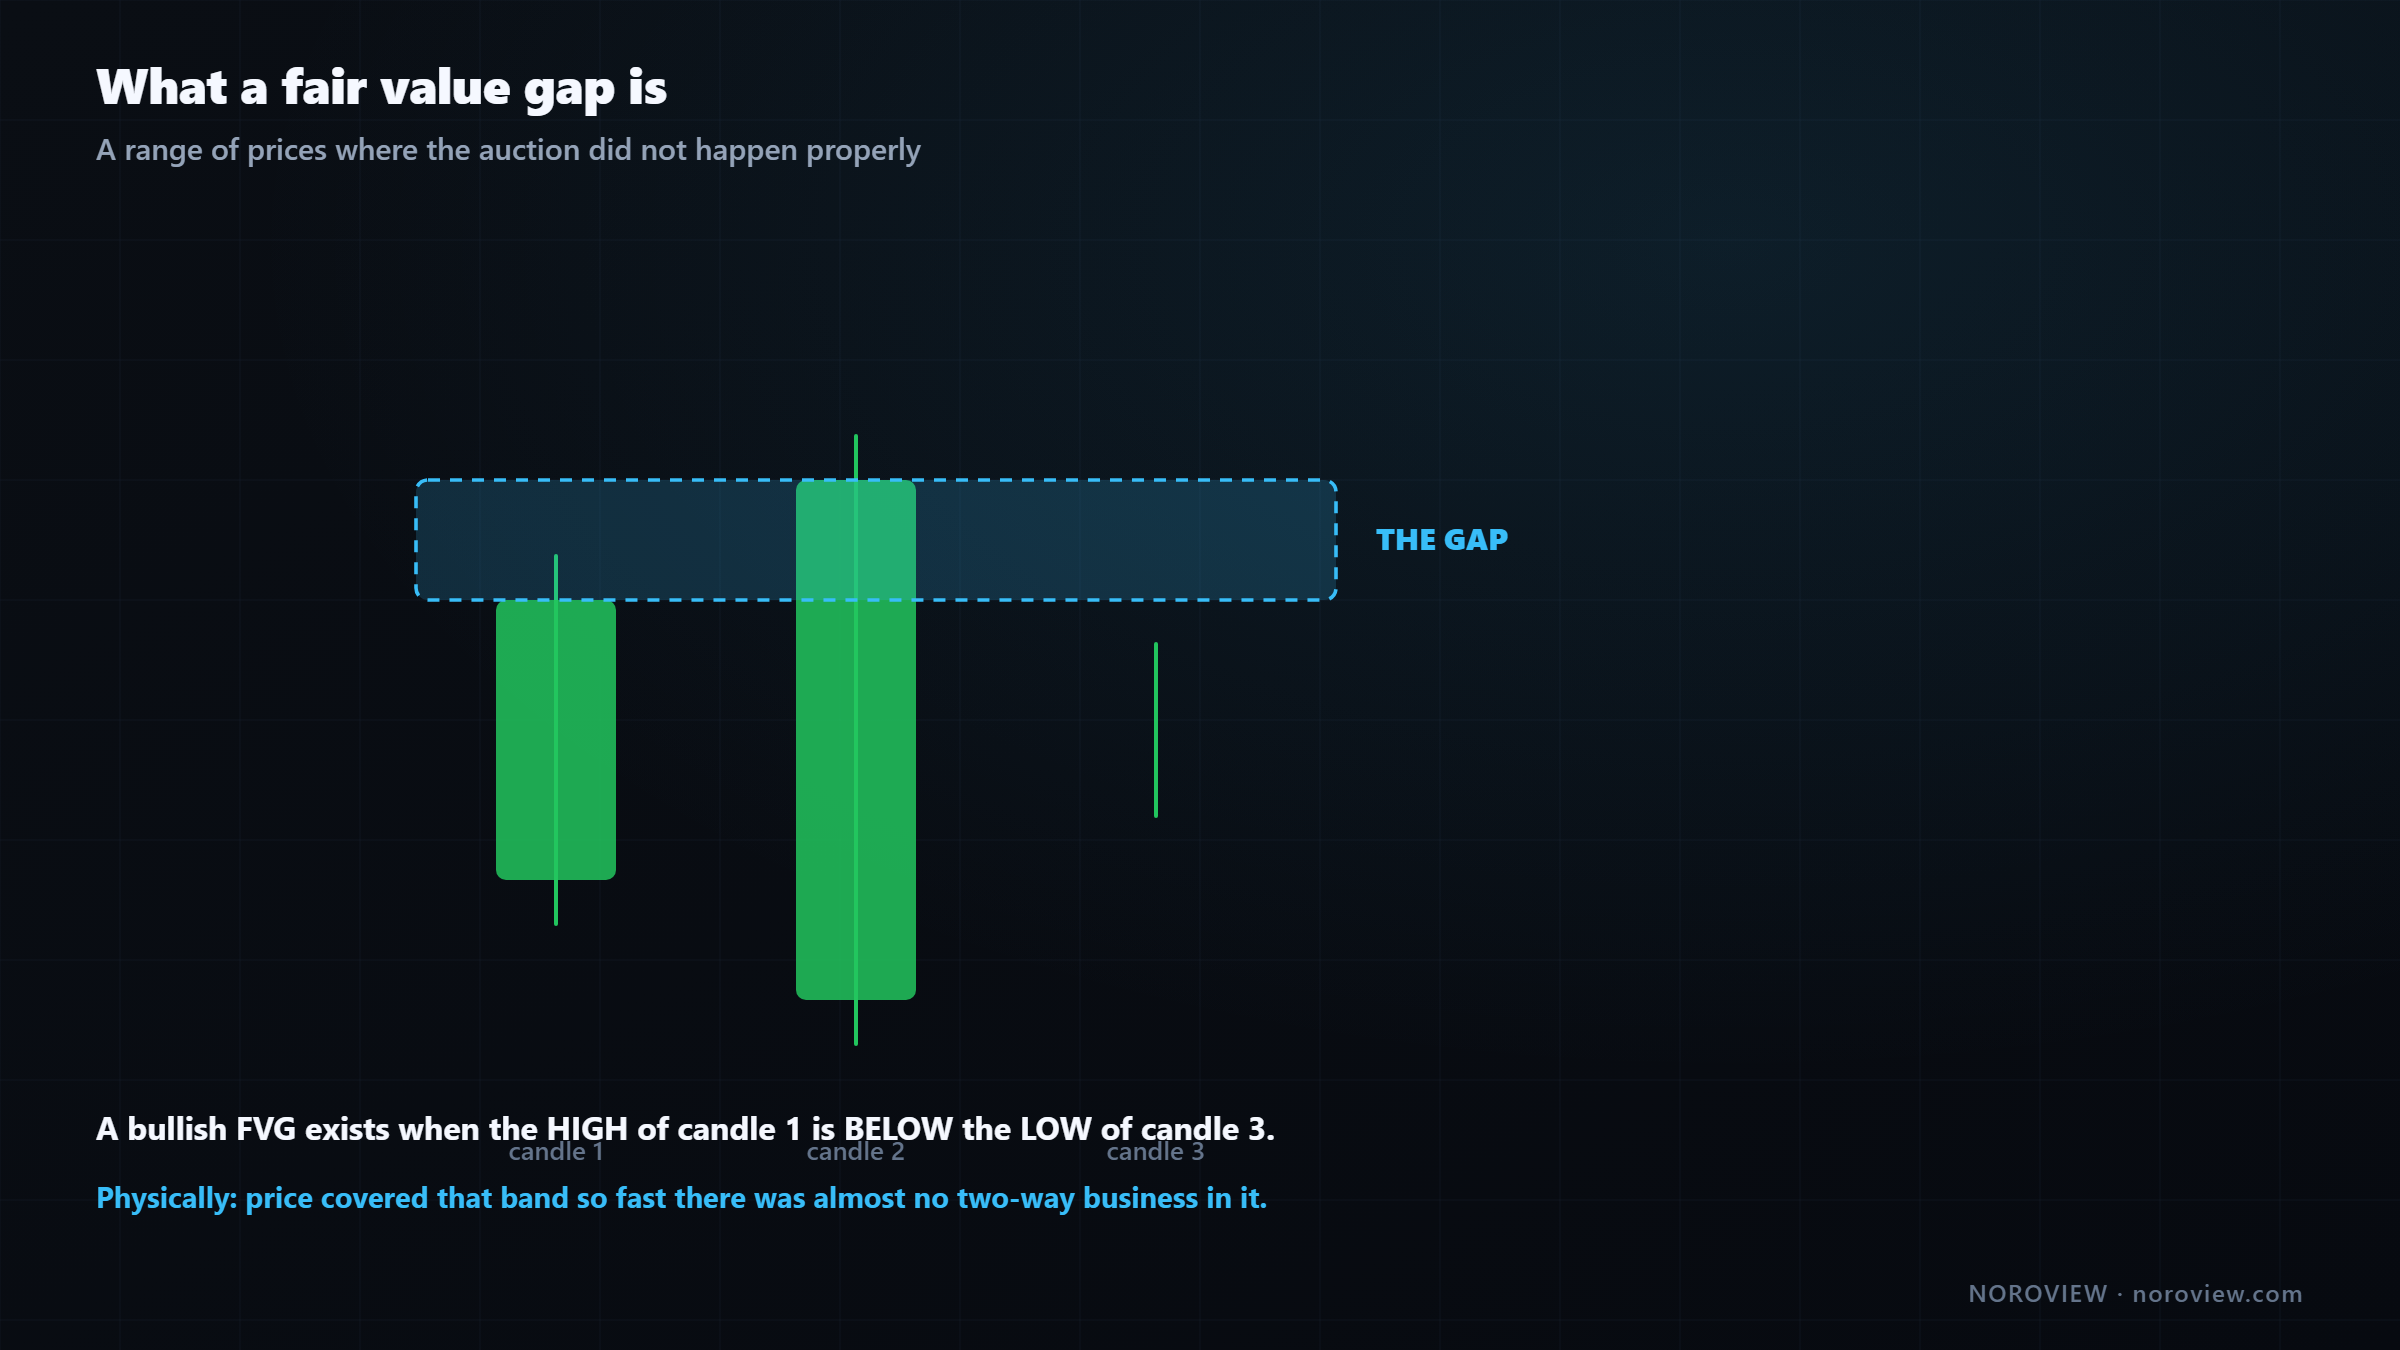
A BULLISH fair value gap exists when:
     the HIGH of candle 1  is BELOW  the LOW of candle 3

The gap is the space between those two prices.
Three candles. If the high of the first is below the low of the third, there is a band of prices the first and third candles never touched — candle two blew straight through it. The bearish version is the mirror: the low of candle one is above the high of candle three.
The definition is the easy part. What is physically happening?
Price moved so fast that one side barely got to trade.
In a normal market price moves gradually: ticks up, sellers meet buyers, business gets done at each price, ticks up again. Everyone who wanted to participate at each price had a chance.
In a fair value gap that did not happen. Price covered that band so quickly that there was almost no two-way business in it. One side completely dominated, and anybody who wanted to trade in that range and was not already there simply missed it.
A gap is a range of prices where the auction didn't happen properly.
Three names for one thing
| The name | The view |
|---|---|
| Fair value gap | The price-based view (this article) |
| Low volume node | The volume profile view |
| Imbalance | The footprint view |
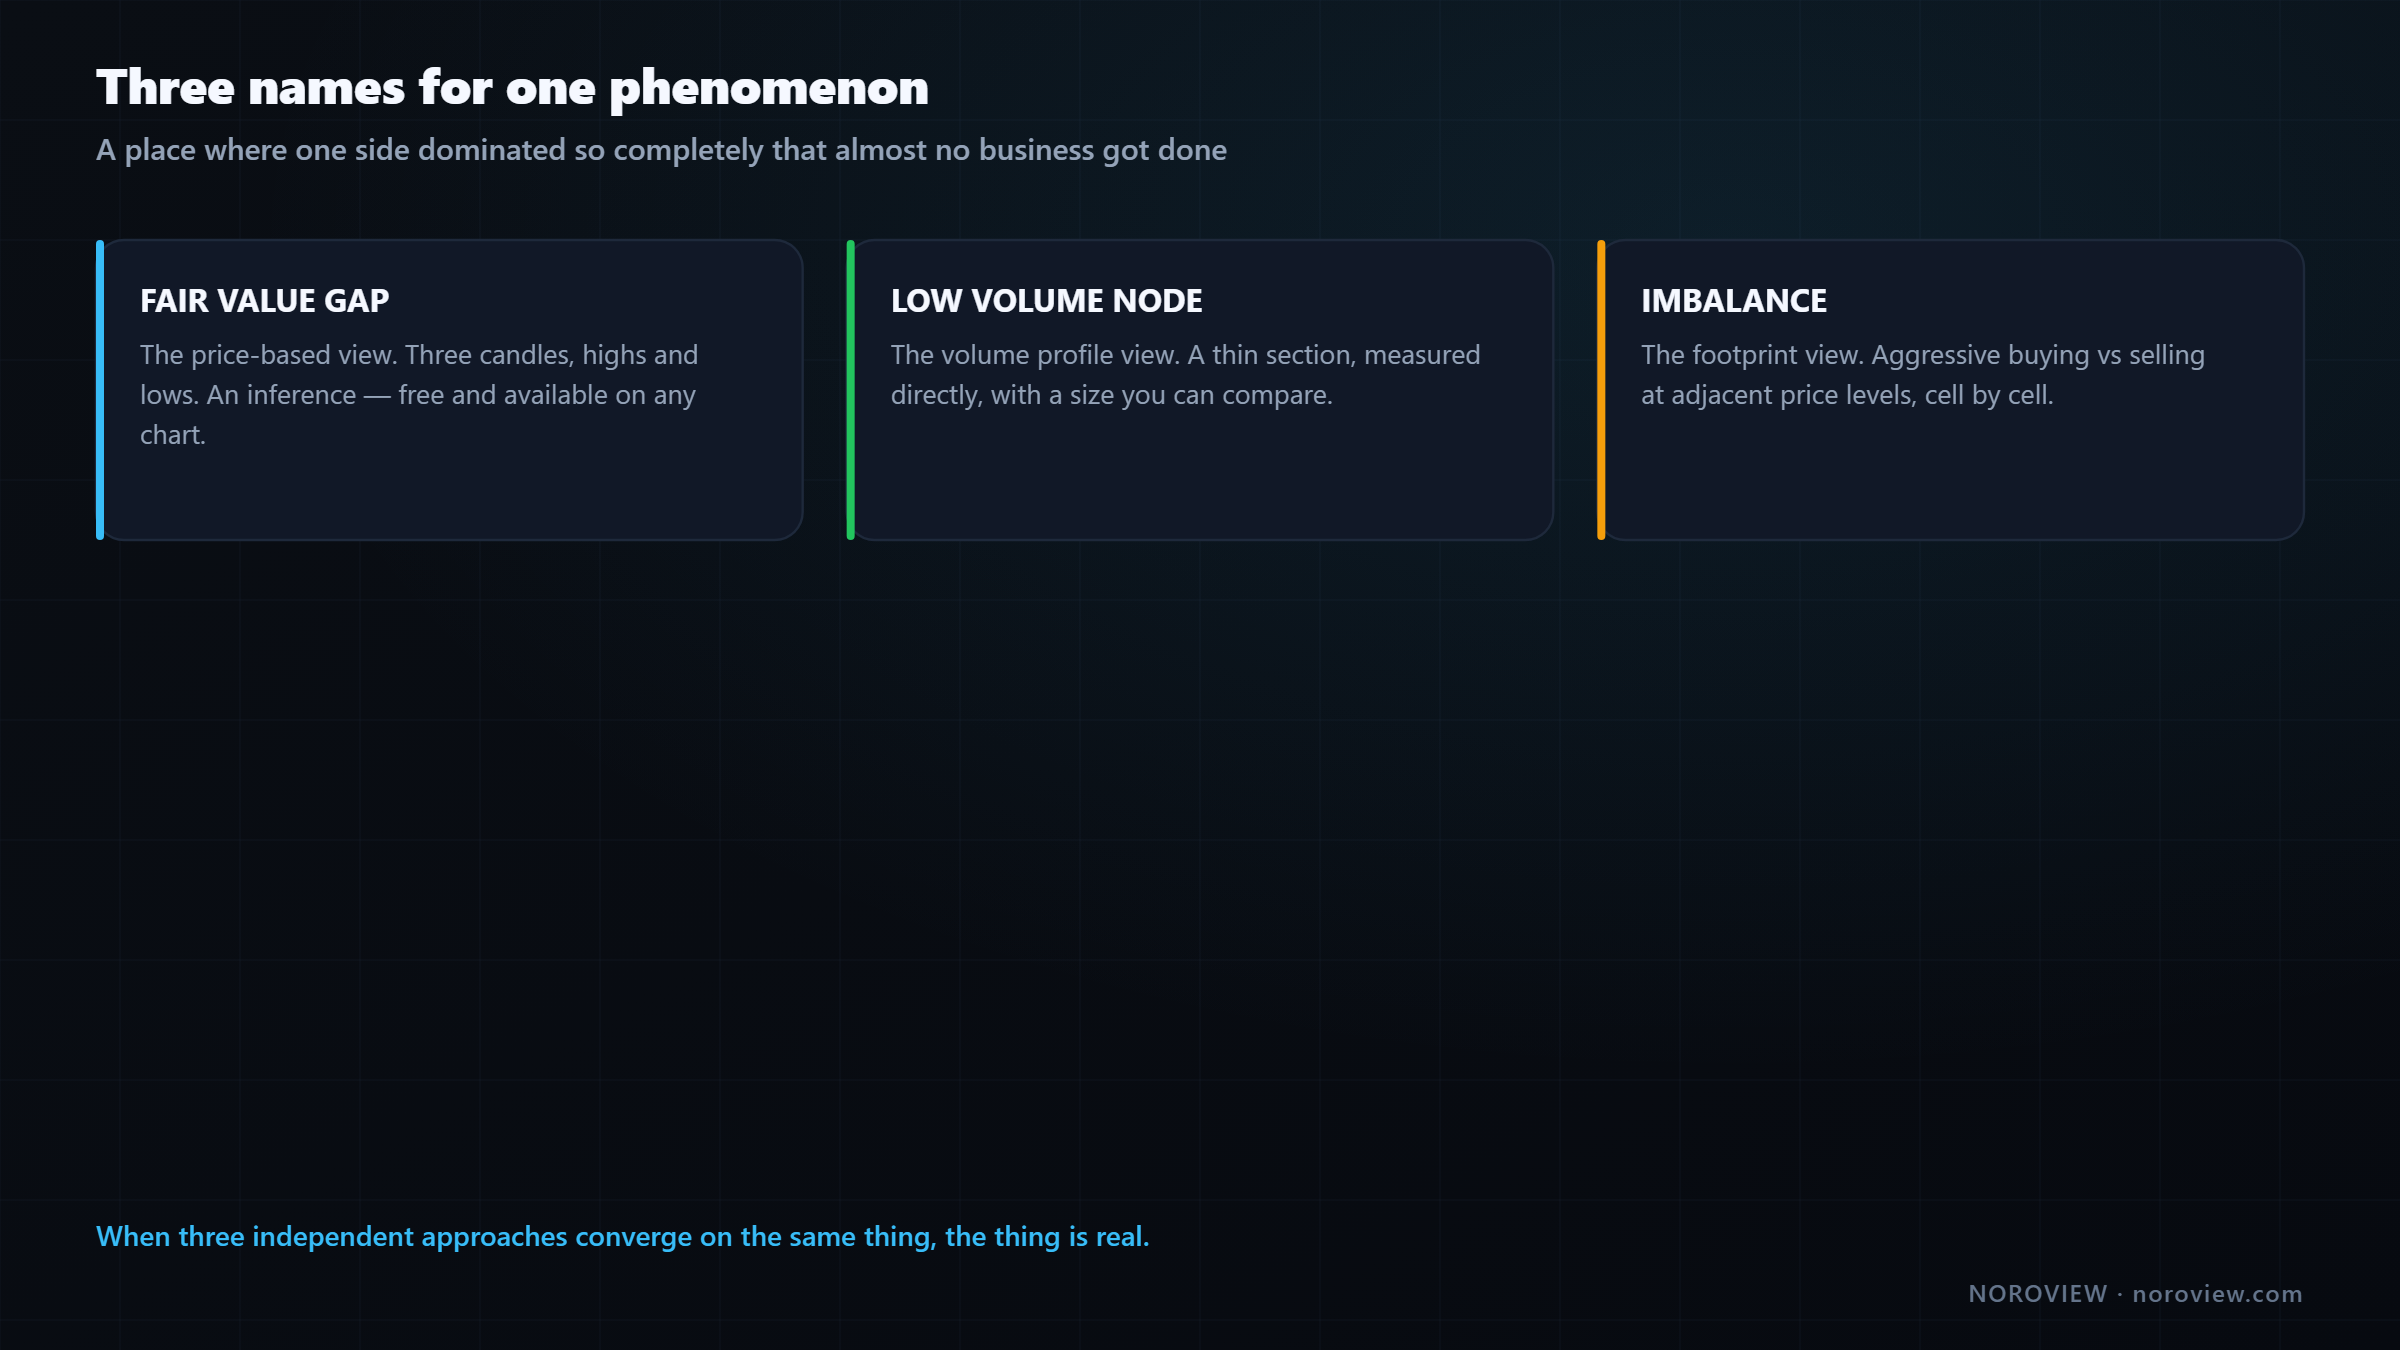
Three communities, three names, describing the same underlying event: a place where one side dominated so completely that almost no business got done. That is not a criticism of anybody's terminology — it is genuinely encouraging. When three different approaches independently converge on the same phenomenon, the phenomenon is real.
A gap is an inference. The footprint is a measurement.
This is the central point of the lesson, and everything practical comes out of it.
A fair value gap INFERS missing volume from the shape of three candles. Volume tools MEASURE it directly.
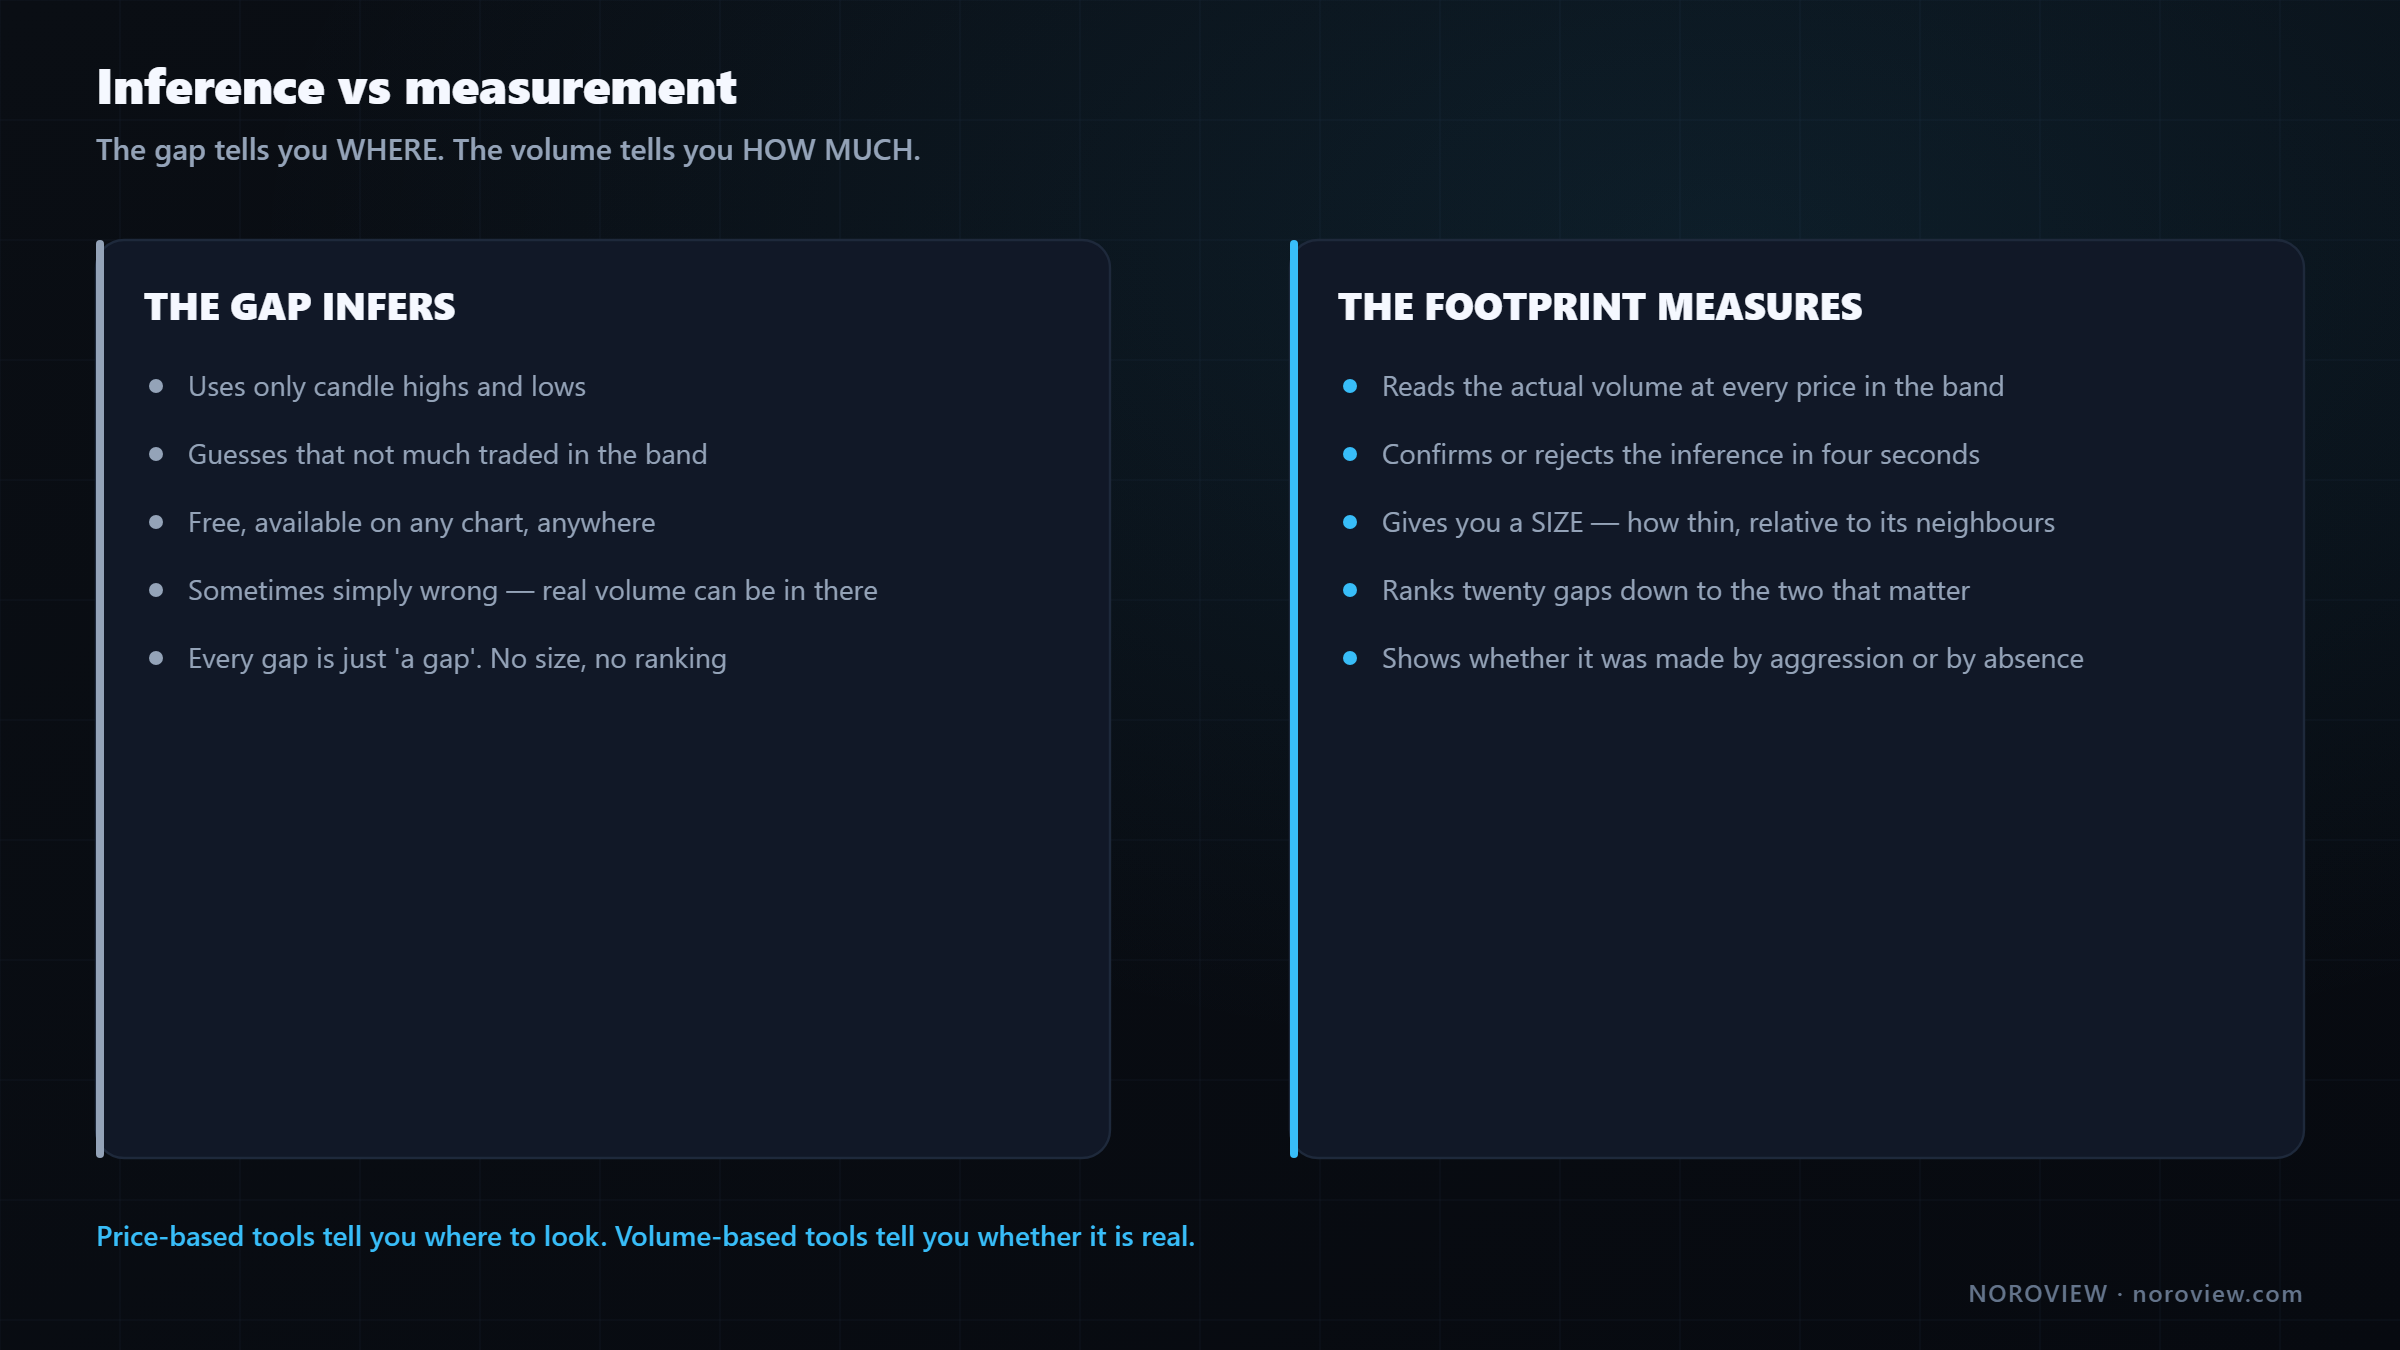
The three-candle definition uses candle highs and lows — price data only — to guess that not much traded in that band. It is a clever inference, available on any chart anywhere for free, which is why it is popular and deserves to be. But it is an inference. And you can just look.
Why does having the measurement matter, if the inference was right? Two reasons.
Reason 1 — sometimes the inference is simply wrong. You can get a three-candle gap where a meaningful amount of volume actually did trade in the band, because the middle candle traded through it heavily on its way. The gap definition never looks at volume, so it cannot know. On a volume tool you see immediately that the area is not thin at all — and that gap should be ignored.
Reason 2 — the measurement gives you a size. Every gap is "a gap." But some are genuinely empty and some are only slightly thin. Volume tools rank them for you, and that single fact takes you from twenty gaps on a chart to the two that matter.
The gap tells you WHERE. The volume tells you HOW MUCH.
Which is exactly the relationship the whole course is built on: price-based tools tell you where to look; volume-based tools tell you whether it is real.
Why price comes back
"Gaps get filled" is repeated constantly and rarely explained. There are three real mechanisms.
1. Unfinished business. The auction idea again. Price ran through a band without giving anybody a chance to transact. There are participants who wanted to buy in that range and never got the opportunity, and their interest is still there. The auction has a natural tendency to return and offer those prices properly.
2. No liquidity to stop it. When price approaches a thin area there is nothing to slow it down — no positions, no resting orders, no history. So price travels through gaps quickly. It is less that price is attracted to the gap and more that nothing resists it once it starts heading that way.
3. A lot of people are watching. Fair value gaps are extremely popular right now. Thousands of traders mark the same zones and place orders around them. That is genuinely self-fulfilling — and self-fulfilling is fine. Real orders at a real price is what a level has always been.
The trap hiding in reason three
If everybody sees the same zone, everybody's stop is in the same place.
If thousands of traders mark the same gap and put their stops just beyond it, then just beyond that gap there is a dense pool of stop orders. And as lesson 10 explained about poor highs and lows, that is exactly what a large participant who needs liquidity goes looking for.
So the popularity that makes gaps work is the same thing that makes them get run. That is not a contradiction — it is why you need confirmation rather than just a rectangle.
Why most of them fail
Mark every fair value gap you can find by the three-candle rule on a single session and you will get five or six. On a lower timeframe, dozens.
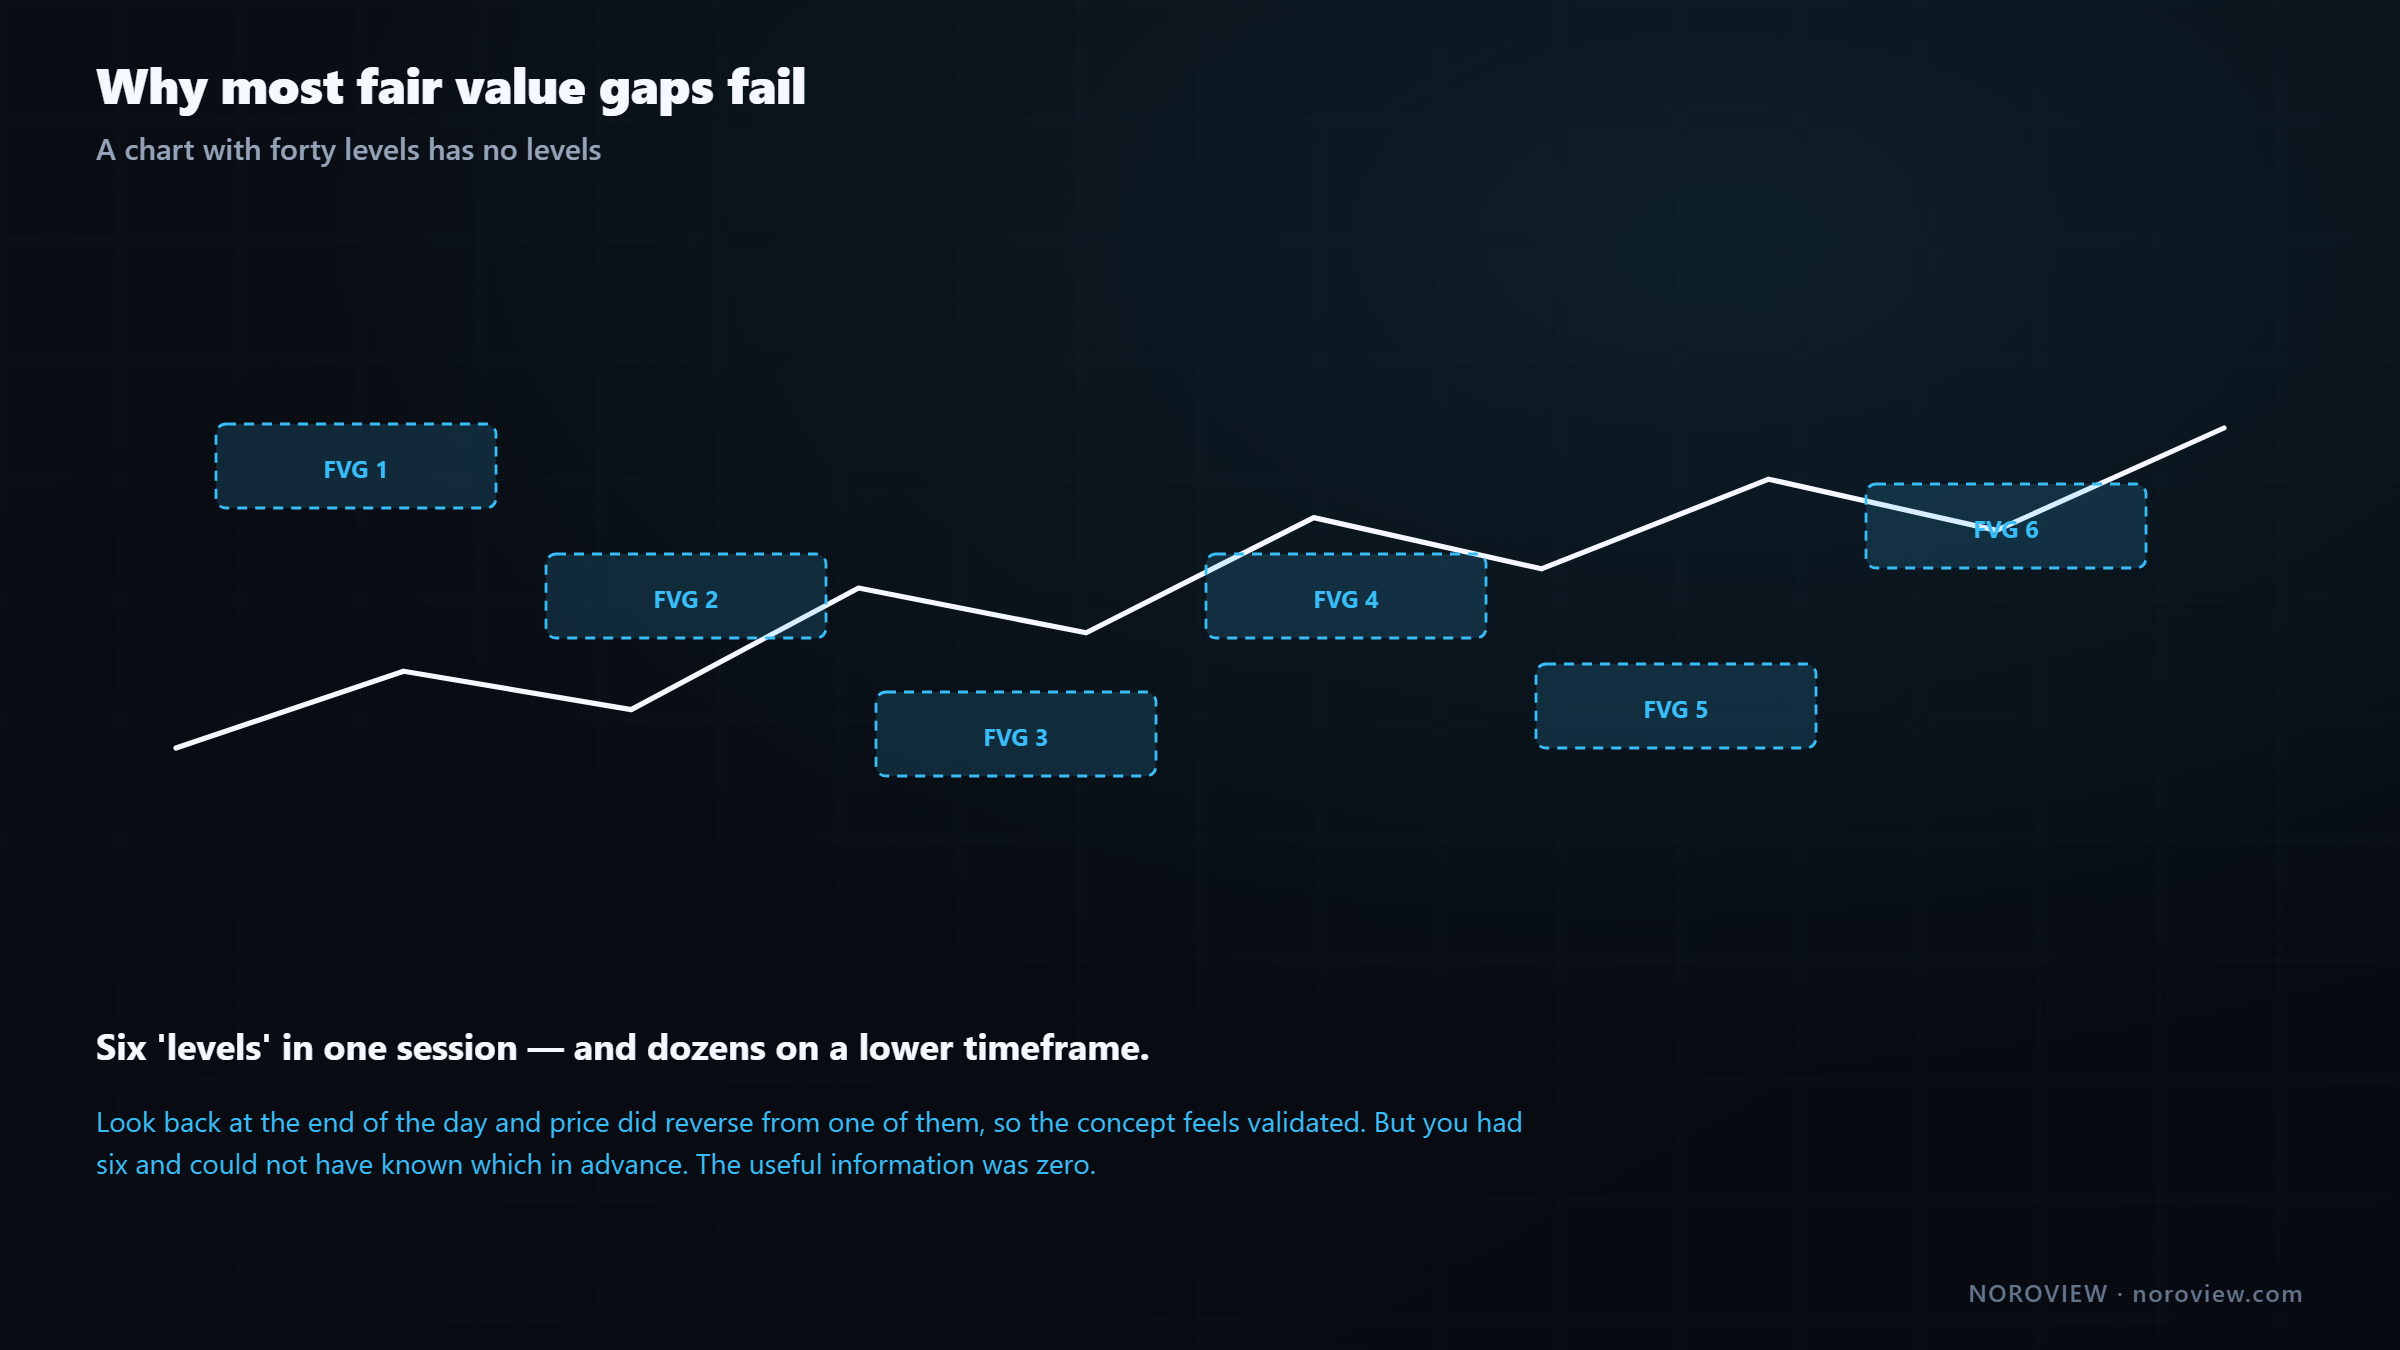
This is exactly the disease from lesson 6: a chart with forty levels has no levels. If you mark every gap, price is always near one, and "price is in a fair value gap" stops carrying any information.
And then something worse happens — the actual reason people conclude that FVGs do not work:
With enough gaps on the chart, there's always one that "worked."
You look back at the end of the day and price did reverse from one of them, so the concept feels validated. But you had six, and you could not have known which one in advance. The useful information was zero, even though one of them worked.
So the question is not "do fair value gaps work?" It is:
Which of these six is worth my attention — and can I tell BEFORE, not after?
Yes, you can. Using the volume data the previous twelve lessons taught you to read.
▶ Try this now
Find any fair value gap on your chart. Switch the chart type to Footprint, zoom in on both axes, and look inside the candle that created it. Was there heavy one-sided volume, or almost nothing? That single look is check 1, and it will change how you treat gaps permanently. Launch NOROVIEW free →
The five checks
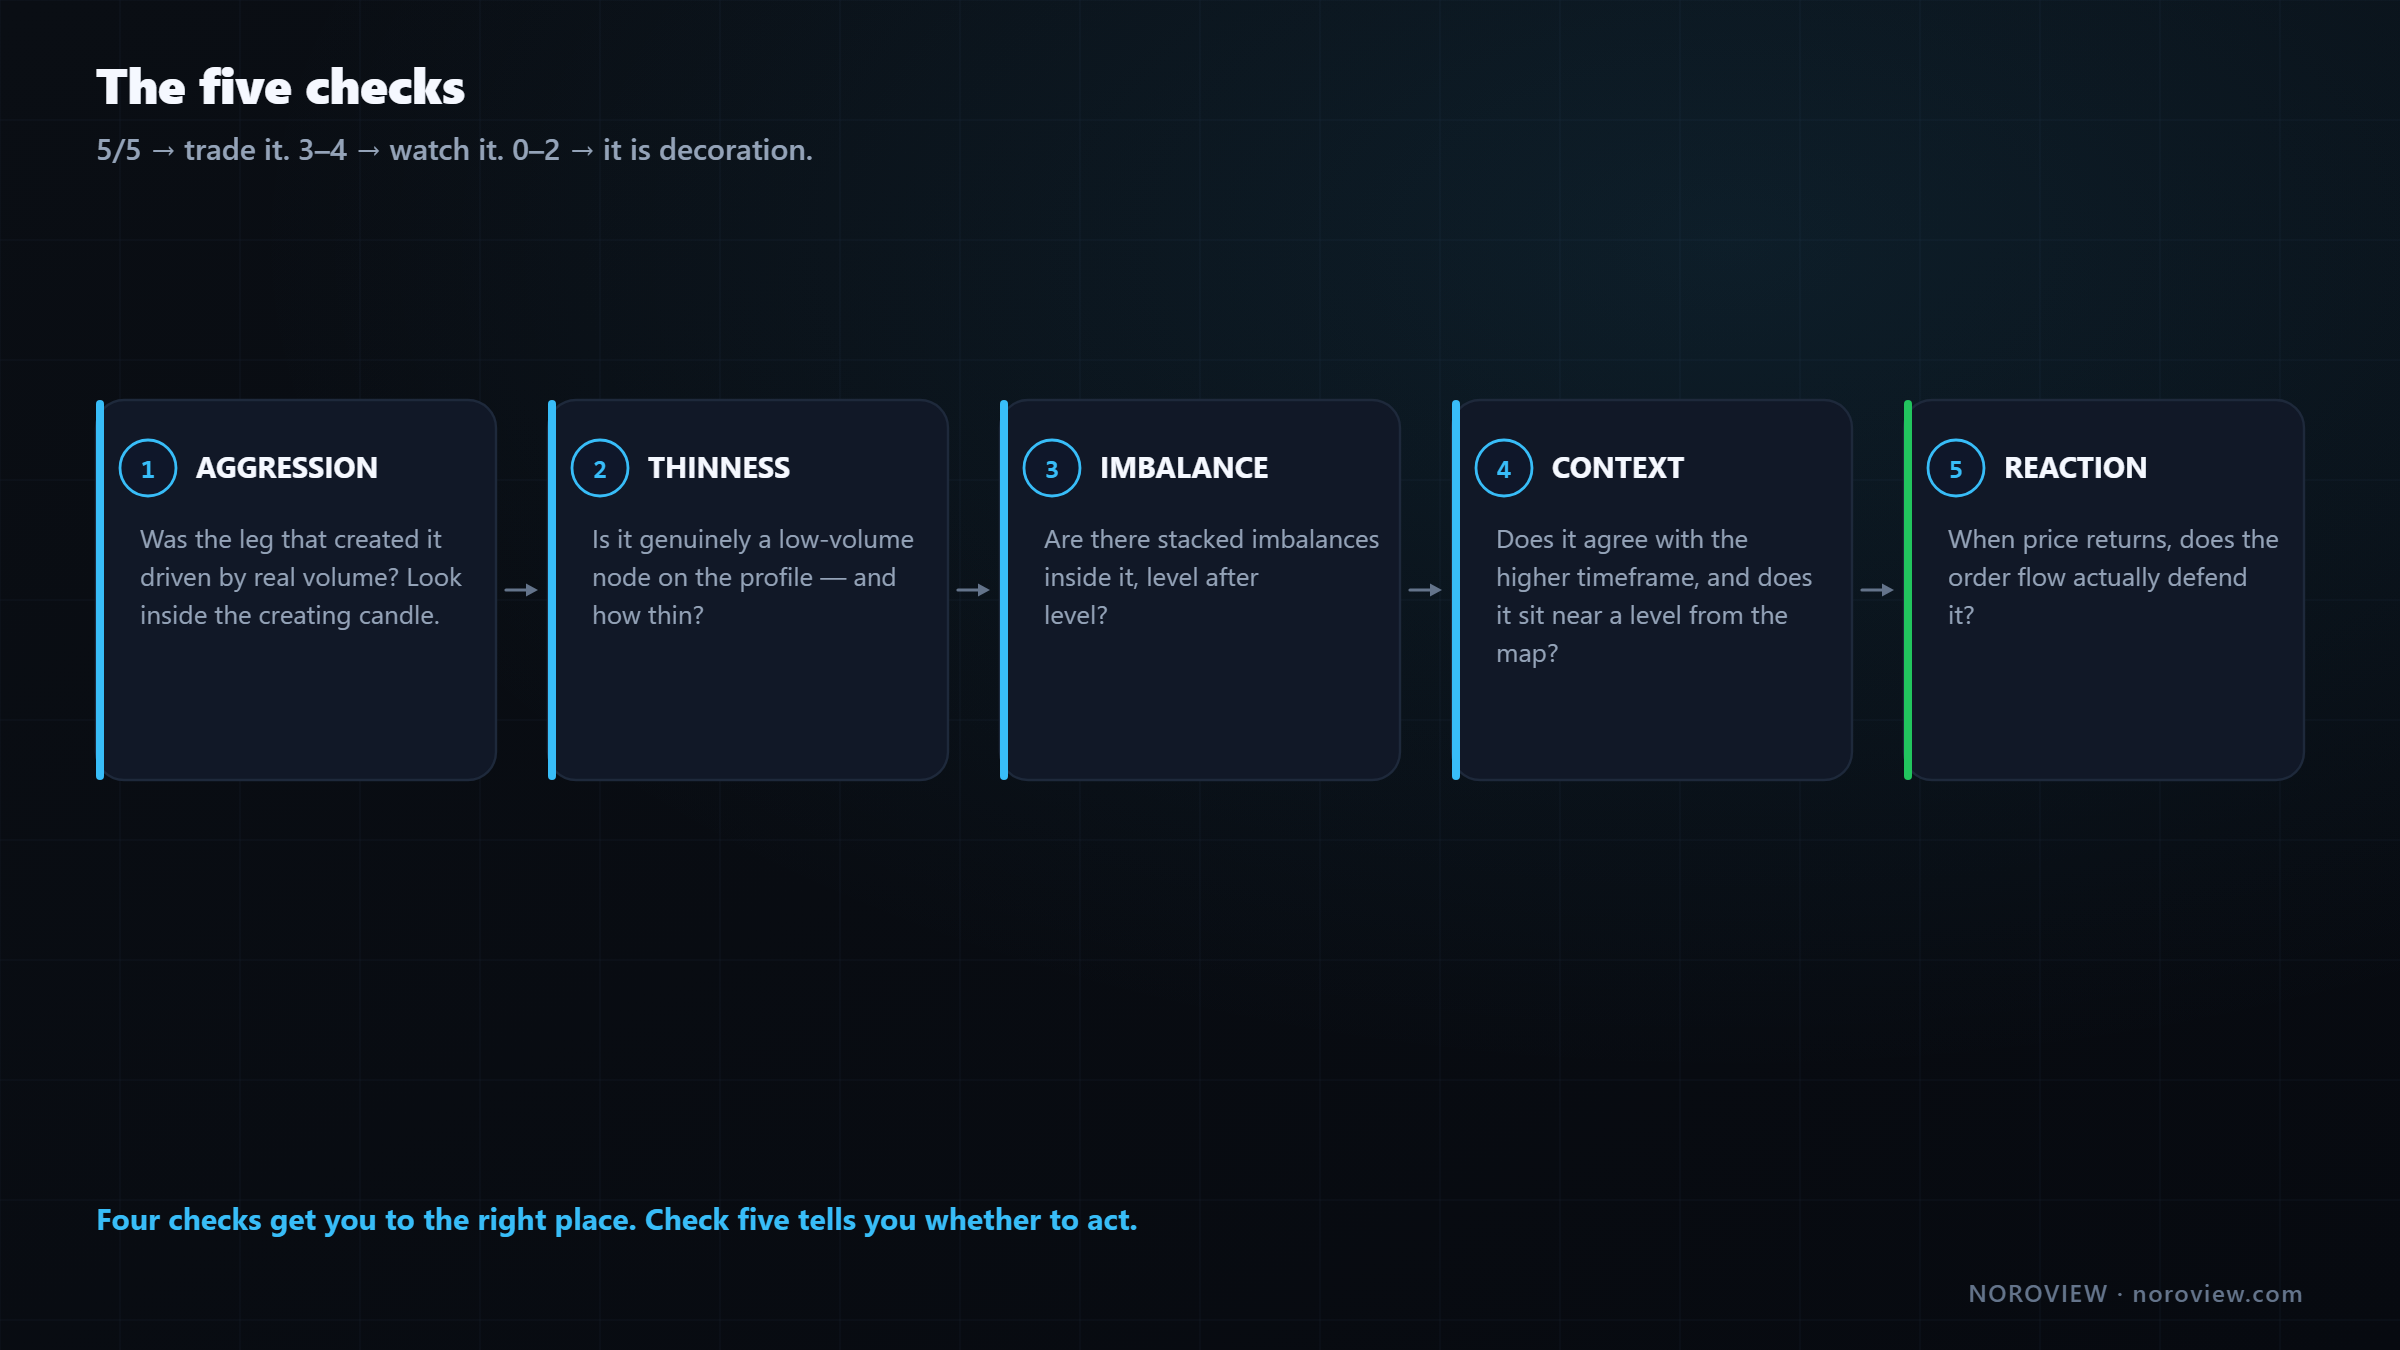
IS THIS GAP WORTH TRADING?

  1 · AGGRESSION   was the leg that created it driven by real volume?
  2 · THINNESS     is it genuinely a low-volume node?
  3 · IMBALANCE    are there stacked imbalances inside it?
  4 · CONTEXT      does it agree with the higher timeframe, and is it near a level?
  5 · REACTION     when price returns, does the order flow defend it?

  5/5 → trade it.   3–4 → watch it.   0–2 → it's decoration.
Check 1 — Aggression: was the move real?
The most important check, and it comes straight from lesson 3. Remember there are two ways price moves: aggression (somebody buying through the sellers) or absence (the sellers simply stepping out of the way).
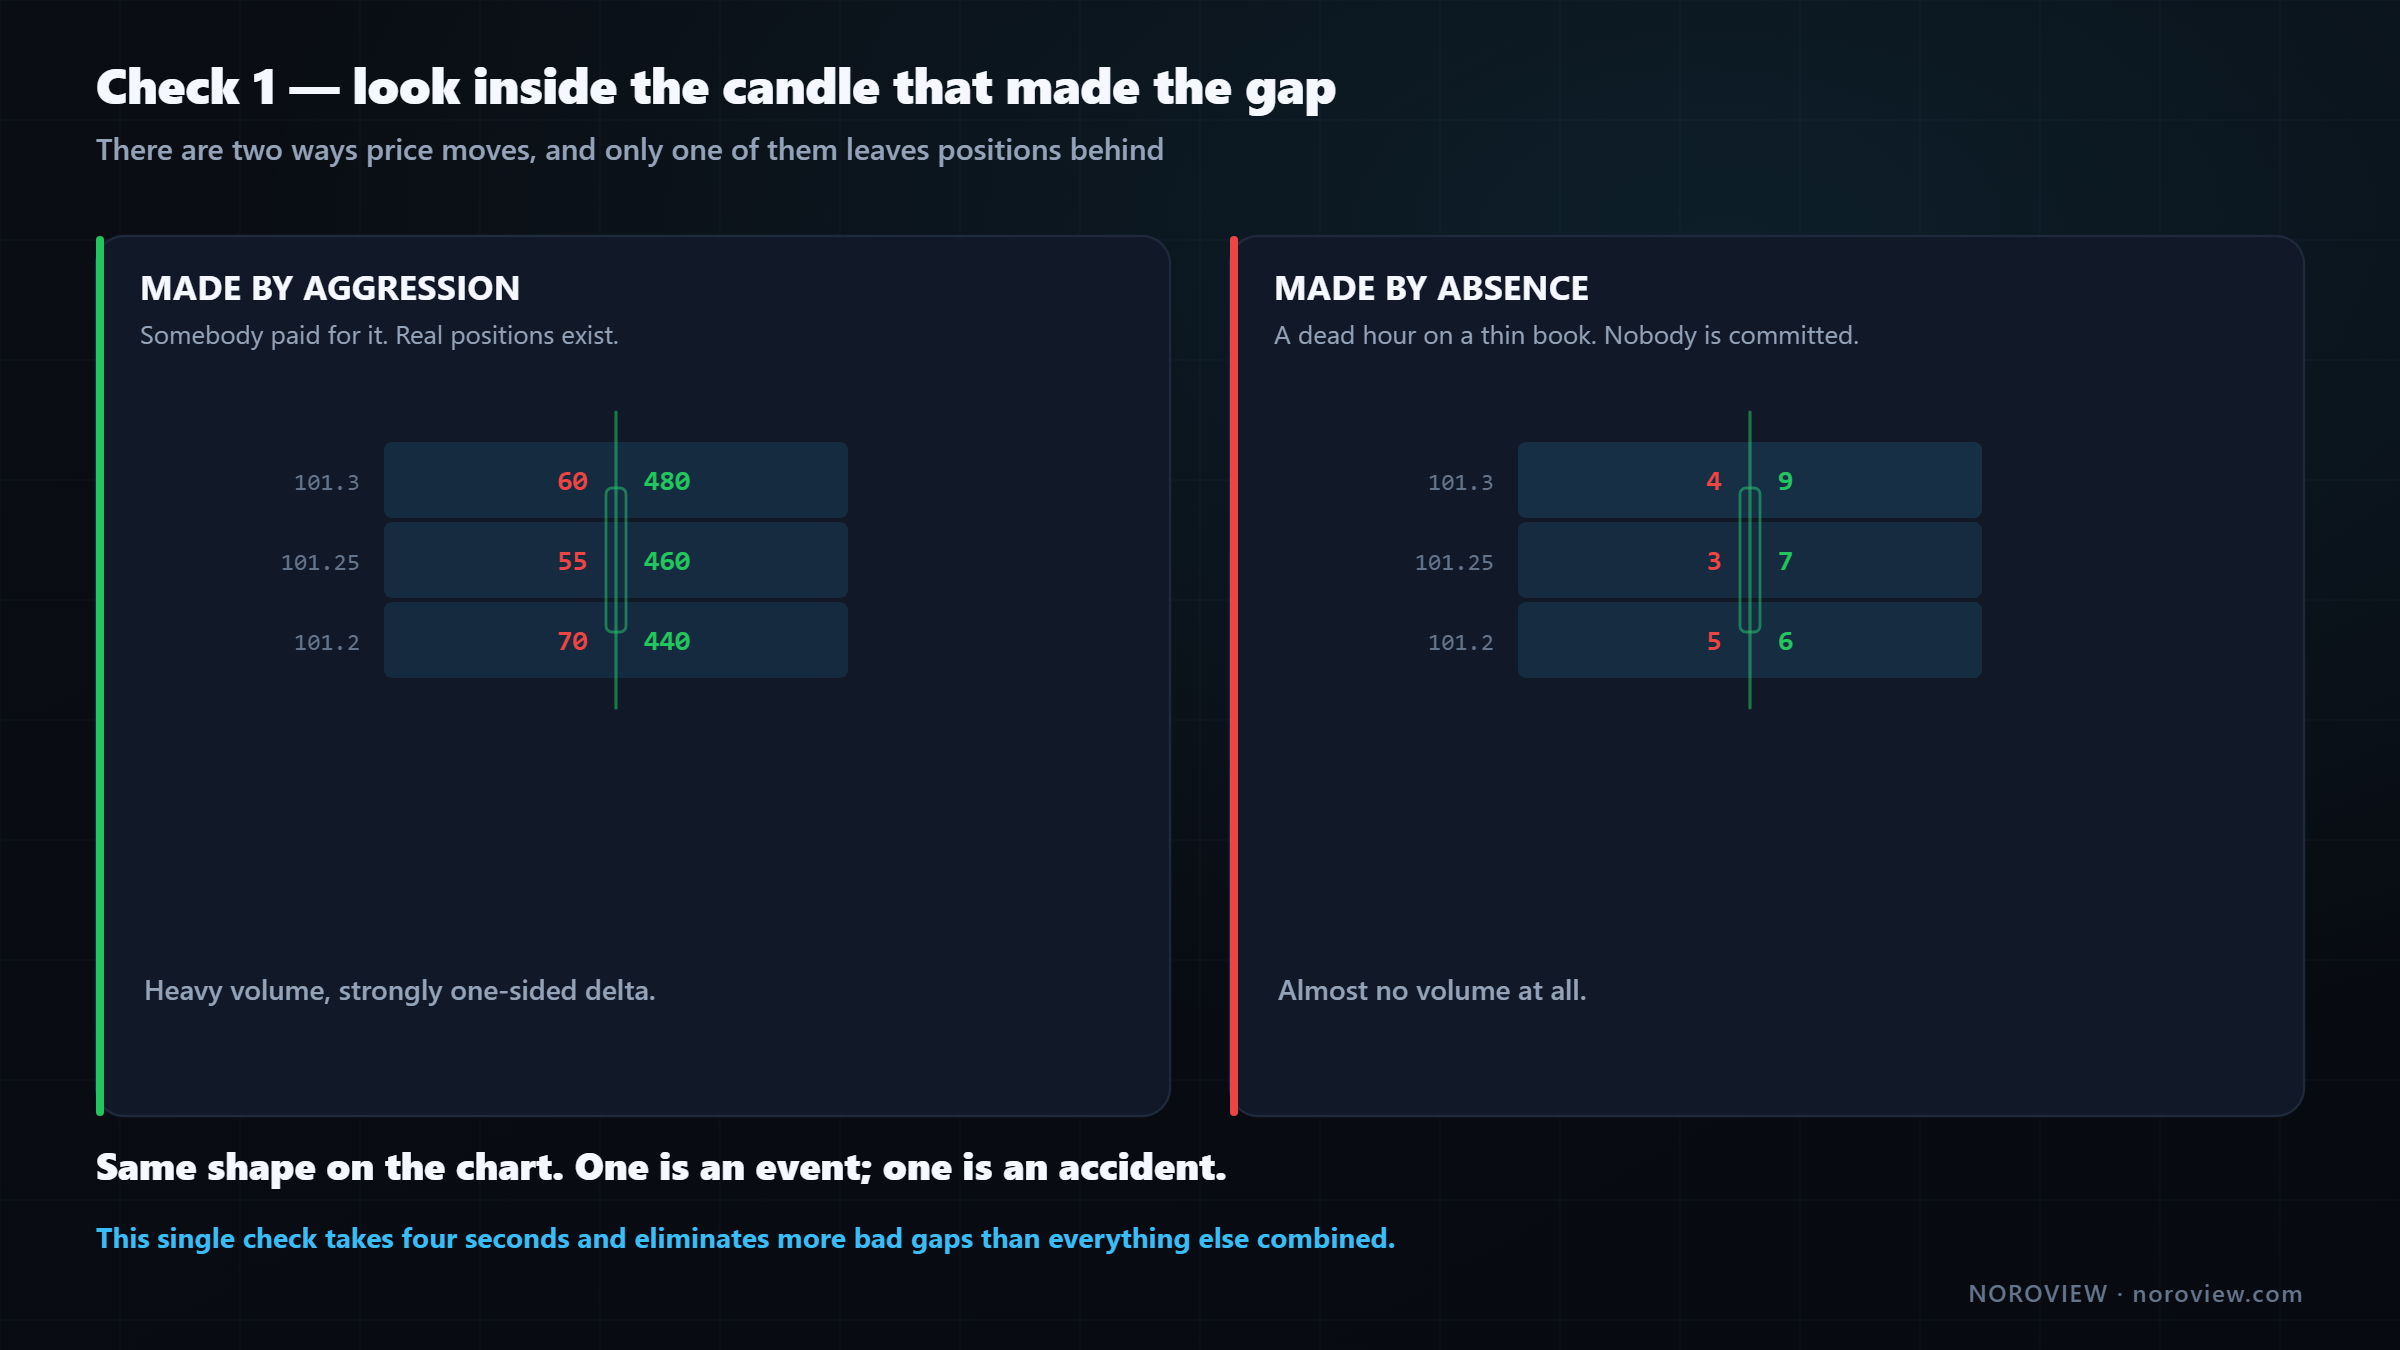
Gap made by AGGRESSION → somebody paid for it. Real positions exist. Gap made by ABSENCE → nobody paid for it. Nobody is committed.
Look inside the candle that created the gap. Heavy volume, strongly one-sided delta? That move was paid for. Real aggressive buyers spent real money and now hold positions from those prices — and if price comes back into that zone, those people have a reason to defend it.
Almost no volume? That happened in a dead hour on a thin book, where one ordinary order walked through empty levels. Nobody paid for that move and nobody has a position to defend, and price will slice back through it without pausing.
Same shape on the chart. One is an event. One is an accident.
That single check — look inside the candle that made the gap — will eliminate more bad gaps than everything else in this article combined. And it takes about four seconds.
Check 2 — Thinness: is it genuinely a low-volume node?
Confirm the inference. Is the gap actually a thin area on the volume profile?
If the profile isn't thin there, the gap is not what you think it is.
Sometimes it is not: the middle candle traded through heavily and there is real volume in that band. On the chart it looks like a gap; on the profile it is ordinary. Ignore it.
When the answer is yes, you also get the size — how thin, and how thin relative to the areas around it. The thinnest gap on your chart is the one to keep. The rest come off.
Check 3 — Imbalance: is there stacked one-sided aggression inside it?
The footprint-level version of the same question. Inside the gap, are there stacked imbalances — several consecutive price levels where one side massively outweighed the other?
Stacked imbalances inside a gap = the gap was created by real one-sided aggression.
If yes, the gap has structure. It was not just fast — it was fast because one side was overwhelming, level after level. Much stronger zone. And since stacked imbalance zones become support and resistance in their own right, a gap with stacked imbalances inside it is really two independent pieces of evidence pointing at the same band.
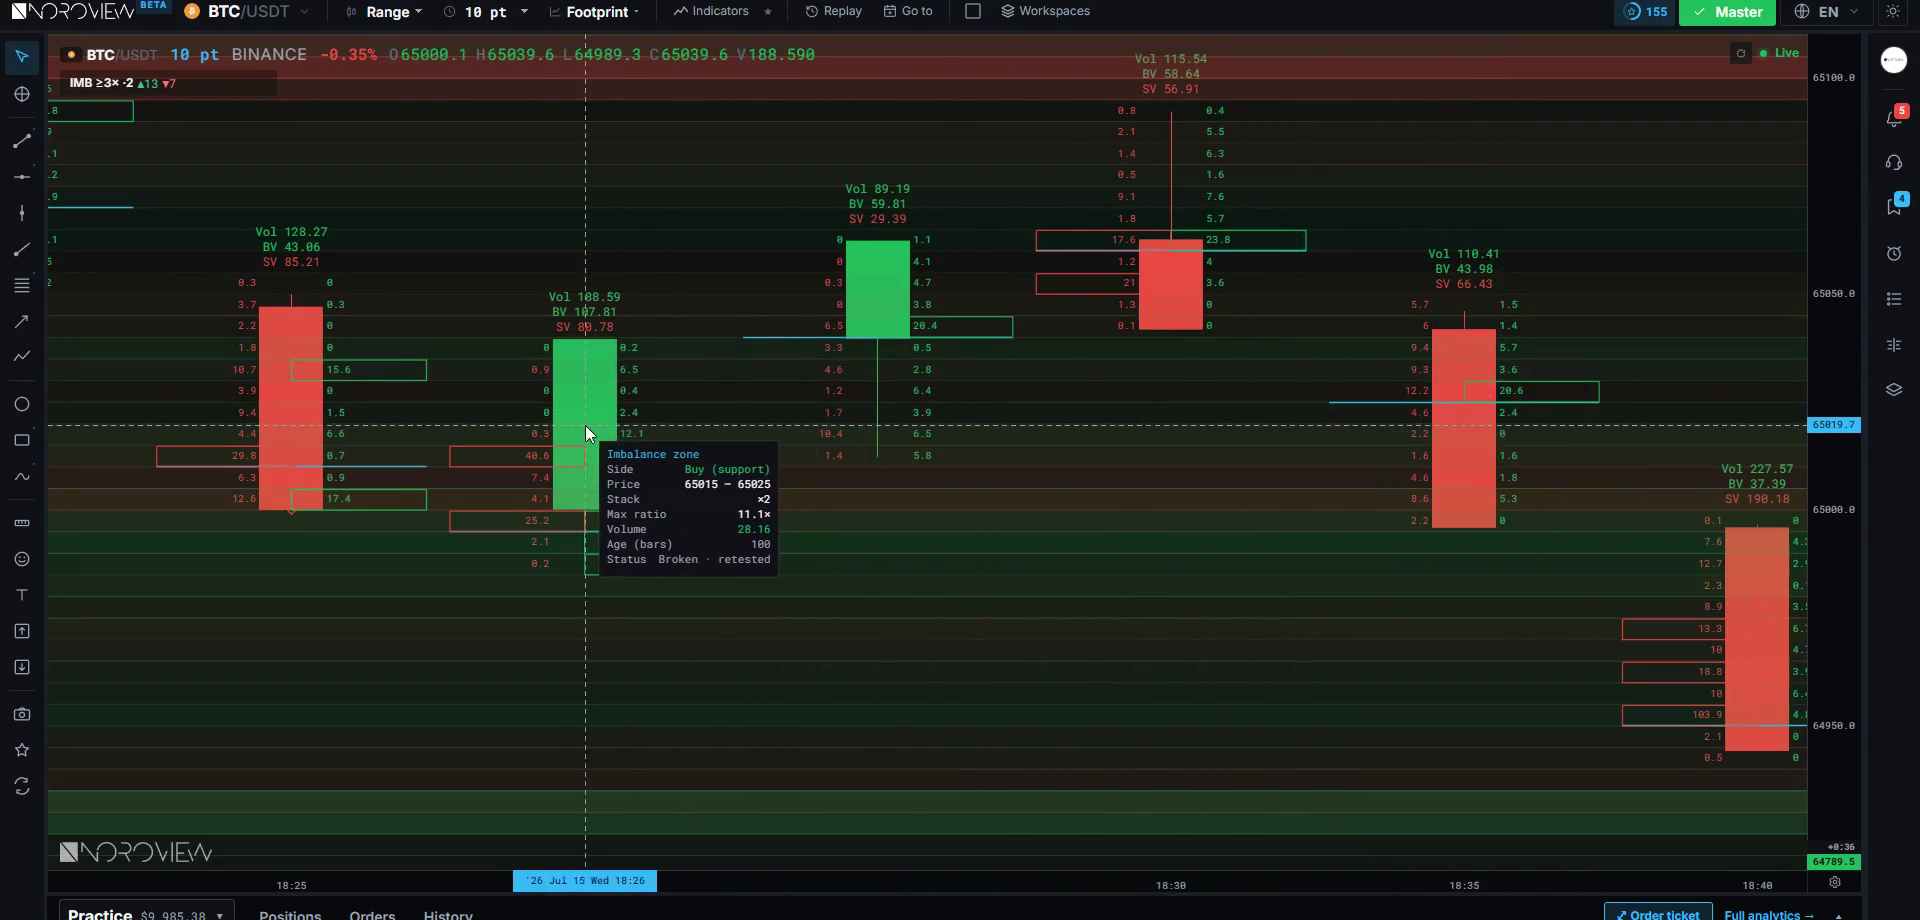
(The Imbalance detector is a paid indicator and ships strict — it will often show nothing until you loosen the volume floor and the required stack. That is not a bug.)
Check 4 — Context: does it agree, and is it near anything?
Two questions:
- Does trading this gap agree with the higher timeframe? A bullish gap in a daily uptrend is a with-trend pullback entry. A bullish gap in a daily downtrend is a counter-trend trade with a rectangle on it, and it needs far more evidence and less size.
- Is the gap near a level from your map? This is the one that upgrades everything. A gap sitting on top of a high-ATS level, or at a value-area edge, or on an automatic support level, is not one piece of evidence — it is two or three independent methods pointing at the same price.
A gap alone is a rectangle. A gap ON a level is a location.
Check 5 — Reaction: what happens when price actually returns?
The final check cannot be done in advance. It happens in real time, and it is the whole reason you learned footprints.
Price is back in the gap. Now, exactly as in lesson 11, ask one question: is anybody defending this?
What you want to see at the gap: absorption, elevated average trade size, delta that stops making progress against you — and then the trigger candle, a failure to make a new extreme closing in the right third of its range.
If price enters the gap and the order flow shows nothing — no absorption, no size, delta continuing smoothly in the same direction — the gap is not being defended. Let it go and wait for the next location.
Four checks get you to the right place. Check five tells you whether to act.
Confirm the gap before you commit to it
Footprint charts are free on every NOROVIEW plan — which is all you need for check 1, the check that eliminates most bad gaps. Create a free account → · Compare plans
Which part of the gap do you use?
People argue about this a lot. The three conventional answers are the near edge (first touch), the midpoint, and the far edge (a complete fill).
My honest position is that these are conventions, not laws. There is no mechanical reason the midpoint of a three-candle gap should be special. Ask ten traders and you will get three answers, all delivered with confidence.
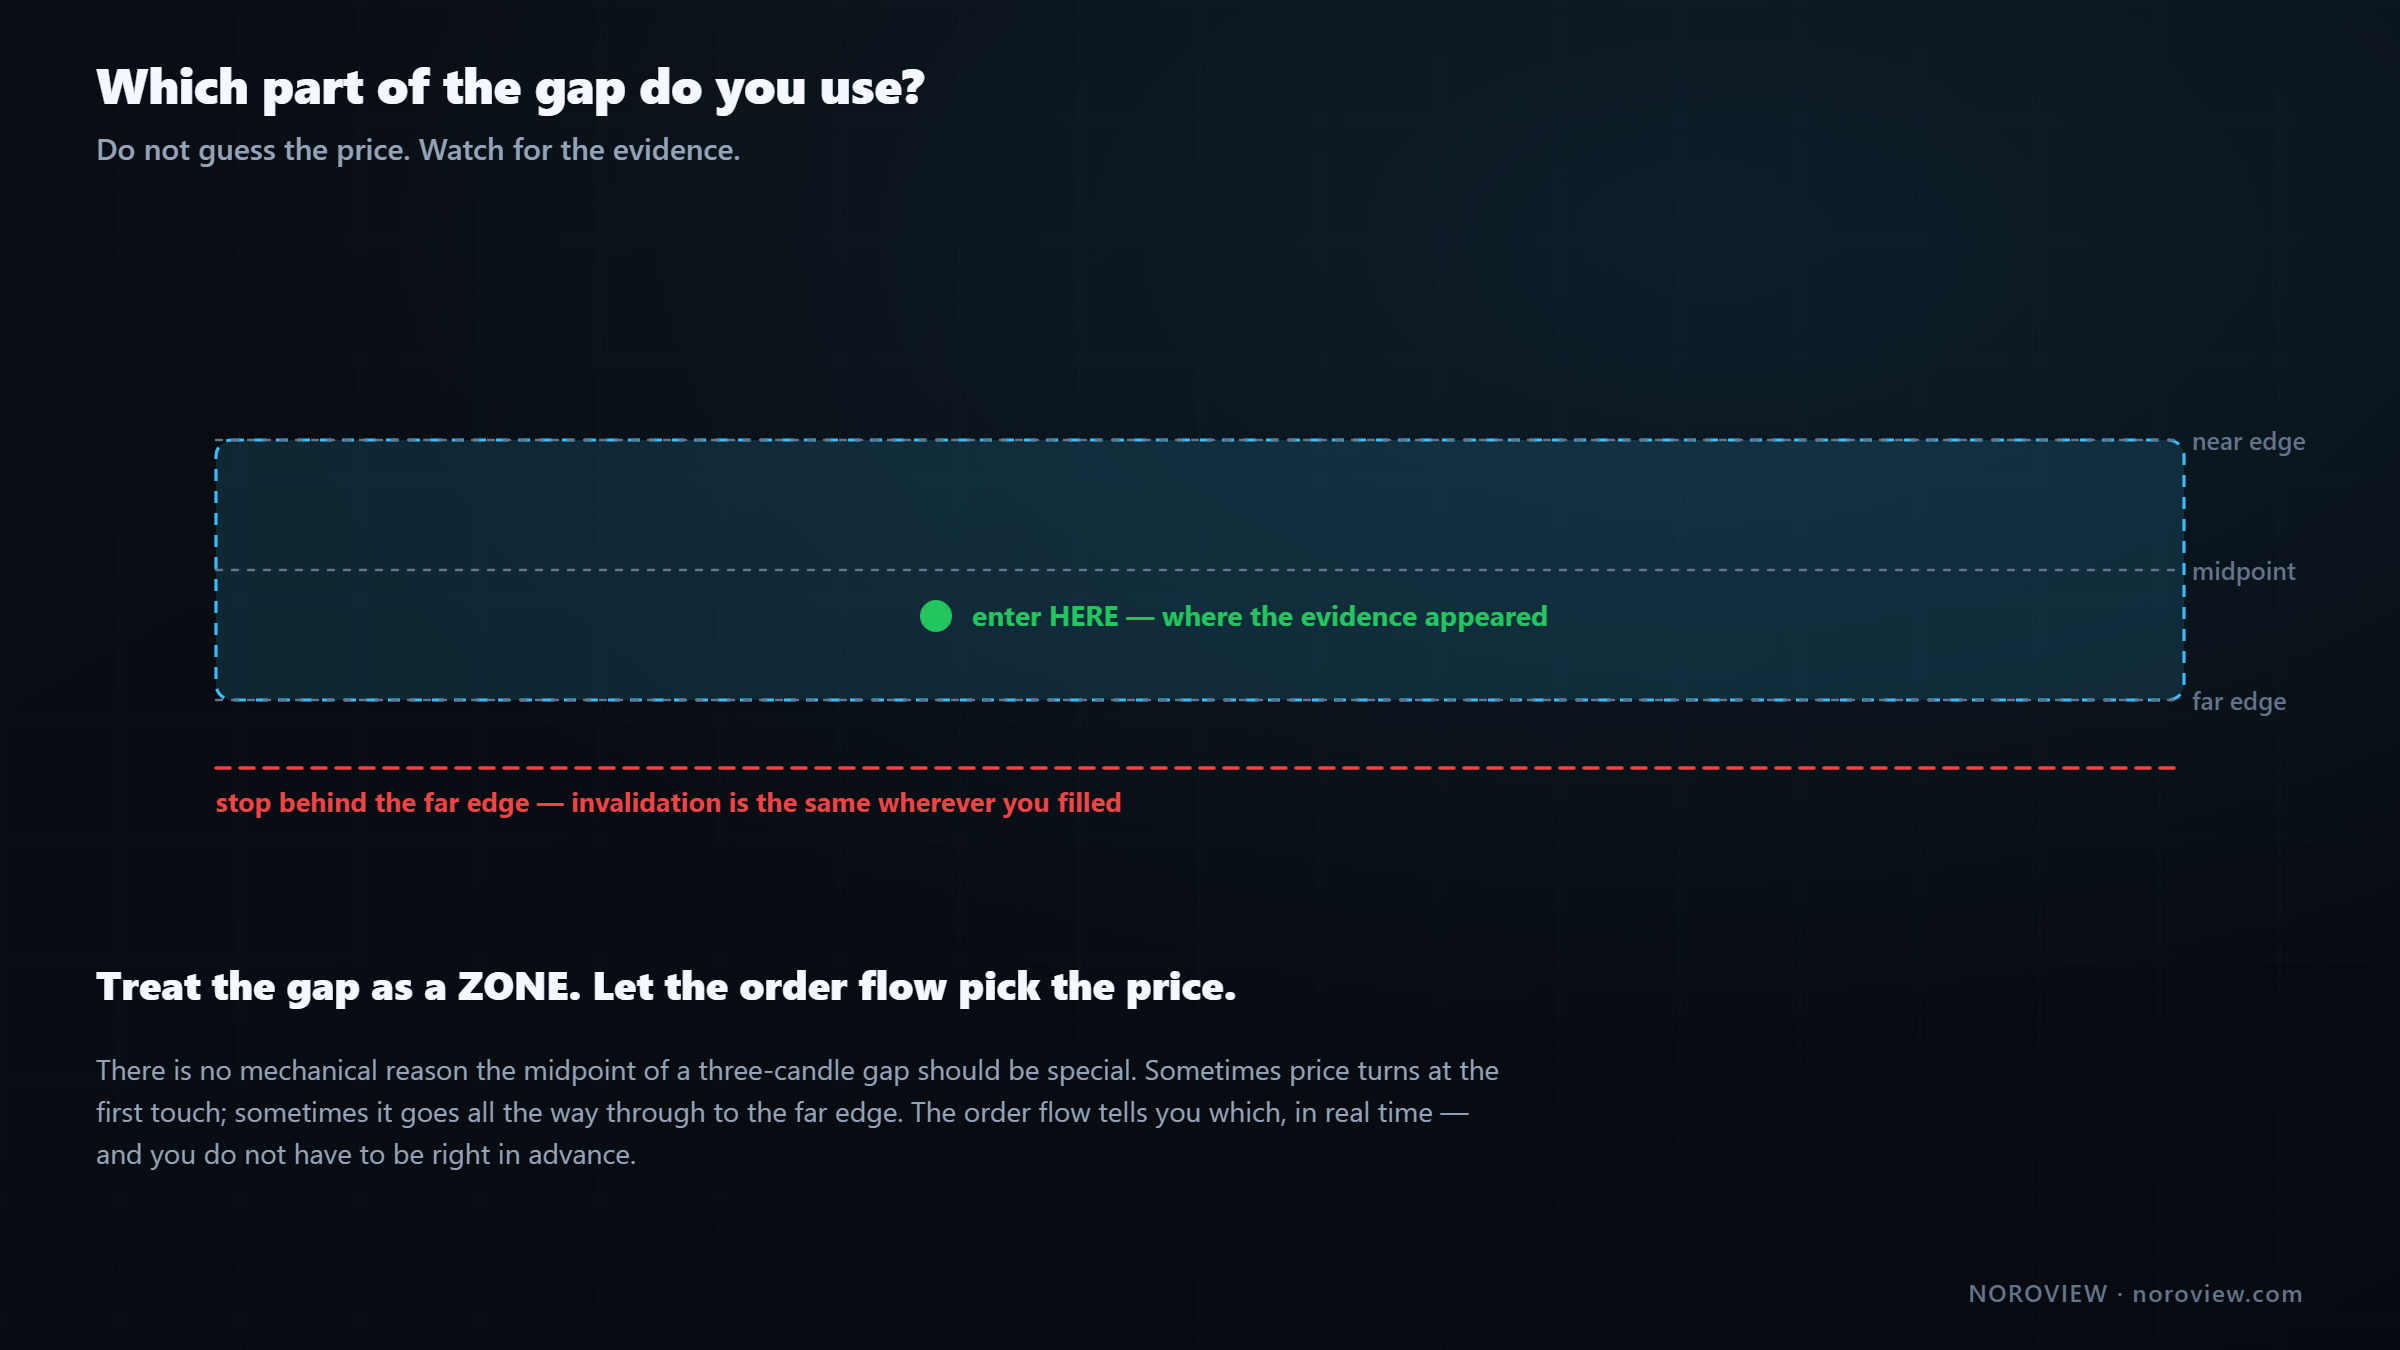
Treat the gap as a ZONE. Let the order flow pick the price.
Mark the whole gap as a zone. Do not pre-commit to a price inside it. Then watch the footprint as price moves through the zone and enter where the evidence appears — wherever absorption and size actually show up. Sometimes that is at the first touch; sometimes price goes all the way through to the far edge and turns there. The order flow tells you which, in real time, and you do not have to be right in advance.
Don't guess the price. Watch for the evidence.
There is a practical bonus: your stop goes behind the far edge of the zone. So whichever price you actually enter at, the invalidation is the same and it is structural. If price goes fully through the gap and out the other side, the zone did not hold and the idea is dead.
When a gap fails: inversion
Same principle as broken levels in lesson 9.
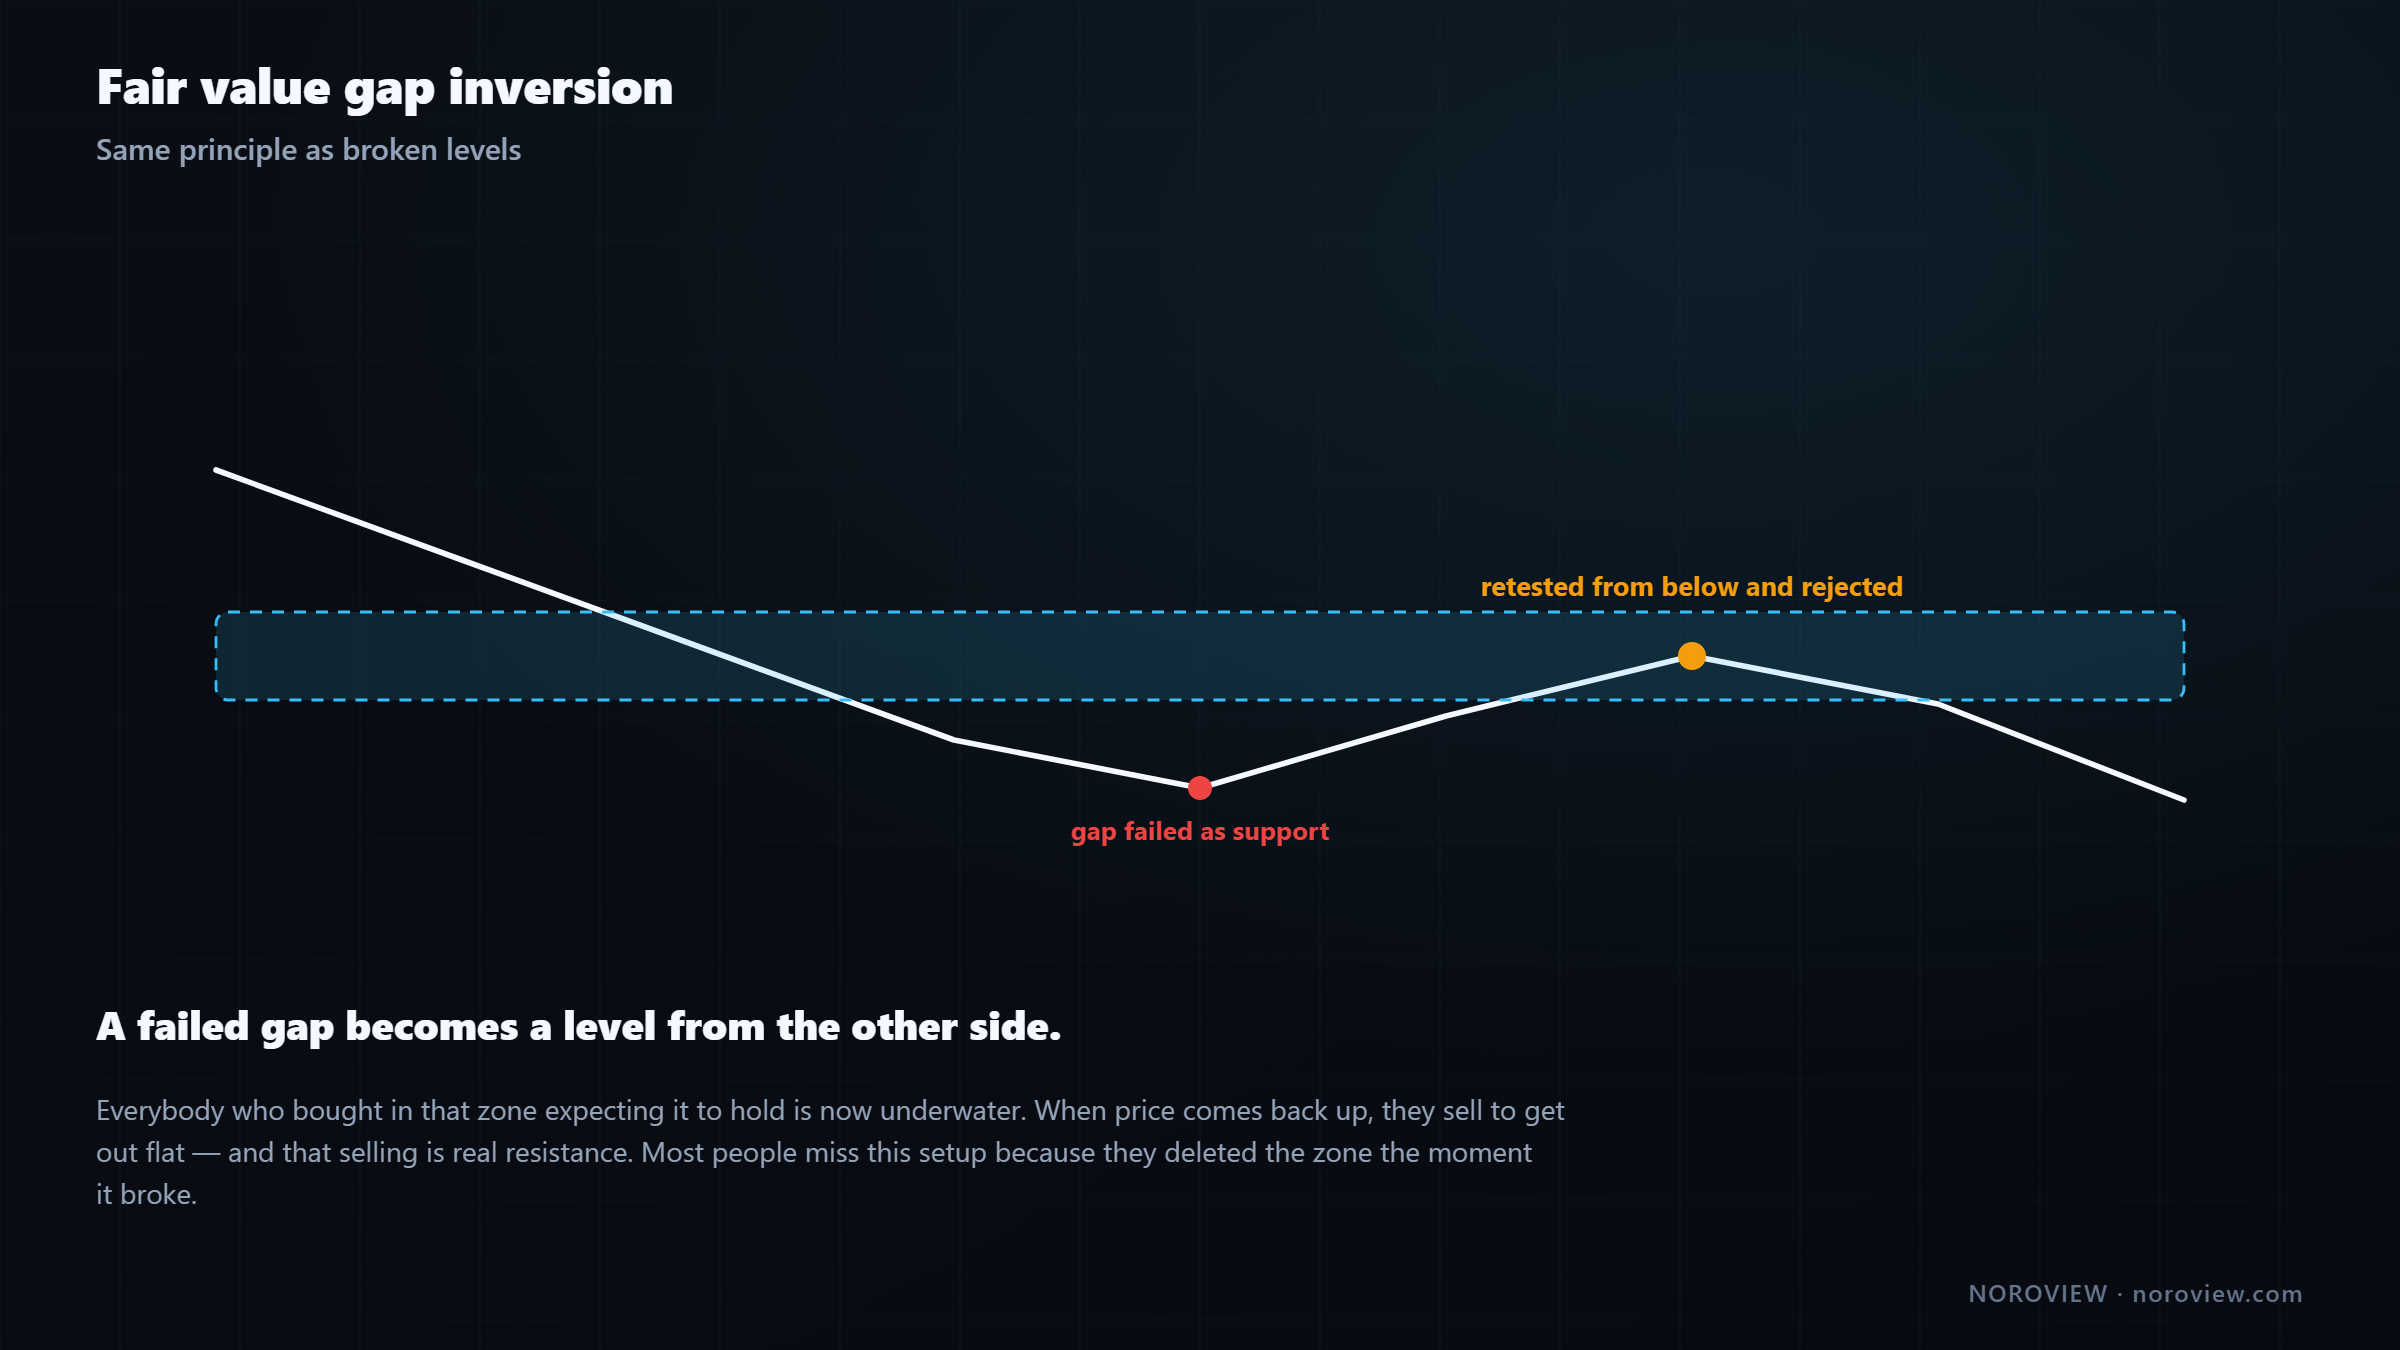
When price goes fully through a gap and out the other side, that gap has failed as support. But it does not become irrelevant.
A failed gap becomes a level from the other side.
The mechanism is the one we keep returning to: everybody who bought in that zone expecting it to hold is now underwater. When price comes back up to it, those people sell to get out flat — and that selling is real resistance.
So keep failed gaps on the chart, faded. The same five checks apply to trading it from the other side, especially check five. A failed gap being retested with absorption against it is a clean setup, and it is one most people miss because they deleted the zone the moment it broke.
Folding it into the entry model
Do not walk away from this with a separate "FVG strategy." Nothing changes:
1 · LEVEL       ← a qualified fair value gap counts as a level
2 · CONTEXT       higher timeframe agrees
3 · EVIDENCE      order flow at the gap
4 · TRIGGER       the candle that confirms
5 · BLOCKERS      none present
6 · RISK          stop behind the far edge of the gap
7 · PLAN          exits decided before entry
A fair value gap that passes the first four checks is simply another level in the map from lesson 6. It goes into the same model, gets the same evidence requirement, the same trigger, the same blocker list, and the same risk process.
One model. Many kinds of level. That's the whole point.
That is what makes this a method rather than a collection of tricks. You are not learning ten strategies — you are learning one process, and everything you add (volume profile, VWAP, ATS levels, gaps) is a new way of finding the location. The decision procedure never changes.
And if you came to this course already trading ICT concepts or price action: this is the upgrade. You already know how to find these locations, probably better than one article could teach. What you now have is a way to tell, before you commit, which of them the market is actually defending. It is not a replacement for what you do. It is a filter on it.
Common mistakes
- Marking every gap on the chart. Six gaps in one session means zero gaps.
- Skipping check 1. Looking inside the creating candle takes four seconds and removes most bad gaps.
- Assuming the three-candle inference is always right. Sometimes real volume traded in that band.
- Pre-committing to the midpoint as though it were a physical property of the market.
- Trading a gap with no level near it. A rectangle is not a location.
- Deleting failed gaps. Inversion is one of the cleanest setups available.
- Forgetting that everyone's stop is in the same place just beyond the popular zone.
Your homework
About an hour.
- Mark every gap in one recent session, then run checks 1 and 2 on each and delete the ones that fail. Count how many survive. It is usually one or two.
- Find one gap created by aggression and one created by absence with the same shape on the price chart, and screenshot both footprints side by side.
- Find one inverted gap — a gap that failed and later acted as a level from the other side — and mark what the order flow did on the retest.
Open the terminal and audit your gaps →
Three things to remember
- A fair value gap infers missing volume; a footprint measures it. The gap tells you where, the volume tells you how much.
- Check 1 is the whole lesson. Look inside the candle that created the gap. Aggression means real positions exist; absence means nobody is committed.
- A qualified gap is just another level in the same entry model. One process, many kinds of location.
← Previous: Cumulative Volume Delta (CVD) · Course index: Order Flow Trading Course · Next → Day Trading Risk Management and Psychology
Frequently asked questions
What is a fair value gap? A fair value gap is a three-candle formation where the high of the first candle sits below the low of the third (or the reverse for a bearish gap), leaving a band of prices that was crossed so quickly almost no two-way business took place there. It is a price-based way of inferring missing volume.
Do fair value gaps always get filled? No. Many are never revisited, and many are crossed without any reaction at all. Gaps created by genuine aggressive volume are far more likely to produce a reaction on return than gaps created by an empty order book in a quiet hour, which is why the creating candle matters more than the shape.
Why do fair value gaps fail? Usually because they were created by absence rather than aggression — nobody actually paid for that move, so no positions exist there to defend it. They also fail when too many are marked at once, because "price is in a gap" then carries no information.
How do you confirm a fair value gap with order flow? Look inside the candle that created it for heavy one-sided volume, confirm the band is genuinely thin on a volume profile, check for stacked imbalances inside it, verify it sits near an existing level and agrees with higher-timeframe context, and then require absorption and a trigger candle when price returns.
Which part of the fair value gap should you enter at? Treat the whole gap as a zone rather than committing to the near edge, midpoint or far edge in advance. Enter wherever the order flow shows evidence of defence, and place the stop behind the far edge so the invalidation is the same regardless of where you filled.
What is fair value gap inversion? Inversion is when price trades fully through a gap and out the other side, after which the gap tends to act as a level from the opposite direction. Everyone who positioned inside the zone is offside and exits at break-even, which creates genuine resistance or support on the retest.
What is the difference between a fair value gap and an imbalance? They describe the same phenomenon at different resolutions. A fair value gap is defined by the highs and lows of three candles; an imbalance is defined by comparing aggressive buying and selling at adjacent price levels inside the footprint. The footprint version is a measurement rather than an inference.
Sources
- CME Group Education — auction market theory
- Investopedia — price gaps
Soroosh Moghimi — six years inside financial markets: algorithmic trading, HFT, crypto and AI, after a decade building startups. He publishes this course free because he already paid for the lessons in it. There is no paid course and no signal group. @sorooshmoghimi · About
Start reading real order flow
You cannot learn this from a candlestick chart, and you do not need to spend a cent to begin. The standard footprint chart is free for every NOROVIEW user, market replay is free, and the paper-trading simulator is free.
Open NOROVIEW free → · Compare plans →
⚠️ DISCLAIMER — EDUCATIONAL CONTENT ONLY
This article is for educational and informational purposes only. It is not financial, investment, or trading advice, and nothing in it is a recommendation to buy, sell, or hold any asset. Trading cryptocurrencies and leveraged derivatives is high risk and can result in the loss of some or all of your capital. Only risk money you can afford to lose. Any levels, indicators, signals or results shown are illustrative and are not a promise or prediction of future performance. Charts may be shown on a demo or paper-trading account and do not represent real trades or returns. Always do your own research. You alone are responsible for your decisions.
Keep reading
Related posts

16. Trade Management: Break-Even, Partials and Trailing Stops
Trade management explained: when break-even stops cost you money, partial exits, four kinds of trailing stop, the order-flow exit, and diagnosing yourself with MFE and MAE.

15. How to Day Trade Crypto With Order Flow (Starting Small)
How to day trade crypto with order flow: exchange security, spot vs perpetuals, leverage and liquidation, order types, fees, and an honest $100 starting plan.

14. Risk, Drawdown and the Mind: Day Trading's Real Edge
Day trading risk management and psychology: position sizing math, drawdown recovery arithmetic, hard limits, decision vs outcome, and the five states that break traders.

5. Market Structure and Trend: How to Pick Your Side Objectively
How to identify market structure objectively: higher highs and higher lows, swing point rules, impulse vs correction, and the arithmetic behind trading with the trend.

11. My Order Flow Entry Model, Step by Step
A complete order flow entry model: the four conditions, the exact trigger candle, the value-area filter, and the ten-item blocker list that vetoes a trade.

9. The Only Support and Resistance Levels I Actually Trade
Order flow support and resistance: how to find levels built from participants rather than price — high-ATS levels, automatic S&R and untested POCs.
Discussion (0)
Want to join the discussion? Comments live inside the platform.
Open NOROVIEW