
8. VWAP and Anchored VWAP: The Complete Trading Guide
VWAP trading strategy explained: the arithmetic, why institutions are measured against it, standard deviation bands, fat tails, and anchored VWAP.
8. VWAP and Anchored VWAP: The Complete Trading Guide
VWAP — volume weighted average price — is the average price every participant actually paid over a period, weighted by how much traded at each price. It matters for a structural reason, not a mystical one: a very large amount of professional money is literally measured against it. If your job today is to buy a large position, your execution is judged against the day's VWAP. Beat it and you did well. Miss it and you have a conversation.
So a meaningful amount of real money is actively trying to buy below that line and sell above it, all day, every day. That is not a theory about market psychology — it is a job description.
VWAP is a basic indicator and available on the free plan. Open a chart and add it before you read the rest.
What you'll learn in this lesson
- What VWAP actually is, with the arithmetic worked on screen
- Why institutional execution being benchmarked to it produces real, mechanical order flow
- Standard deviation and the deviation bands — properly, including the part most tutorials get wrong
- Why "it can't go past the third band" is how accounts die
- Balanced days vs trend days, and the two-second read that tells them apart
- Anchored VWAP: the battle line between comfort and regret
- VWAP vs a moving average, precisely
Lesson 8 of 16 · Part 2 — Technique. Part of the free order flow trading course. Previous: Volume Profile Trading Guide. Next: Order Flow Support and Resistance.
▶ Prefer to watch it?
Session VWAP and its settings: VWAP, Pivots & Trading Sessions — Every Setting (Ep 12) · Anchored VWAP: Volume Profile, Anchored VWAP & CVD Explained (Ep 14)
Key terms
| Term | What it means |
|---|---|
| VWAP | Σ(price × volume) ÷ Σ(volume), accumulated from an anchor |
| Anchor | Where the calculation starts — session, week, month, rolling, or a point you choose |
| Deviation band | A line drawn N standard deviations from VWAP |
| Standard deviation | The typical distance of a set of values from their average |
| Fat tails | Extreme moves occurring far more often than a normal distribution predicts |
| Anchored VWAP | A VWAP starting from a moment you select rather than a calendar boundary |
The problem VWAP solves
Start with the question: what is a fair price? It sounds philosophical. It is not — it has a boring, arithmetic answer, and the arithmetic is what makes it useful.
Fair = what the average participant actually paid.
If a thousand people bought something today and you want to know whether you got a good deal, you compare your price to what everybody else paid. Above the average, you overpaid. Below it, you did well.
Now — how do you calculate "what everybody paid"? Your first instinct is to average the prices: add them up, divide. That is wrong, in a way that matters a lot, because it treats every price equally regardless of how much traded there. A price where one unit changed hands counts exactly as much as a price where ten thousand units did.
Averaging prices treats a $1 trade the same as a $10,000,000 trade.
You want the average weighted by size, so the prices where the real money went count more. That is VWAP.
The arithmetic
Concretely, with numbers.
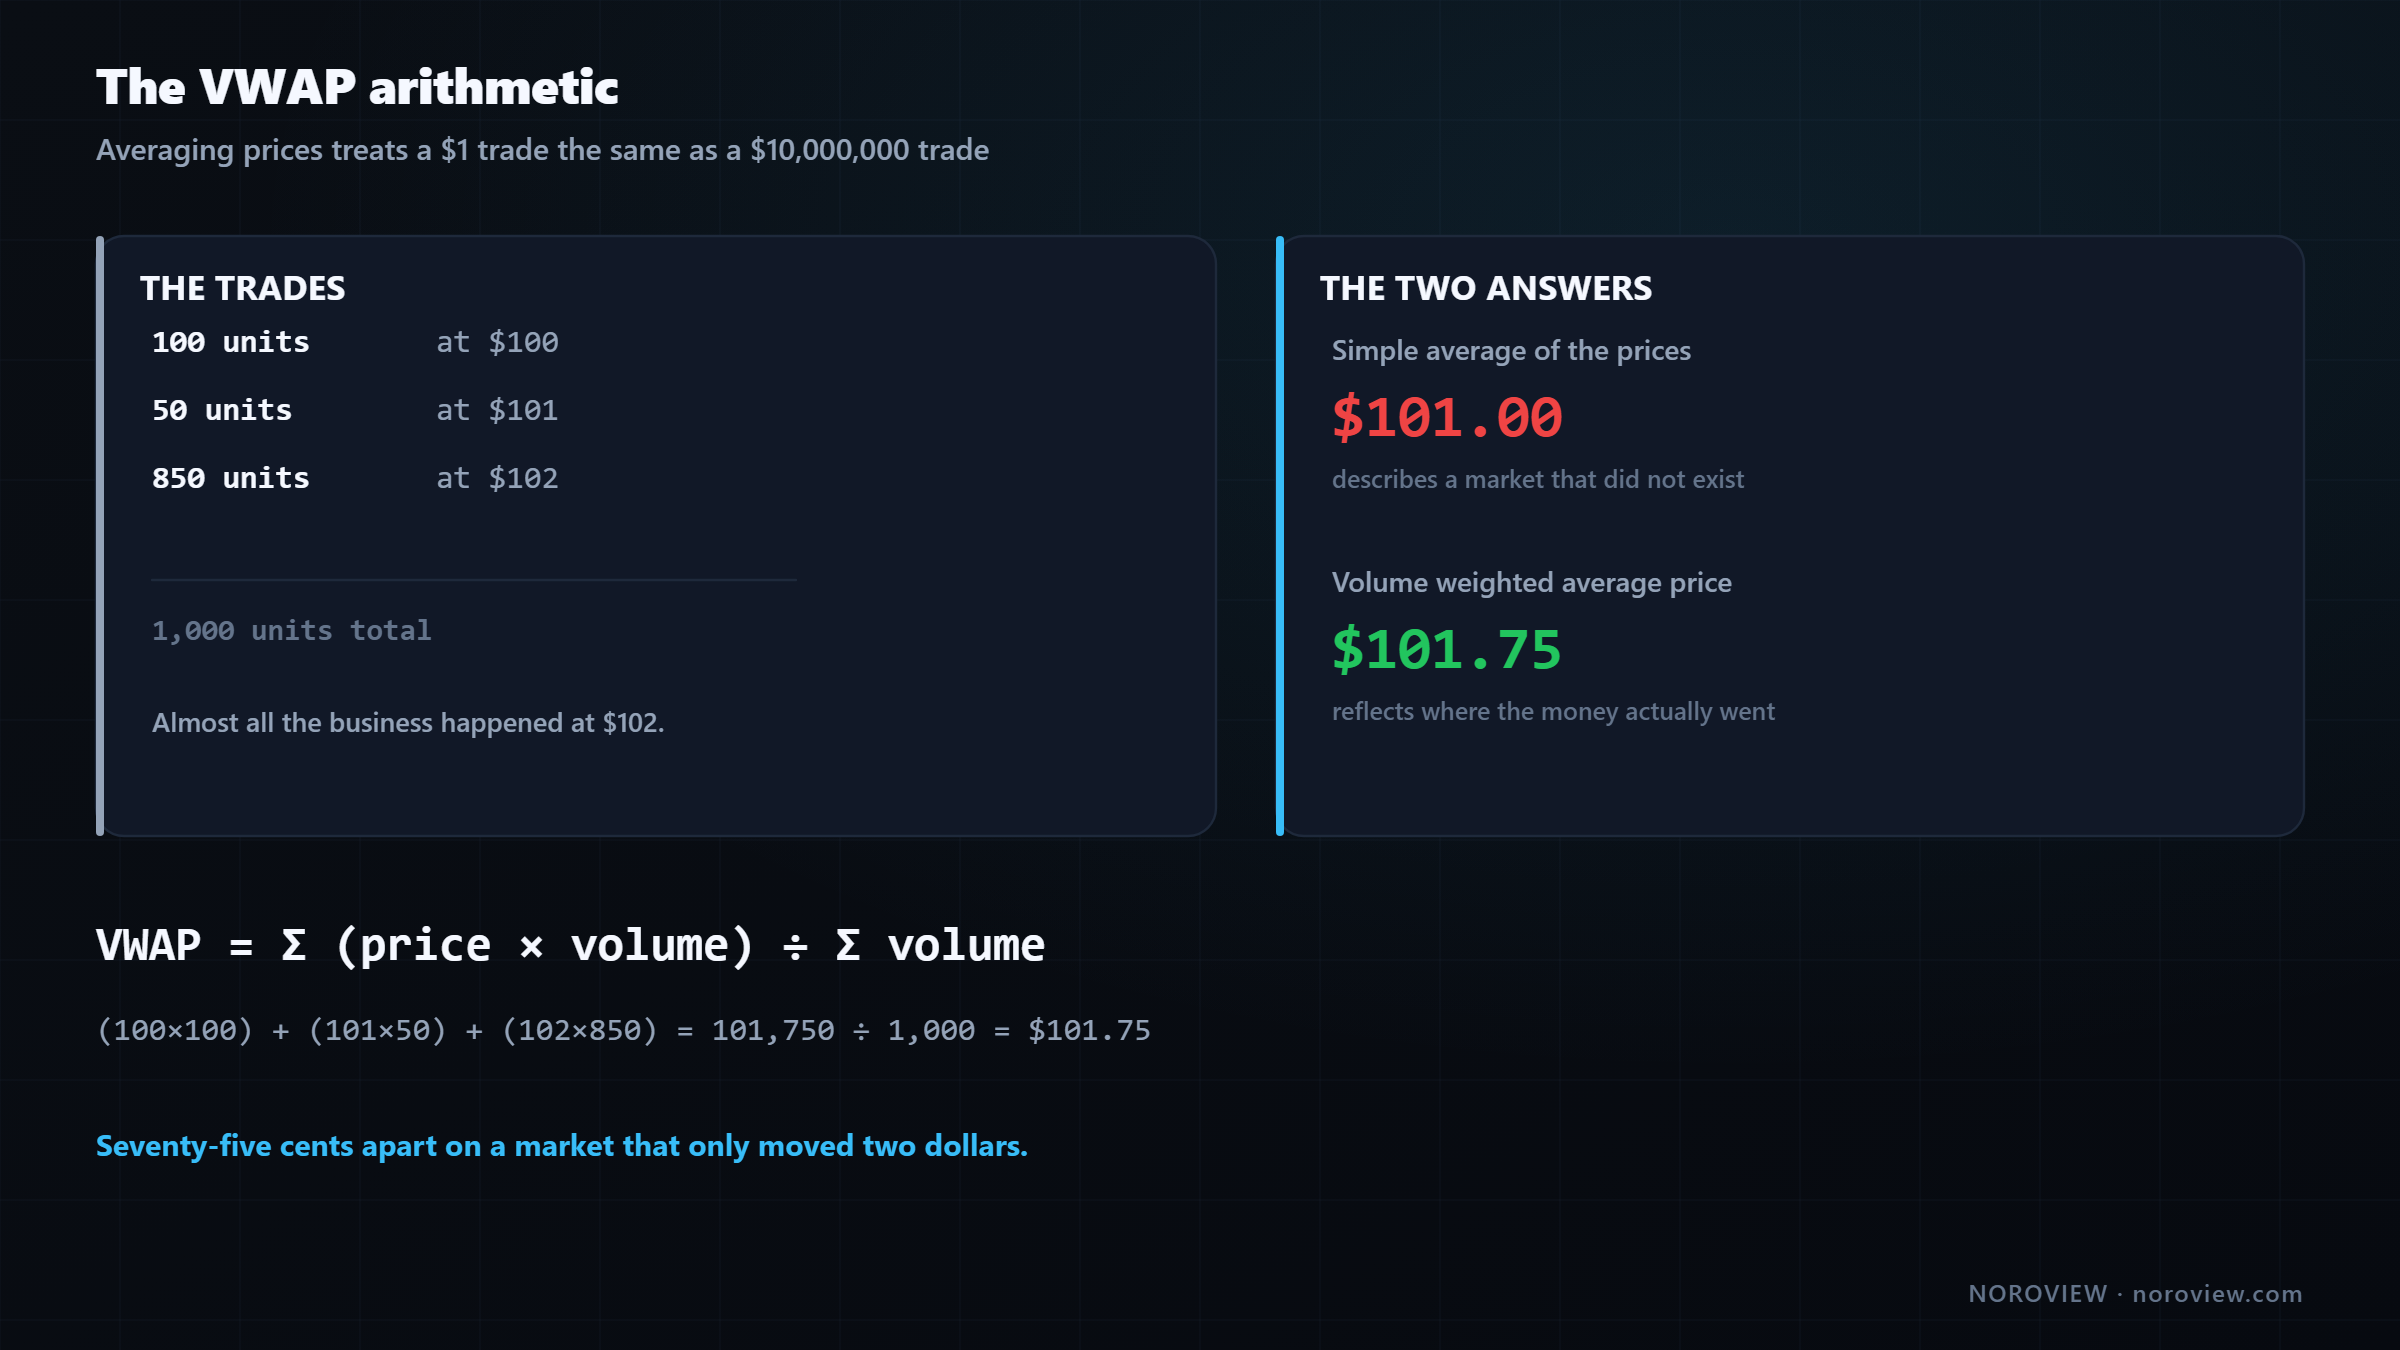
Three trades happened today:
   100 units  at  $100
    50 units  at  $101
   850 units  at  $102
   ─────────────────────
  1000 units  total
The simple average of those three prices is (100 + 101 + 102) ÷ 3 = $101.00. That number is misleading, because almost all the actual business happened at $102. Saying "the average price was $101" describes a market that did not exist.
The VWAP multiplies each price by the volume that traded there, sums, and divides by total volume:
VWAP = Σ (price × volume) ÷ Σ volume

   (100 × 100)  =    10,000
   (101 ×  50)  =     5,050
   (102 × 850)  =    86,700
                  ─────────
                    101,750  ÷  1,000  =  $101.75
Seventy-five cents apart on a market that only moved two dollars. That is a big difference, and the VWAP number is the honest one, because it reflects where the money actually went.
Two practical details. First, it is cumulative from an anchor — VWAP is not a rolling calculation. It starts at a point, usually the session open, and accumulates every trade from then on. Second, the price used per candle defaults to hlc3 (high + low + close ÷ 3), a reasonable stand-in for "the typical price of that candle." You can change it; I never have, and I would not spend time on it.
Why big money is measured against it
VWAP is a benchmark, not an indicator.
Imagine you manage money and you need to buy a very large position today. You cannot buy it all at once — you would move price against yourself, exactly like walking the book but at enormous scale. So you spread it over hours using execution algorithms.
How does anybody judge whether you did that well? You cannot be judged on whether the price went up — that is not your job and not in your control. What is in your control is your execution. So you get judged against the day's VWAP.
That one fact produces real, mechanical behaviour:
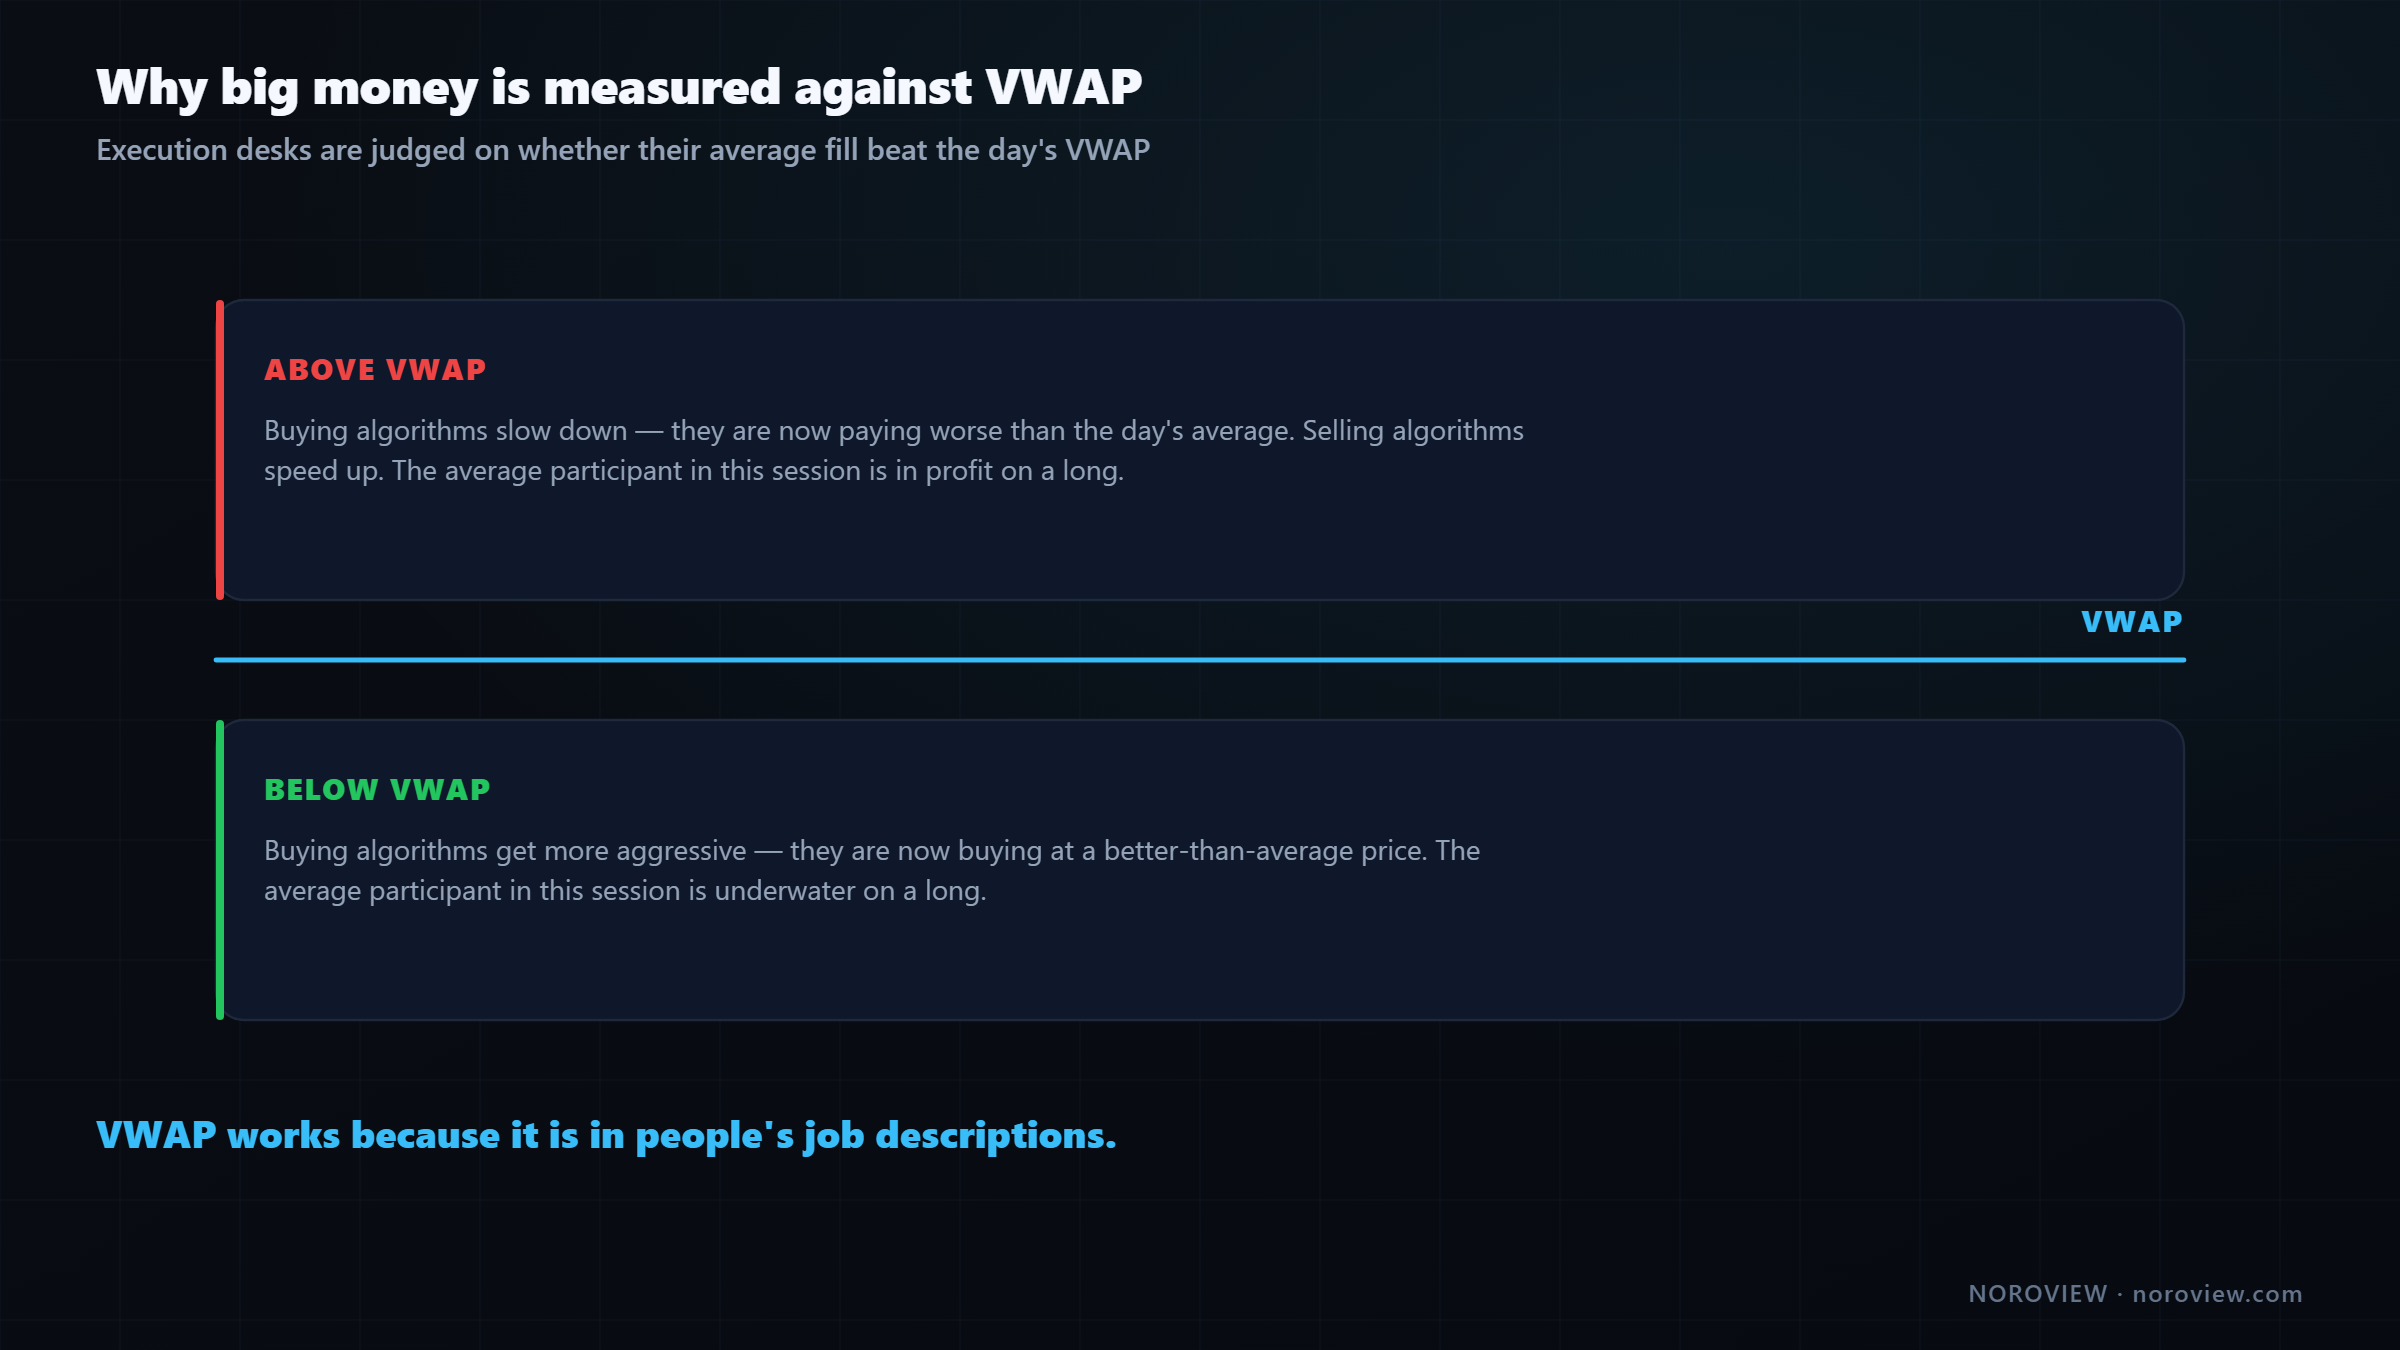
Below VWAP → buyers with big orders get more aggressive. Above VWAP → sellers with big orders get more aggressive.
When price is below VWAP, an algorithm that needs to buy is now buying at a better-than-average price, so it accelerates. When price is above VWAP, buying algorithms slow down and selling algorithms speed up.
That is why VWAP behaves like a magnet and like support and resistance. Not because "the market respects it" — because of real orders, from real institutions, whose behaviour genuinely changes on each side of that number.
VWAP works because it's in people's job descriptions.
And notice what that tells you about which VWAP matters: the one the participants in this market are measured against. For intraday crypto, the session VWAP. For somebody managing a position over a week, the weekly. Which is why we look at several.
▶ Try this now
Add the VWAP indicator (it is a basic indicator, free on every plan) and set the Anchor to Session. Then ask one question: has price crossed this line more than twice today, or has it lived on one side? That single answer decides which half of your toolkit is allowed today. Launch NOROVIEW free →
Standard deviation, properly
To understand the bands you need one statistics concept, and it is worth five minutes because it is genuinely useful.
Standard deviation measures how spread out a set of numbers is around their average. Two groups of numbers can share the same average while one is tightly packed and the other is scattered everywhere. The average alone cannot tell them apart; standard deviation can — small for the tight one, large for the spread one.
The calculation in plain words: take each value's distance from the average, square those distances so negatives do not cancel, average them, take the square root to return to normal units.
Standard deviation = the typical distance from the average.
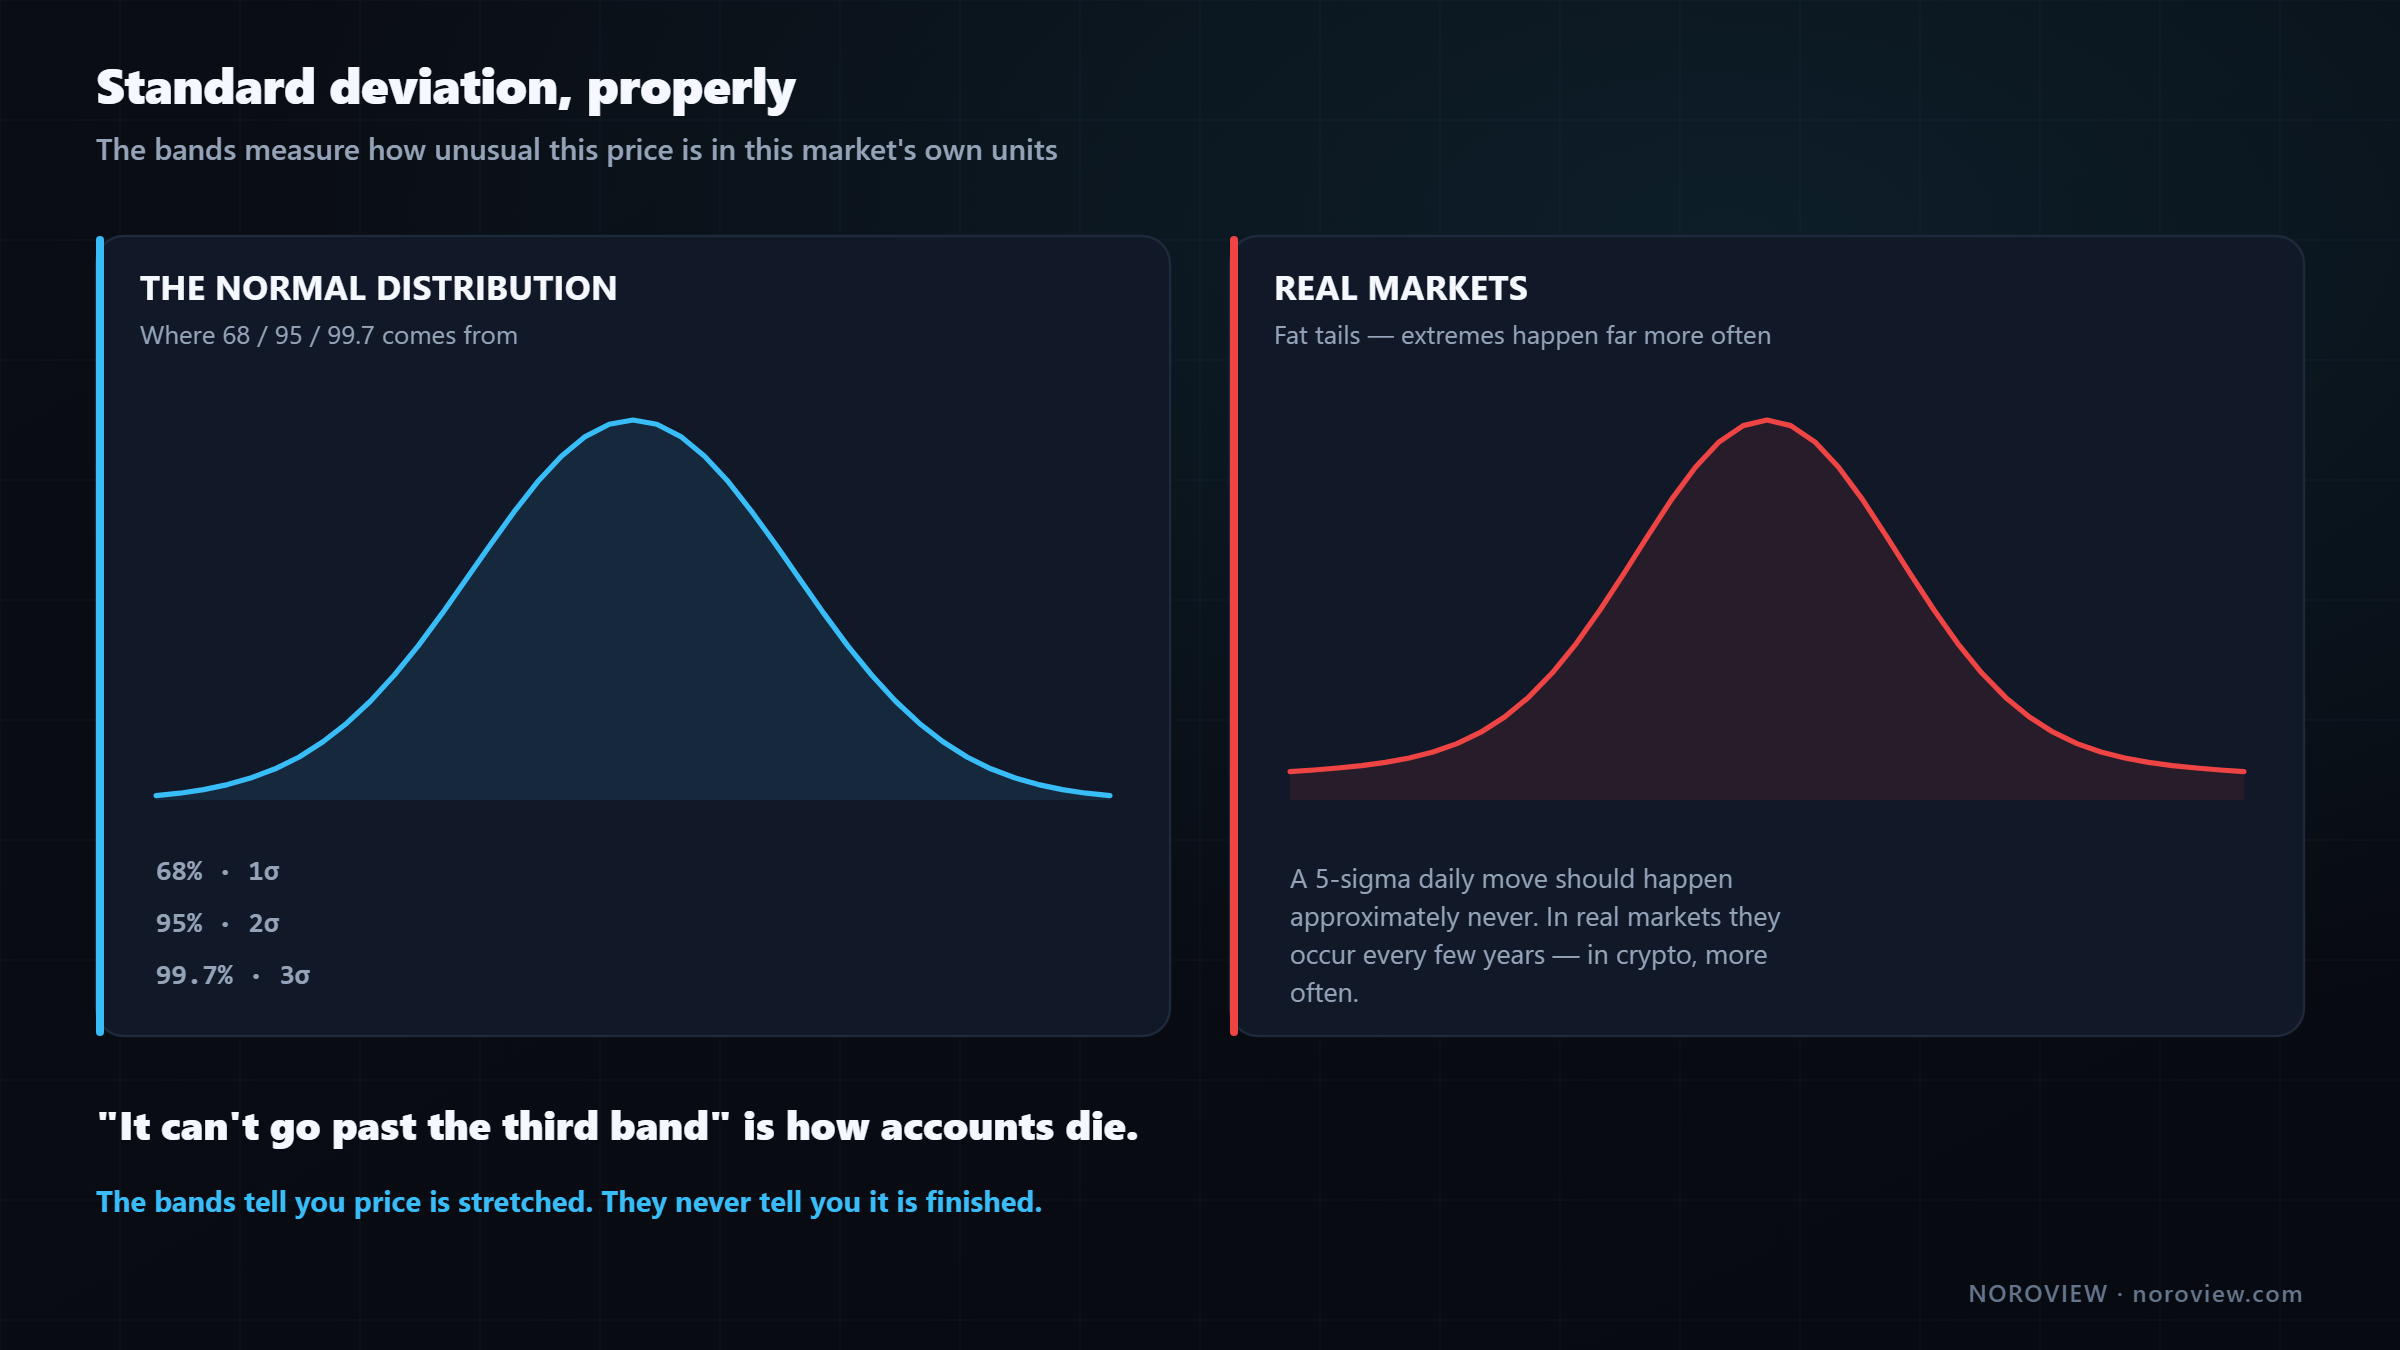
If a set of numbers follows a normal distribution — the bell curve — something very tidy is true:
- about 68% of values fall within 1 standard deviation
- about 95% within 2
- about 99.7% within 3
So a "three-sigma event" should be genuinely rare — roughly three times in a thousand.
Apply that to a chart: VWAP is the average, and the deviation bands are drawn one, two and three standard deviations away from it.
The bands ask: how unusual is this price, given where business has been done today?
That is what makes them adaptive. On a quiet day the bands are tight, because the typical distance from VWAP is small. On a volatile day they are wide. The same dollar move is "extreme" on one day and "normal" on another — and the bands know the difference. A fixed percentage never could.
The part most tutorials skip
Markets are NOT normally distributed.
The 68/95/99.7 numbers come from a normal distribution. Financial markets have what statisticians call fat tails — extreme moves happen far, far more often than the bell curve says they should.
A five-standard-deviation daily move should, under the normal model, happen approximately never — less than once in many thousands of years. In real markets they happen every few years. In crypto, more often than that.
"It can't go past the third band" is how accounts die.
Do not treat the bands as walls. Do not think "price is at the second deviation, it has to come back." It does not have to do anything. In a genuine trend, price can ride the second band for hours and then go straight through the third. If you shorted at the second band because "statistically it must revert," you got run over by something the textbook calls nearly impossible and which happens a few times a month.
Use the bands as context, not as commands.
The bands tell you price is stretched. They never tell you it's finished.
Price at the second deviation tells you the market is stretched relative to its own recent behaviour. That is genuinely useful — it changes the odds of chasing, and it changes where you would want to take profit. It is not an entry, and it is not a reason to trade against a trend.
The two kinds of day
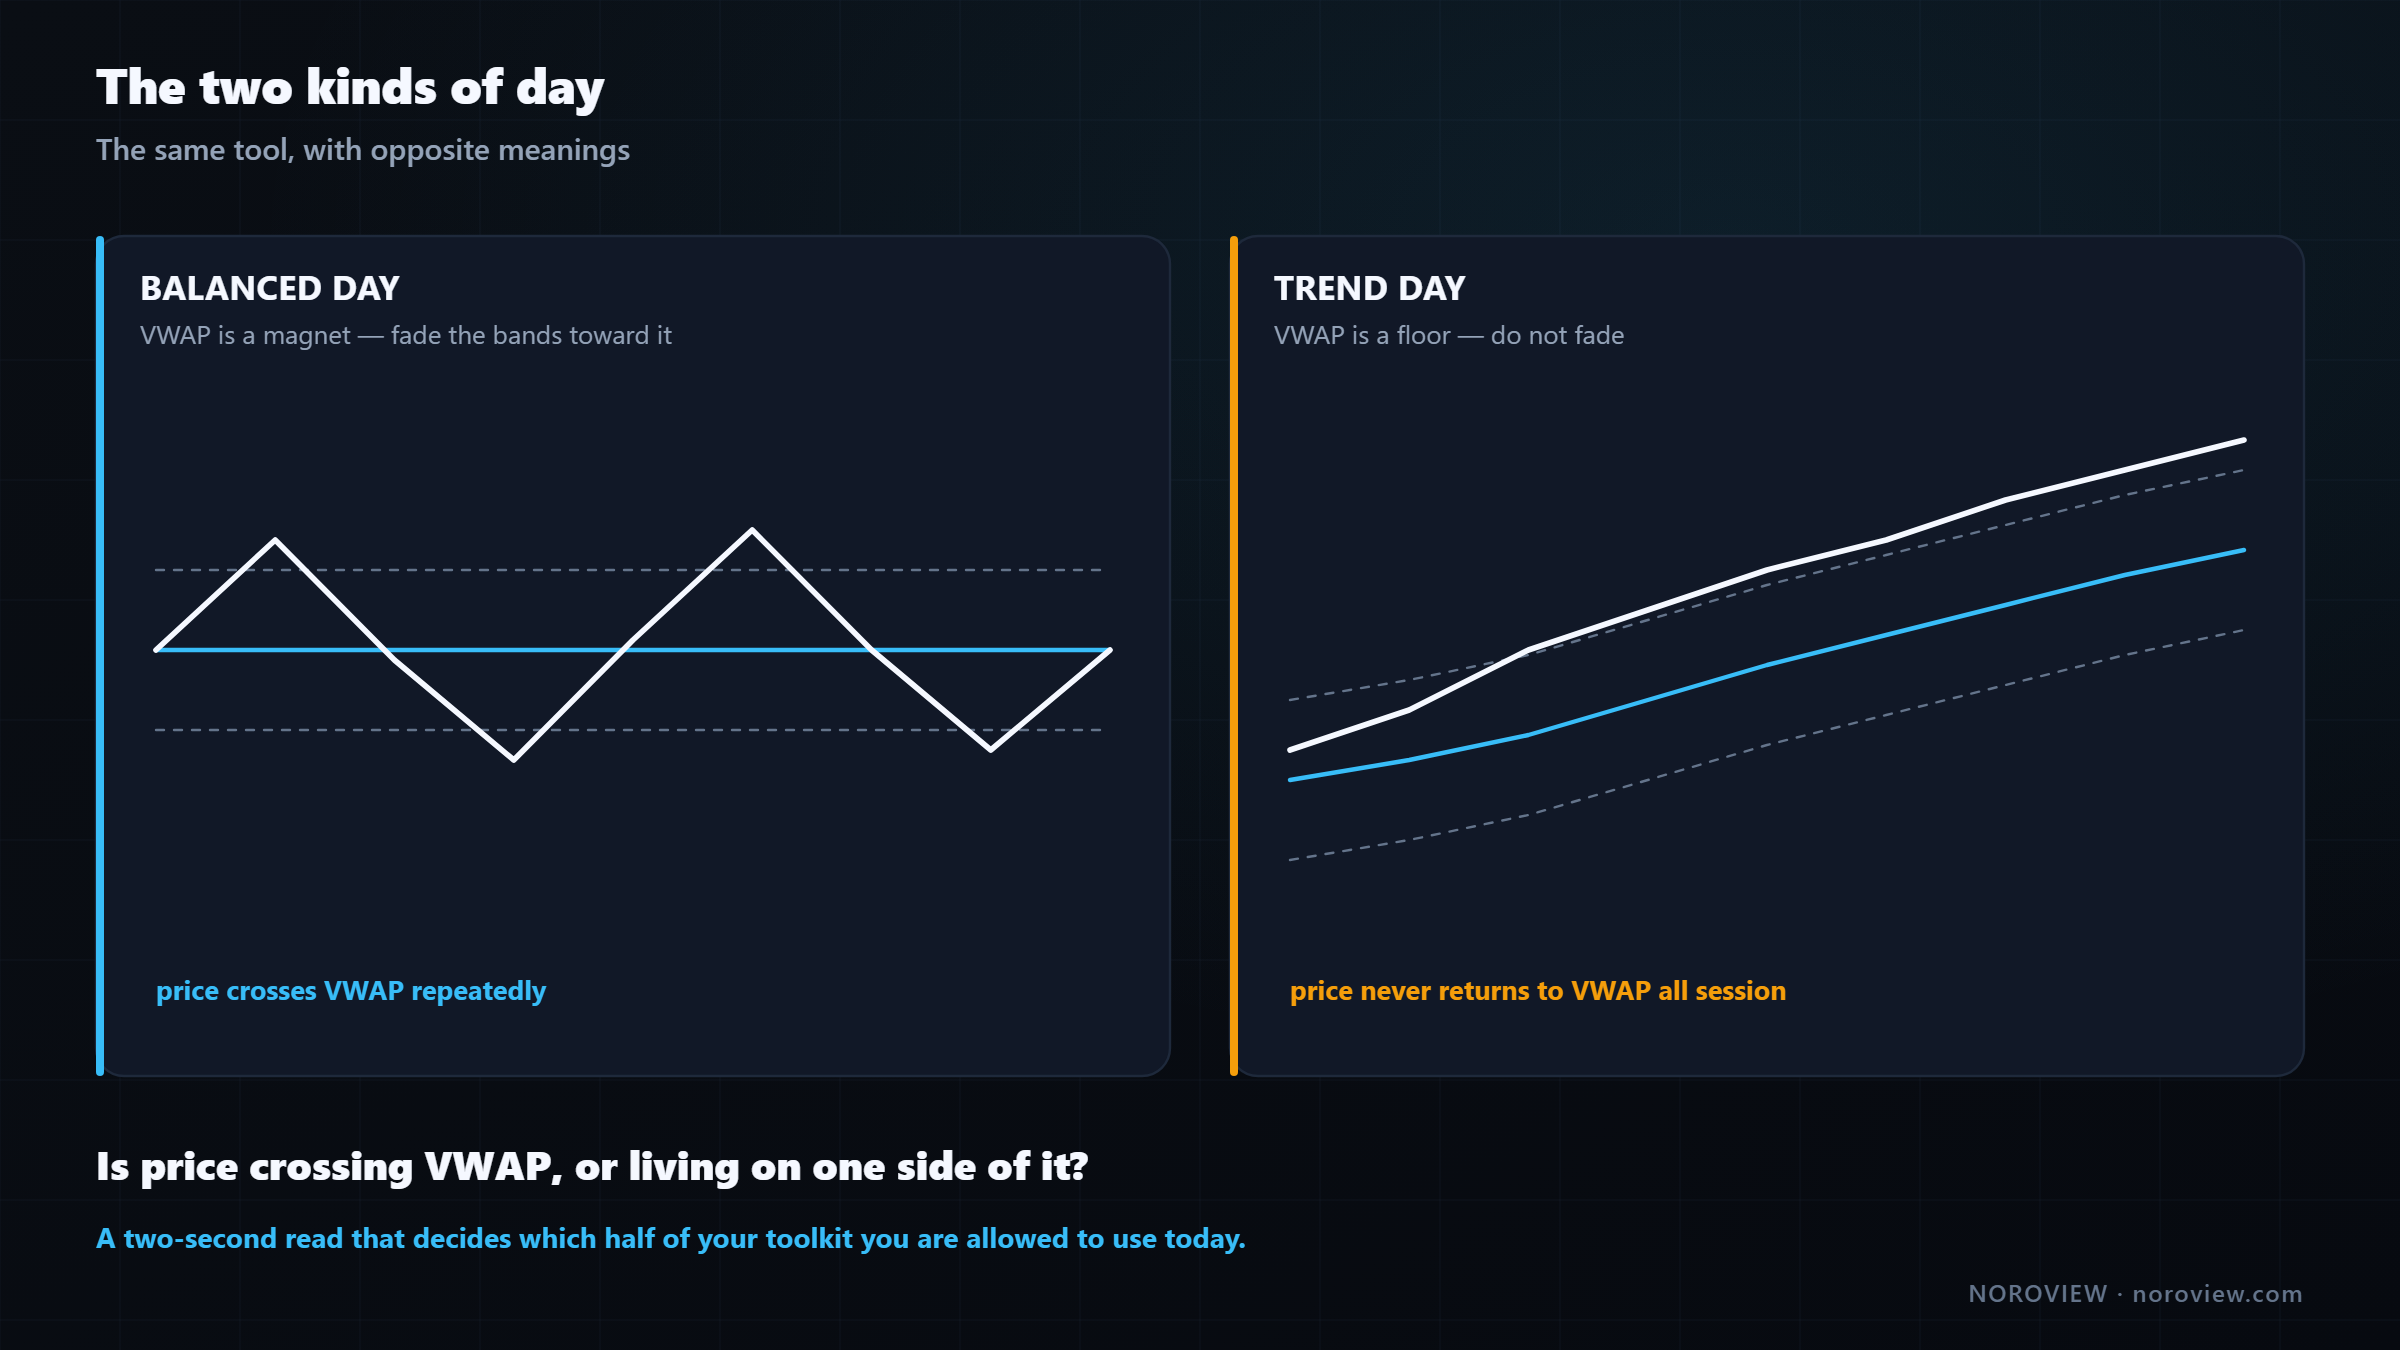
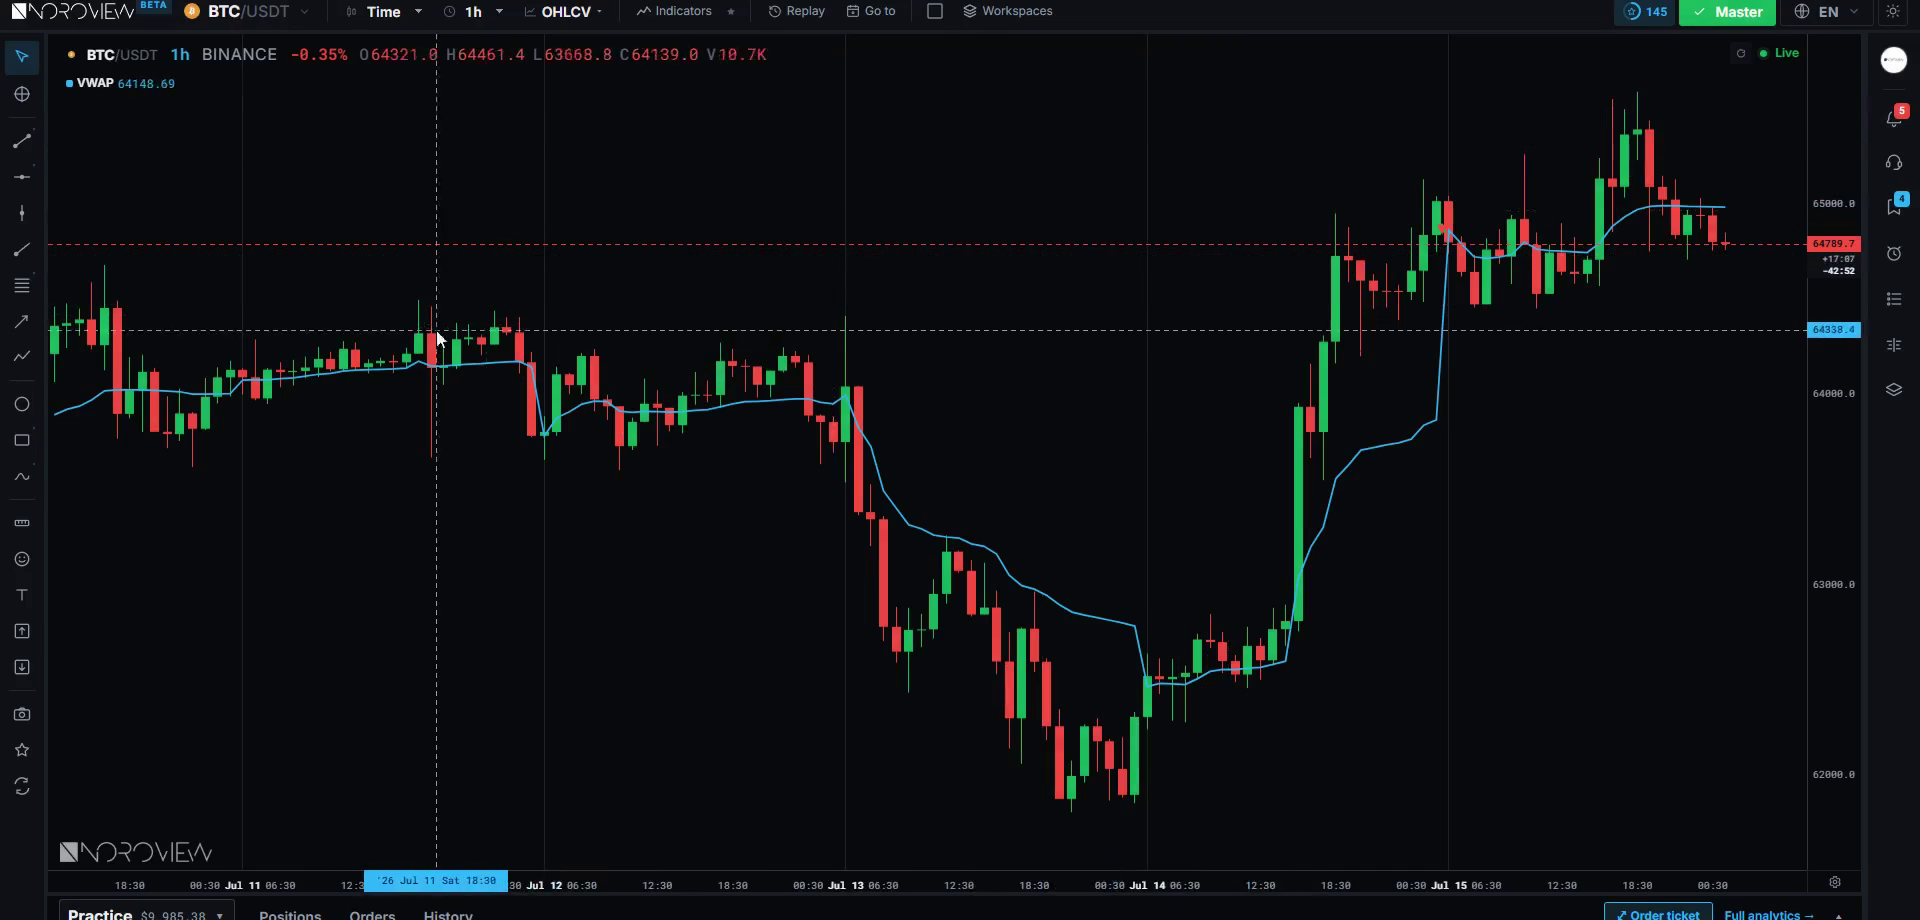
On a balanced day, VWAP is a magnet. Price goes above, gets stretched to the first band, comes back. Goes below, stretched, comes back. It rotates around fair value and the bands contain it. On a day like this VWAP itself is a genuinely good level — price returns repeatedly and the reactions are tradeable, especially where VWAP lines up with something else from your level map.
On a trend day, VWAP is a floor, not a magnet. Price leaves VWAP in the morning and never comes back, spending the entire session between the first and second band on one side. Every "it is stretched, it must revert" trade was a loser. And notice what VWAP became: not a magnet but a floor the trend never even tested — which is itself a strong signal. A market that cannot get back to its own average price all day has real one-sided commitment.
Price crossing VWAP repeatedly → balanced. Fade the bands toward VWAP. Price on one side, not returning → trending. Use VWAP as support/resistance, do not fade.
And notice how you tell them apart: is price crossing VWAP or not? That is a two-second read available at any moment, and it tells you which set of tactics is allowed today.
It is also the same balance-versus-trend question the profile shapes answered from a different angle. When two independent tools agree on that, you can be confident.
VWAP, volume profile and footprint on one chart
Everything you need to build a real level map, in a browser tab, with the heavy compute done server-side. Create a free account → · Compare plans
The anchors
VWAP has to start somewhere, and the anchor decides where.
| Anchor | What it gives you |
|---|---|
| Session | Resets every day. The intraday trader's VWAP — the average price of today. My default |
| Week | Accumulates from the start of the week. Slower and heavier; a genuinely strong level because swing positioning is measured against it |
| Month | Slower again. Big-picture fair value that barely moves in a day. Distance from it is a statement about the month, not about today |
| Rolling | A fixed window that moves forward instead of resetting. Like a moving average, but volume-weighted |
My practical setup:
- Session VWAP → on the execution chart, always
- Weekly VWAP → on the 1h chart, and onto the level map
- Monthly VWAP → checked once a day, not permanently on the chart
The higher anchors matter more than people think, for one reason: the weekly and monthly VWAPs are slow, which means they are stable. They are in roughly the same place tomorrow as today. A level that does not move is a level people can plan around, and that makes it a better level. The session VWAP is useful, but it is gone at midnight. The monthly VWAP is a landmark.
One more practical thing: early in a session VWAP is jumpy and unreliable. Very little data, so a few candles drag it around. In the first thirty minutes I do not treat it as a level at all — I let it settle.
Anchored VWAP: the battle line
Anchored VWAP = the average price of everyone who has traded since a moment YOU choose.
Session, weekly and monthly VWAPs are anchored to the calendar, and the calendar knows nothing about this market. Midnight is not an event.
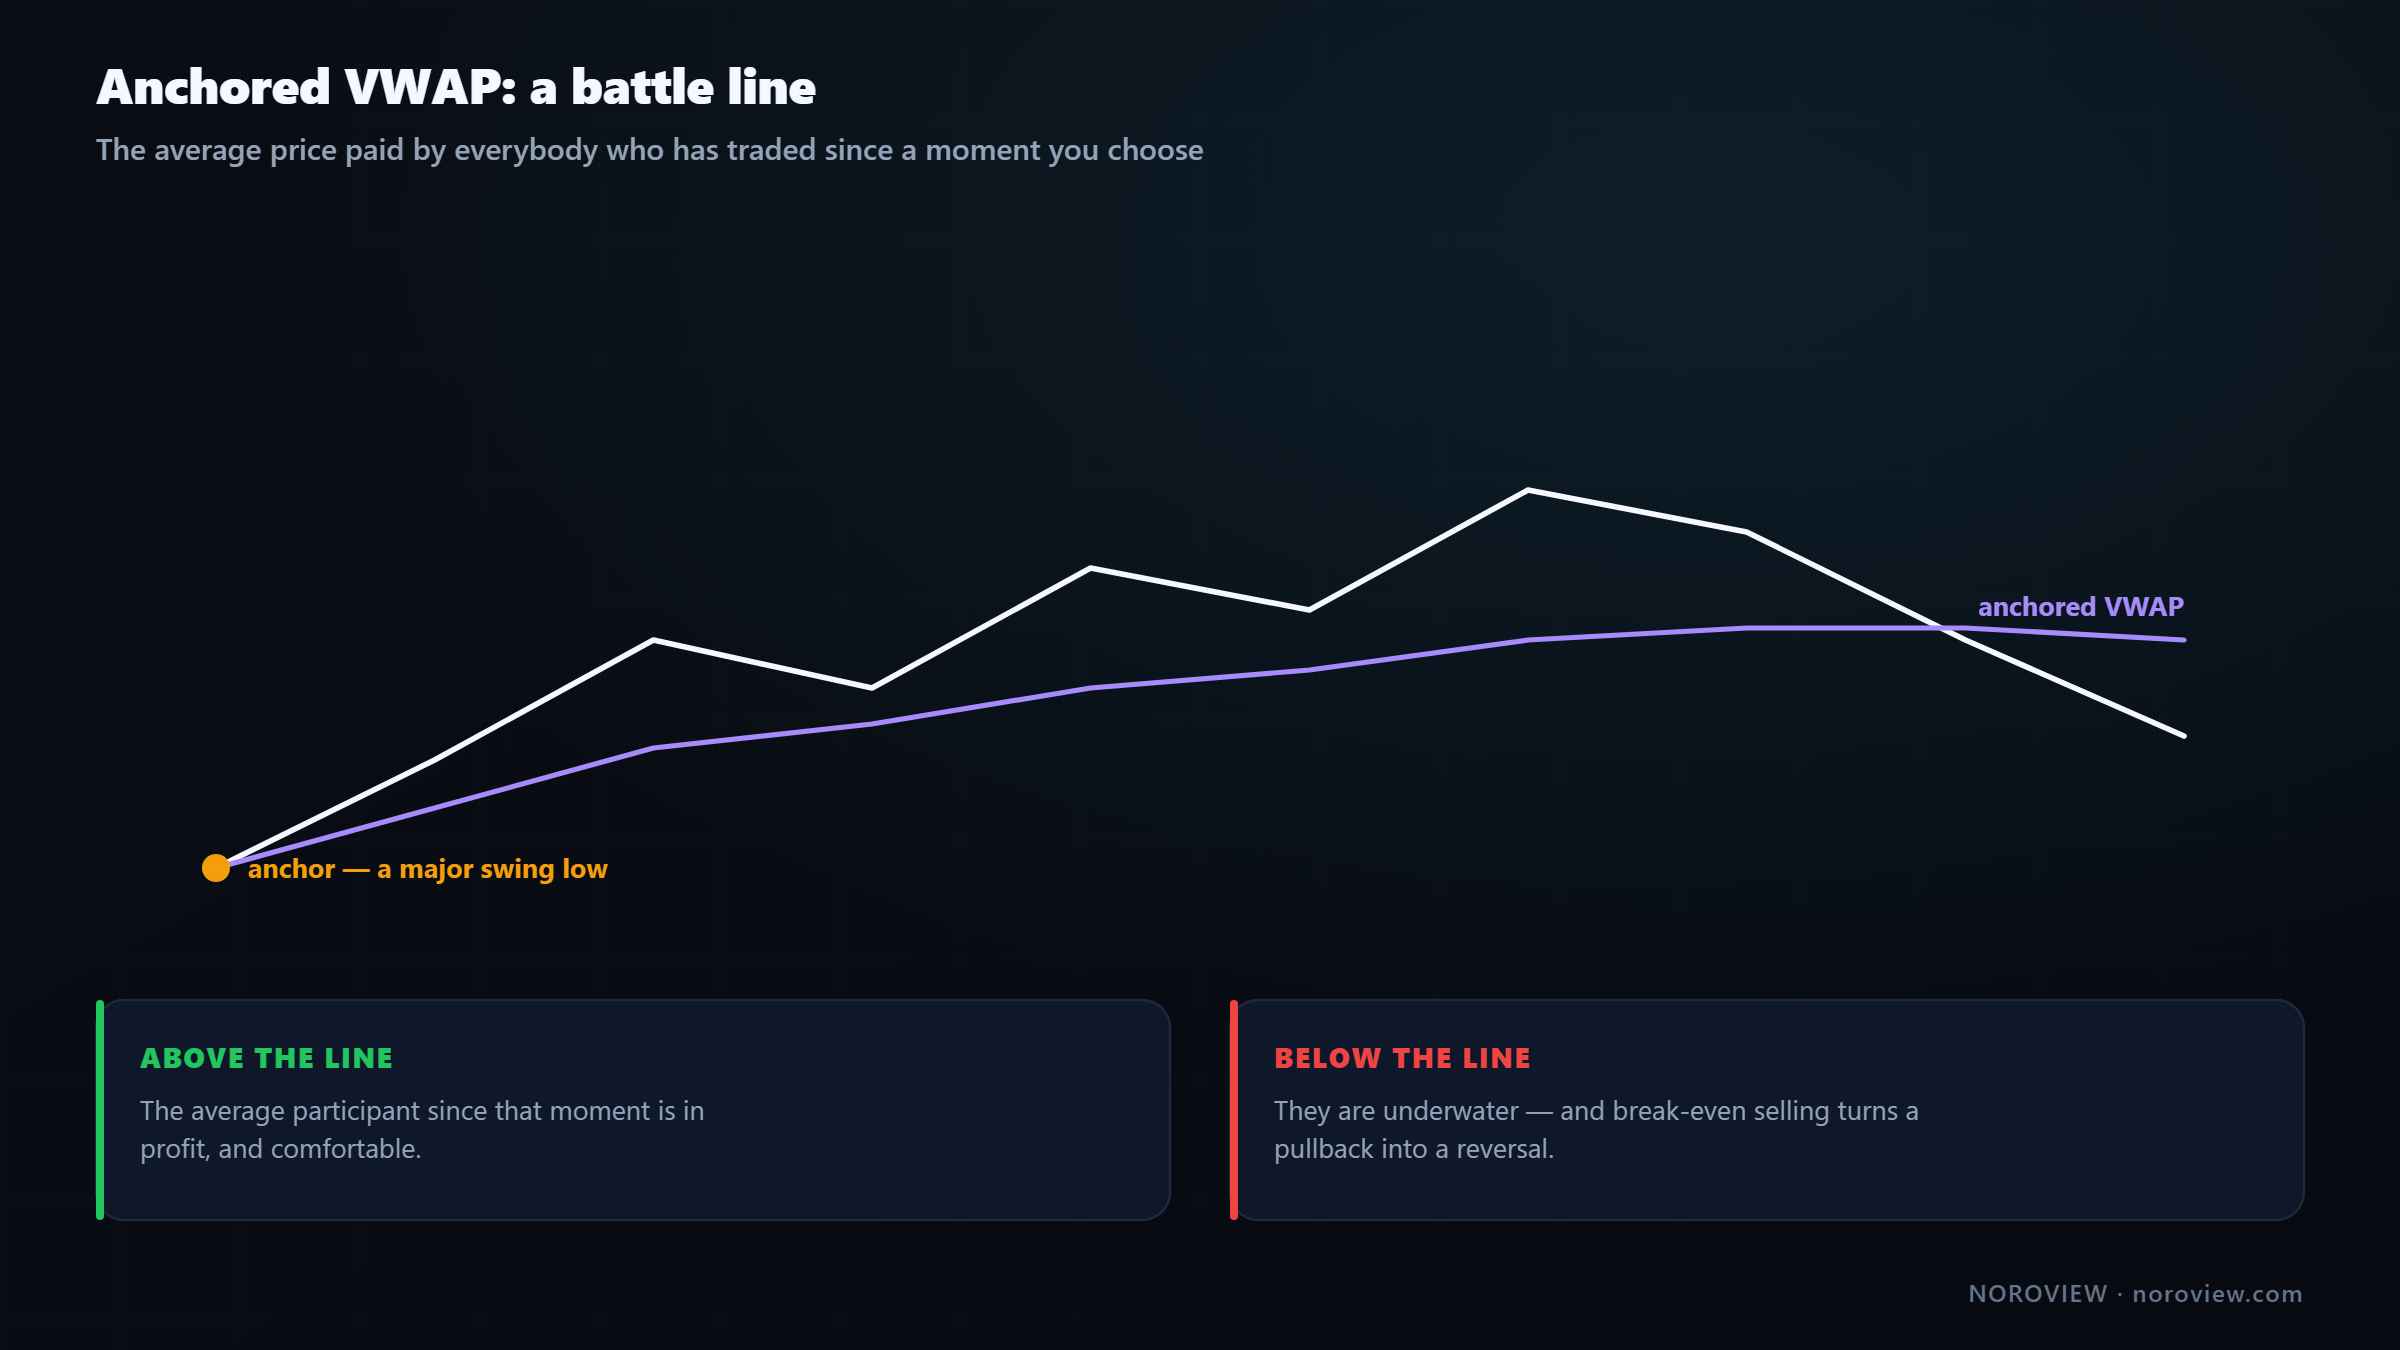
Anchor to a major low and the line now tells you the average price paid by everybody who has traded since that low.
Above the line, the average buyer since that moment is in profit. Below it, underwater.
While price is above it, the average participant from this move is comfortable. If price falls below it, the average participant since that moment is losing money — and behaviour changes completely when people are underwater. That is when "I'll get out at break-even" starts happening, and break-even selling is what turns a pullback into a reversal.
An anchored VWAP is a battle line between comfort and regret.
Two platform details that catch everybody
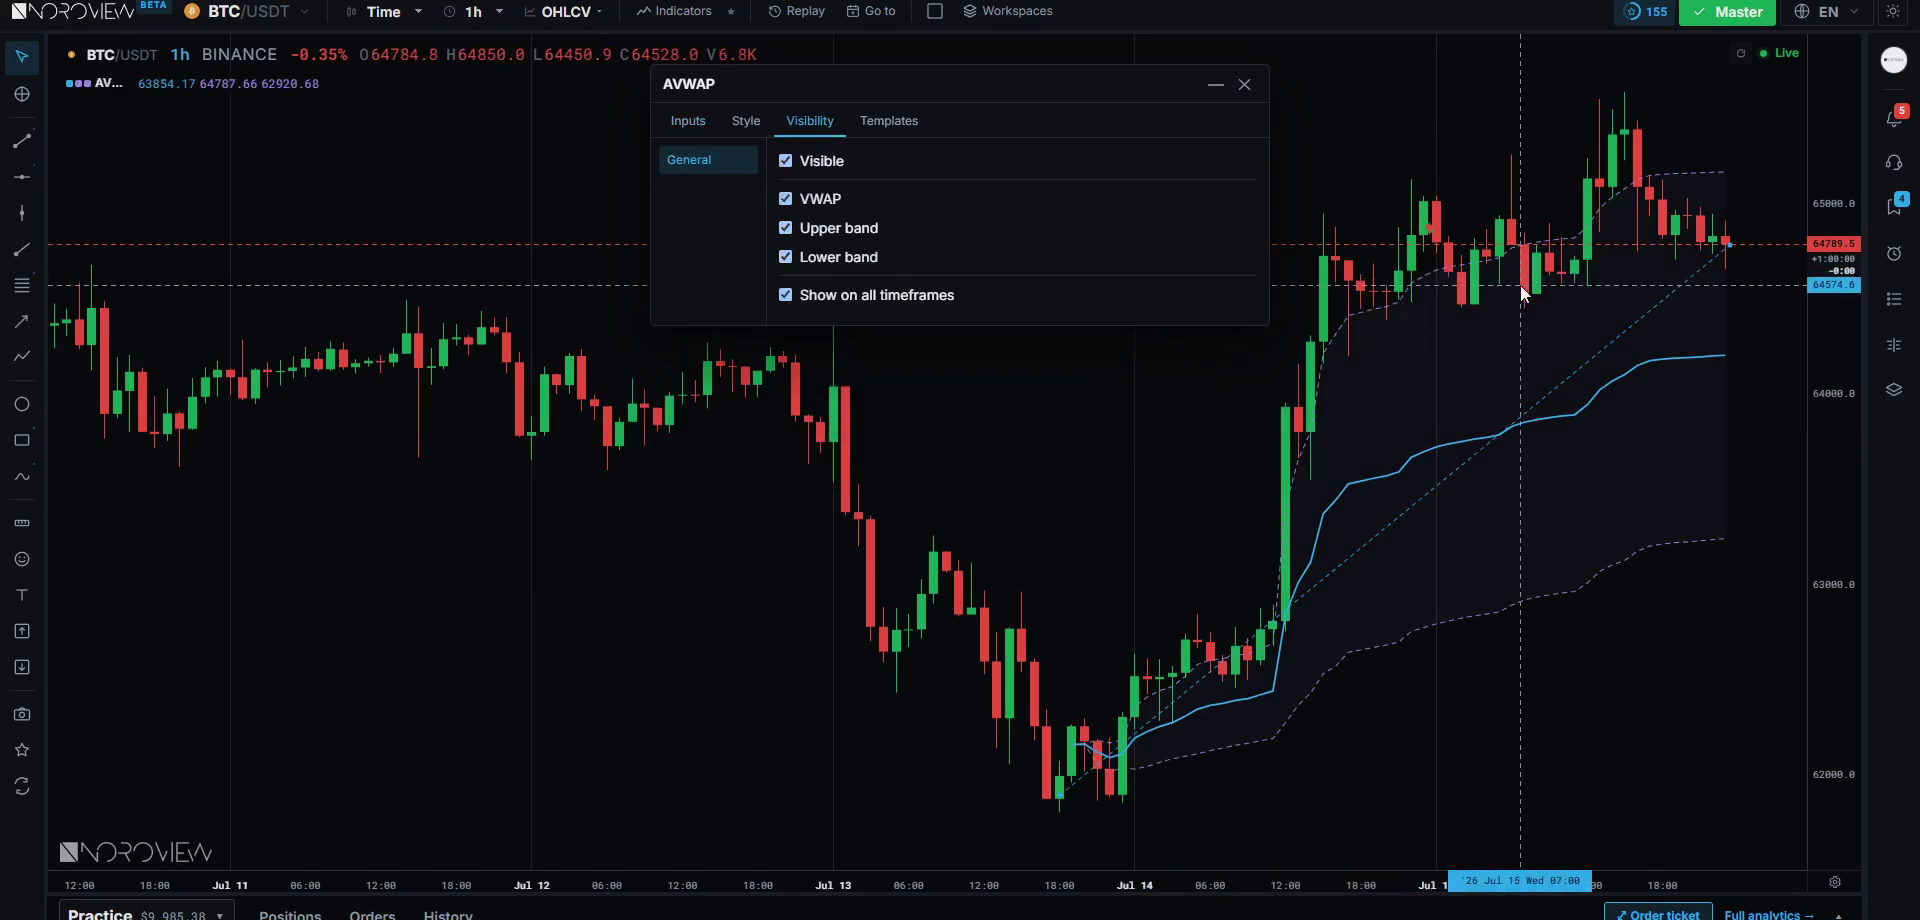
1. NOROVIEW's anchored VWAP is pair-based. You place points, and each consecutive pair gets its own VWAP leg — A→B is one leg, B→C is the next. It is not one anchor running forever; you are defining segments. If you place a point on the currently forming candle, that leg tracks forward as the market develops, which is how you anchor to "right now" and watch it evolve.
2. The deviation bands are OFF by default, and the switch is on the Visibility tab — not on Inputs. If you set the band multiplier and nothing appears, that is why. Multiplier on Inputs, then turn the bands on under Visibility.
Where to anchor
Same discipline as the anchored volume profile: the anchor is the analysis.
- A major swing high or low
- A breakout from a range
- A big news or liquidation event
- The start of the current trend
Anchor to a moment the market genuinely cares about — or you get a beautiful, meaningless line.
And do not put five of them on the chart. One or two anchored VWAPs that mean something beat six that look impressive. Same rule as the level map: if everything is a level, nothing is.
(Anchored VWAP is an advanced, paid indicator. The session/weekly/monthly VWAP is free.)
VWAP vs moving average
People ask constantly whether VWAP is "just a moving average." It is not, and the differences are worth being precise about.
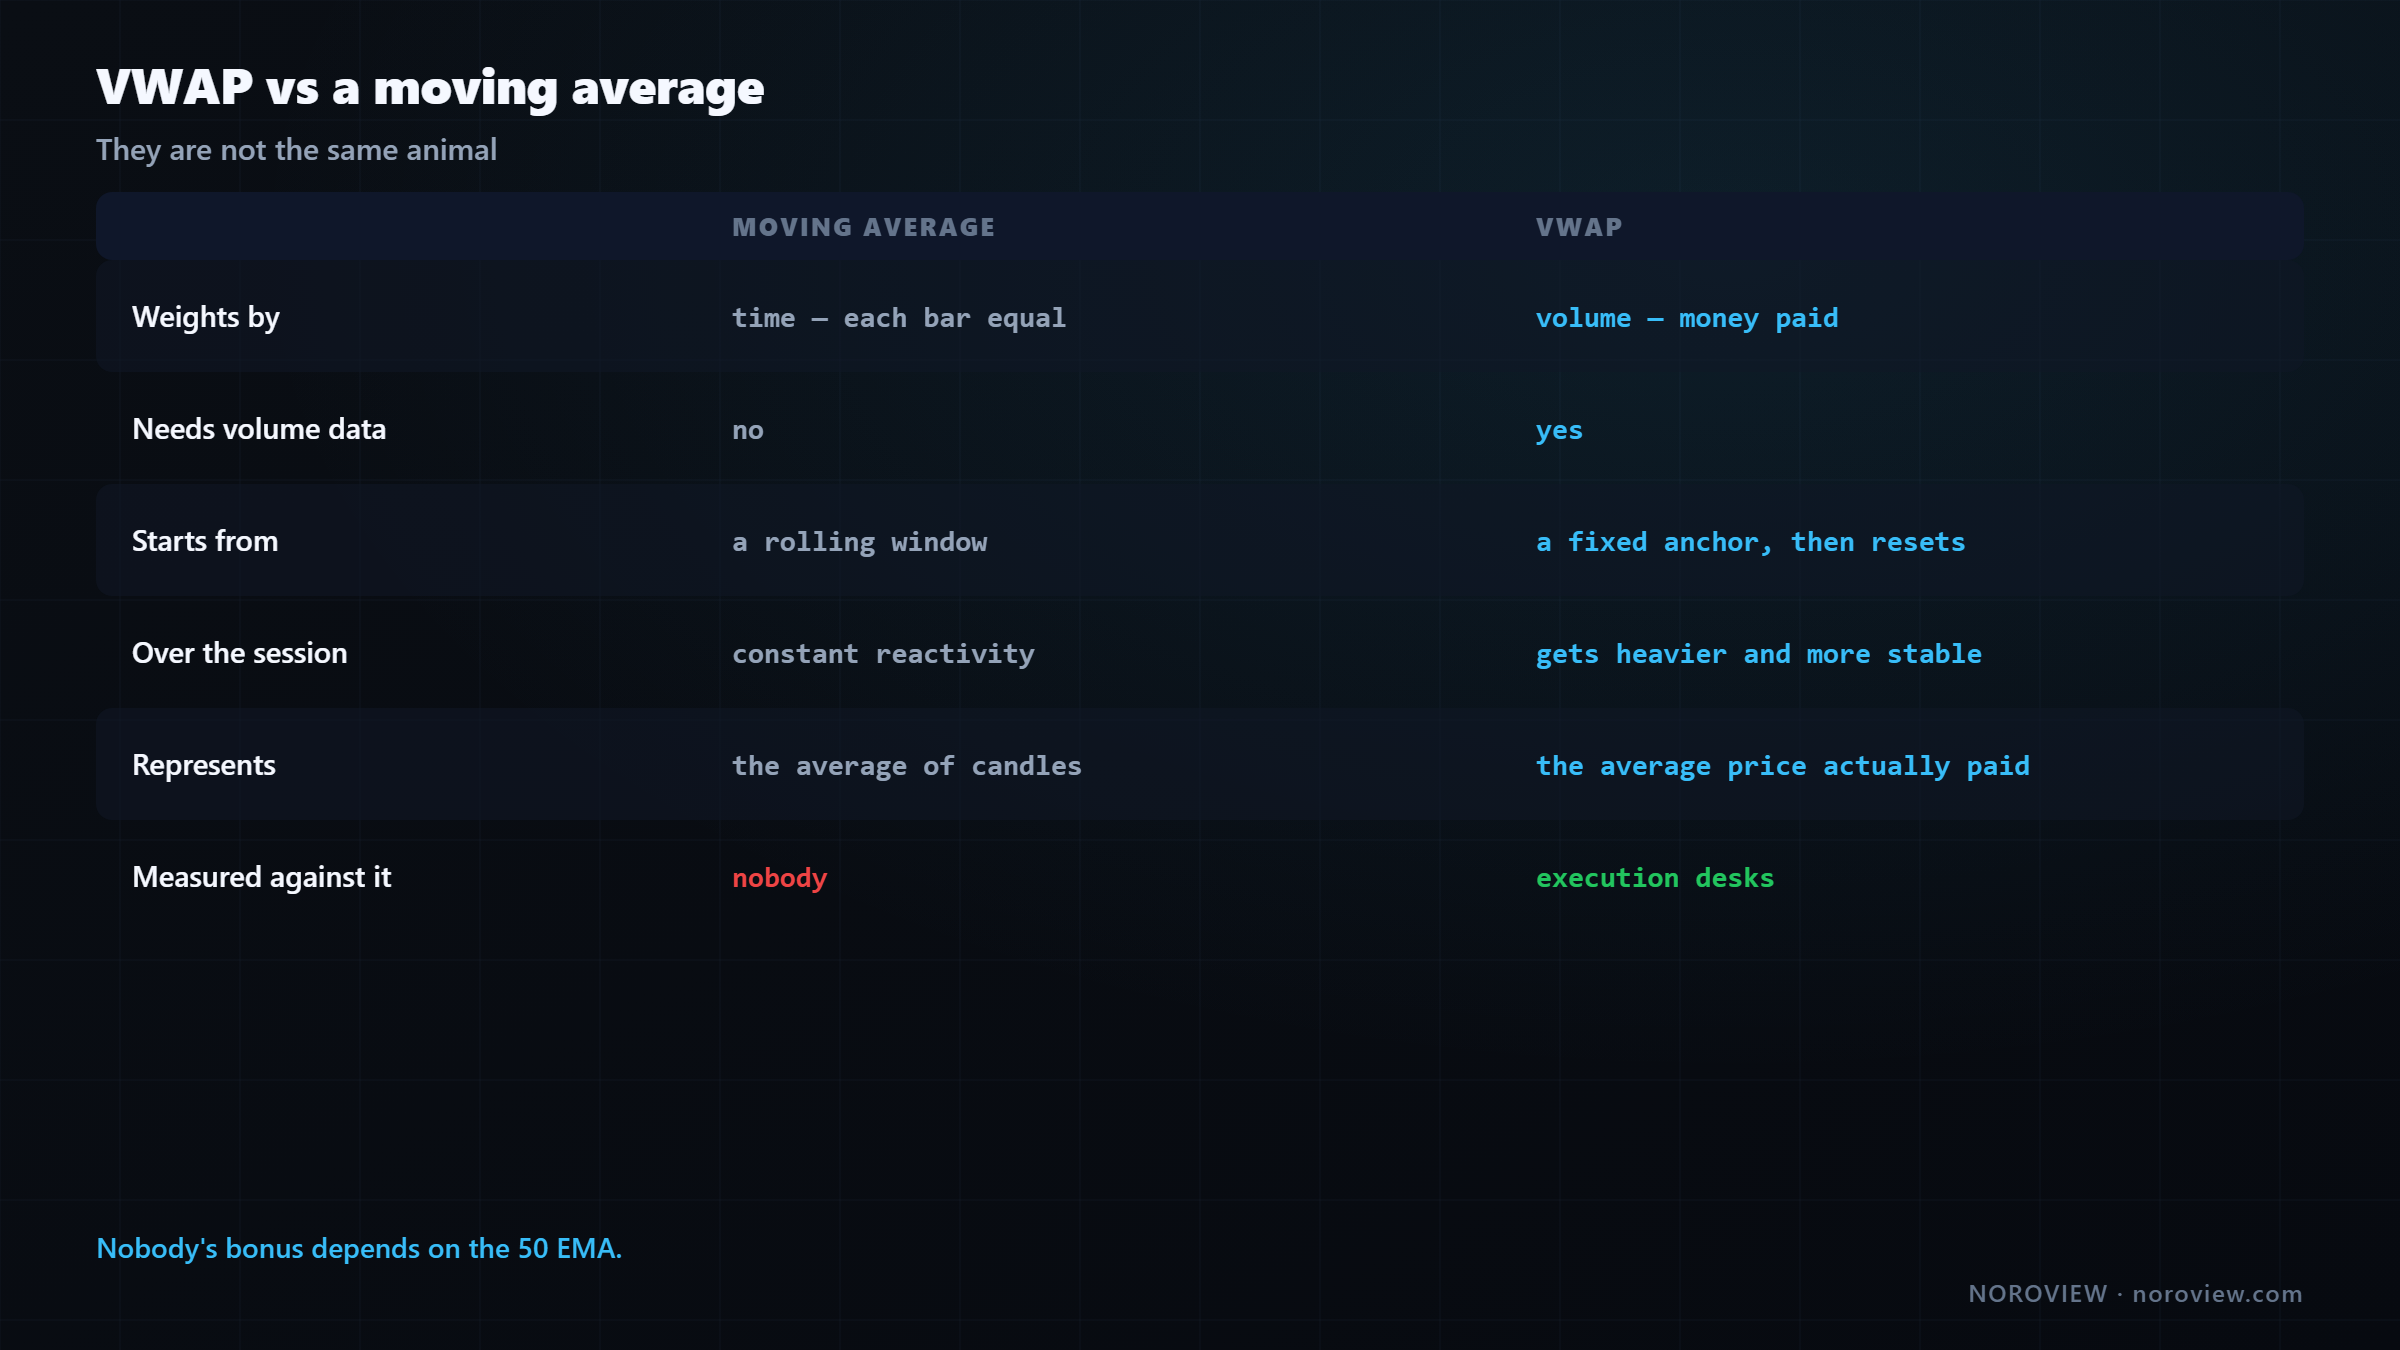
| Moving average | VWAP | |
|---|---|---|
| Weights by | Time (each bar equal) | Volume (money paid) |
| Needs volume data | No | Yes |
| Starts from | A rolling window | A fixed anchor, then resets |
| Behaviour over time | Constant reactivity | Gets heavier as it accumulates |
| Represents | The average of the candles | The average price actually paid |
| Who is measured on it | Nobody | Execution desks |
Difference 1 — what gets weighted. A moving average treats every candle equally: a dead 3 a.m. candle with almost no trading counts exactly as much as the explosive candle where the day's whole move happened. VWAP weights by volume, so the candle where the money went counts more. That is the difference between describing the chart and describing the transactions.
Difference 2 — the anchor. A moving average is rolling, always looking back the same number of periods forever. VWAP accumulates from a fixed start and then resets, and that reset is a feature: it answers "what has been fair today," not "what has been fair over the last twenty candles, whenever those were."
Difference 3 — reactivity changes over time. A 20-period moving average is exactly as reactive at the end of the day as at the start. VWAP is not. Early in the session it swings because it has little data; by the end it barely moves.
Early-session VWAP: noisy. Late-session VWAP: heavy and stable.
That is genuinely useful. A late-session VWAP is a stable, meaningful level that a lot of participants are working against.
Difference 4 — somebody is measured against VWAP.
Nobody's bonus depends on the 50 EMA.
No institution judges its execution against a 50-period exponential moving average. There is no desk anywhere being told "you filled above the 20 EMA." But there are a great many people being measured against VWAP, right now, today.
That does not make moving averages useless — they are fine for smoothing and a quick visual read of trend, and lesson 5 covered exactly where they fail. But if you want a line that real orders cluster around, VWAP is the one with a mechanism behind it.
How I actually use it
- Session VWAP always on the execution chart. It costs nothing to have and it frames everything.
- First question each day: is price crossing it, or living on one side? Crossing means balance and mean-reversion tactics are allowed. One-sided means trend and fading is forbidden. That question decides which half of the toolkit I can use today.
- Weekly VWAP on the 1h chart, and onto the level map. Slow, stable, a proper level.
- An anchored VWAP from the last major swing that started the move I am trading — the battle line where the average participant flips between profit and loss.
- Bands for two things only: judging whether I am chasing (if price is at the second band and I am about to enter in that direction, I am late), and as reference points for taking profit. Never as reversal signals.
- Never trade VWAP alone.
VWAP is a level. Levels ask the question. Order flow answers it.
VWAP is family three of the level map. It goes on the chart, price comes to it, and then you do exactly what lesson 6 says: look at the footprint and find out whether anybody is actually defending it today. Same procedure, different level — and that consistency is the whole point of having a method.
Common mistakes
- Treating the deviation bands as walls. Fat tails exist; markets go past three sigma more often than the model allows.
- Fading a trend day because price is "stretched." Stretched is not finished.
- Trading the first thirty minutes of session VWAP as a level. It has almost no data in it yet.
- Setting the anchored-VWAP band multiplier and expecting bands. They are off by default, under Visibility.
- Putting five anchored VWAPs on one chart. If everything is a level, nothing is.
- Anchoring to a random candle. The anchor is the analysis.
- Taking a trade because price touched VWAP. It is a level, not a signal.
Your homework
About forty-five minutes.
- Do the VWAP arithmetic by hand for the three-trade example above, then for one real 15-minute candle group using the volume profile numbers. It stops being a black box permanently.
- Classify five recent days as balanced or trending using one criterion only: did price cross VWAP more than twice?
- Anchor a VWAP to the last major swing low or high and mark every time price interacted with it. Then compare that to the calendar session VWAP over the same period.
Open the terminal and add VWAP →
Three things to remember
- VWAP is a benchmark, not an indicator. It works because execution desks are measured against it, which produces real orders on each side of the line.
- The bands measure how stretched price is in this market's own units — and they are context, never commands. Markets have fat tails.
- Is price crossing VWAP or living on one side? That single question separates a mean-reversion day from a trend day, and it decides which tactics you are allowed to use.
← Previous: Volume Profile Trading Guide · Course index: Order Flow Trading Course · Next → Order Flow Support and Resistance
Frequently asked questions
How is VWAP calculated? VWAP multiplies each price by the volume traded at that price, sums those products, and divides by total volume: Σ(price × volume) ÷ Σ(volume). It accumulates from an anchor point such as the session open rather than rolling over a fixed window, so it becomes heavier and more stable as the session progresses.
What do VWAP standard deviation bands mean? They mark how far price is from VWAP measured in units of that market's own typical dispersion. The first band is roughly one standard deviation, the second two, and so on. They adapt automatically to volatility, so the same dollar distance can be "normal" on one day and "stretched" on another.
Why does price respect VWAP? Because institutional execution is benchmarked against it. Desks buying large positions are judged on whether their average fill beat the day's VWAP, so buying algorithms become more aggressive below it and less aggressive above it. The reaction comes from real orders, not from the line itself.
Where should I anchor an anchored VWAP? To a moment the market genuinely cares about: a major swing high or low, a breakout from a range, a large news or liquidation event, or the start of the current trend. Anchoring to an arbitrary candle produces a mathematically correct and completely meaningless line.
Is VWAP a good indicator for crypto? It works well in crypto because the markets are liquid and run continuously, but you must choose the day boundary deliberately — most order-flow traders use midnight UTC to match exchange days. The bands should be treated as context rather than reversal signals, since crypto has particularly fat tails.
What is the difference between VWAP and a moving average? A moving average weights every candle equally and rolls over a fixed window. VWAP weights by volume and accumulates from a fixed anchor before resetting. Most importantly, execution desks are measured against VWAP and nobody is measured against a moving average.
Can price go past the third VWAP deviation band? Yes, routinely. The 68/95/99.7 figures come from a normal distribution, and financial markets have fat tails — extreme moves occur far more often than that model implies. Trading against a trend because price reached a band is one of the more reliable ways to lose money.
Sources
- Investopedia — VWAP
- Investopedia — standard deviation
- CME Group Education — execution and order types
Soroosh Moghimi — six years inside financial markets: algorithmic trading, HFT, crypto and AI, after a decade building startups. He publishes this course free because he already paid for the lessons in it. There is no paid course and no signal group. @sorooshmoghimi · About
Start reading real order flow
You cannot learn this from a candlestick chart, and you do not need to spend a cent to begin. The standard footprint chart is free for every NOROVIEW user, market replay is free, and the paper-trading simulator is free.
Open NOROVIEW free → · Compare plans →
⚠️ DISCLAIMER — EDUCATIONAL CONTENT ONLY
This article is for educational and informational purposes only. It is not financial, investment, or trading advice, and nothing in it is a recommendation to buy, sell, or hold any asset. Trading cryptocurrencies and leveraged derivatives is high risk and can result in the loss of some or all of your capital. Only risk money you can afford to lose. Any levels, indicators, signals or results shown are illustrative and are not a promise or prediction of future performance. Charts may be shown on a demo or paper-trading account and do not represent real trades or returns. Always do your own research. You alone are responsible for your decisions.
Keep reading
Related posts

16. Trade Management: Break-Even, Partials and Trailing Stops
Trade management explained: when break-even stops cost you money, partial exits, four kinds of trailing stop, the order-flow exit, and diagnosing yourself with MFE and MAE.

15. How to Day Trade Crypto With Order Flow (Starting Small)
How to day trade crypto with order flow: exchange security, spot vs perpetuals, leverage and liquidation, order types, fees, and an honest $100 starting plan.

14. Risk, Drawdown and the Mind: Day Trading's Real Edge
Day trading risk management and psychology: position sizing math, drawdown recovery arithmetic, hard limits, decision vs outcome, and the five states that break traders.

13. Fair Value Gaps, Confirmed With Order Flow
Most fair value gaps do nothing. Five order-flow checks that tell you in advance which FVGs are worth trading and which are decoration.

5. Market Structure and Trend: How to Pick Your Side Objectively
How to identify market structure objectively: higher highs and higher lows, swing point rules, impulse vs correction, and the arithmetic behind trading with the trend.
11. My Order Flow Entry Model, Step by Step
A complete order flow entry model: the four conditions, the exact trigger candle, the value-area filter, and the ten-item blocker list that vetoes a trade.
Discussion (0)
Want to join the discussion? Comments live inside the platform.
Open NOROVIEW