
10. Absorption, Exhaustion, Icebergs, Imbalance and Traps
The five order flow events that move markets: absorption, exhaustion, icebergs, imbalance and unfinished auctions — what each looks like and how to tell them apart.
10. Absorption, Exhaustion, Icebergs, Imbalance and Traps
Two candles. Both made a new low. Both closed green. Both look like a reversal. One is one of the highest-probability long setups in trading; the other is a trap that will take your money and then keep going down. The difference is entirely in what happened at the low — and on a normal chart that difference does not exist.
This is the vocabulary lesson. Absorption. Exhaustion. Icebergs. Imbalances. Unfinished auctions. Five events, and everything in the remaining lessons is built out of these five words.
Open a footprint chart — every pattern here is visible on the free plan.
What you'll learn in this lesson
- The five events that actually move markets, and why they are not chart patterns
- What is physically happening in the order book for each one
- The four conditions that make absorption a signal rather than an observation
- Why absorption and exhaustion look identical and must be traded differently
- How to catch an iceberg — a genuine information leak
- Diagonal imbalance, stacked imbalance zones, and why the defaults show you nothing
- Unfinished auctions, poor highs, and why a flat triple top is weak
- Where all five lead: trapped traders
Lesson 10 of 16 · Part 2 — Technique. Part of the free order flow trading course. Previous: Order Flow Support and Resistance. Next: My Order Flow Entry Model.
▶ Prefer to watch it?
Order-Flow Imbalance, Unfinished Auction & Trapped Traders (Ep 15) covers three of the five events on a live chart. Icebergs, spoofs and the heatmap: Liquidity Heatmap, Big Trades & Live Order Book (Ep 16) · 40 seconds on traps: The indicator that hunts trapped traders
The five events
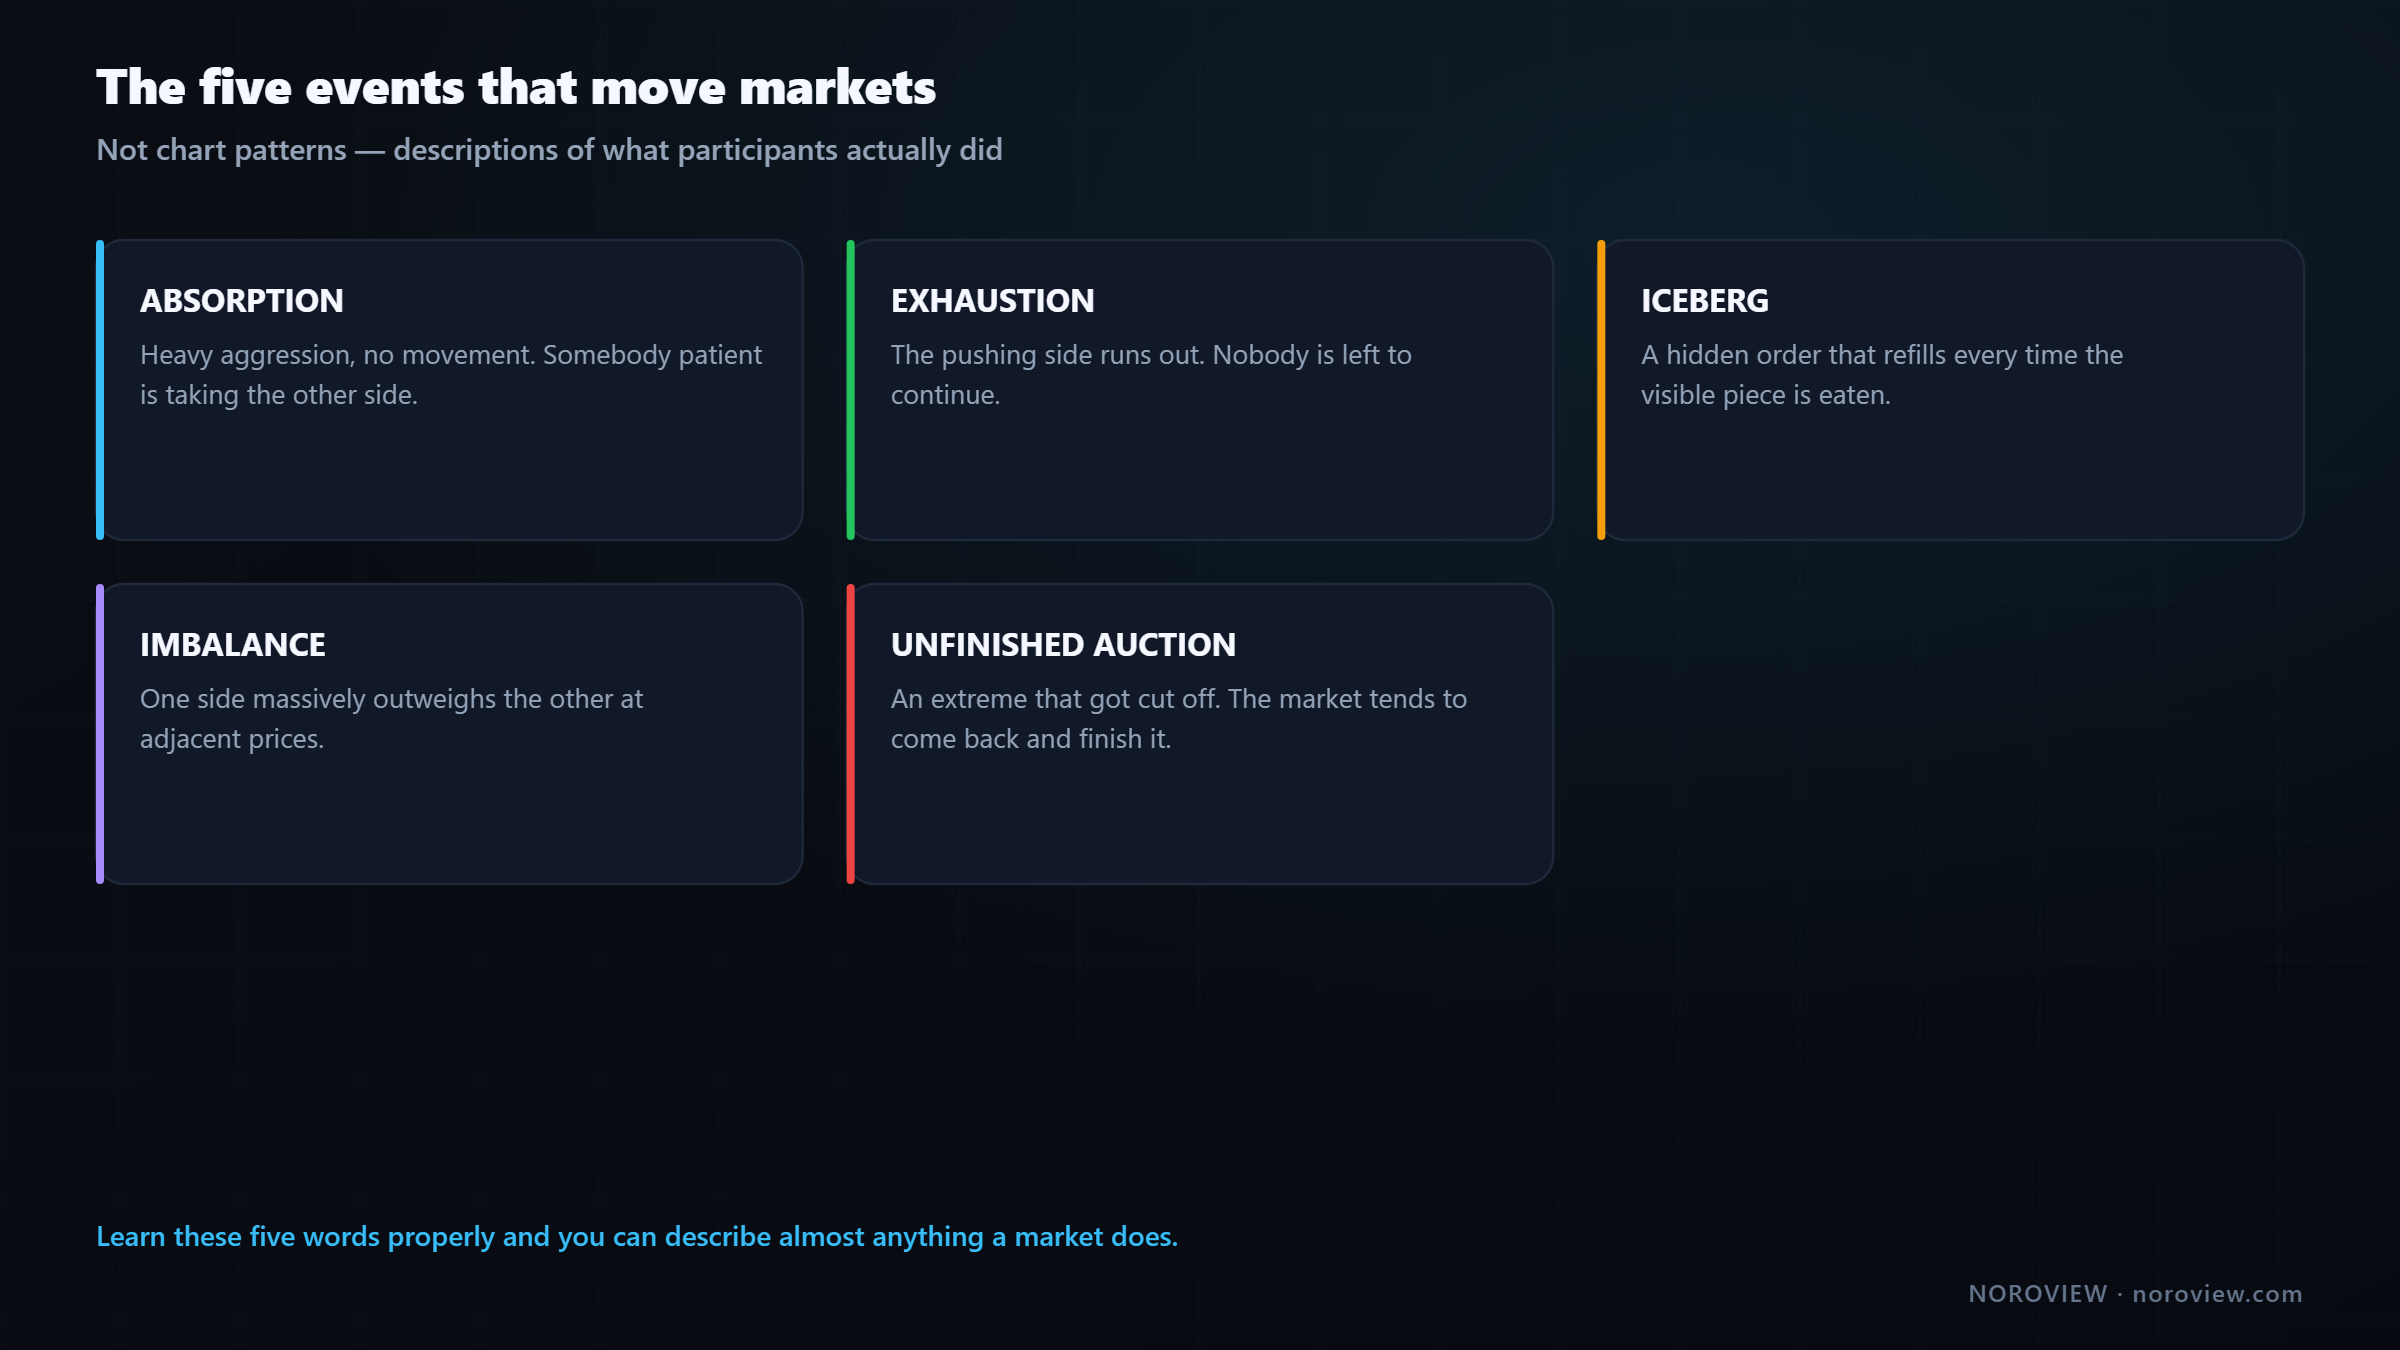
| Event | What it is |
|---|---|
| Absorption | Heavy aggression, no movement — someone is taking the other side |
| Exhaustion | The pushing side runs out — nobody left to continue |
| Iceberg | A hidden order that keeps refilling |
| Imbalance | One side massively outweighs the other at adjacent prices |
| Unfinished auction | An extreme that got cut off — the market wants to come back |
Notice these are not chart patterns. No triangle, no flag, no head and shoulders. They are descriptions of what participants did — a completely different kind of thing, and the reason they hold up across markets and across decades.
Each one gets taught the same way: what is physically happening in the order book, what it looks like in the footprint, and how to find it automatically.
Absorption
What is physically happening
Aggressive sellers are hitting the bid, hard, with real size. Under normal conditions that pushes price down — aggression consumes resting orders and price moves. But price is not moving, because somebody is sitting there with passive buy orders, absorbing every one of those sells.
Aggression is arriving. Someone patient is taking all of it.
The hammer keeps hitting. The wall does not move.
The key point — the one that makes it tradeable — is who these two participants are. The aggressive sellers are paying the spread, over and over, to get filled immediately. They are in a hurry, and hurry usually means emotion, forced selling, or a short-term algorithm. The passive buyer is doing the opposite: they placed limit orders and let the market come to them. They chose their price. They are patient, almost certainly larger, and they wanted this price specifically.
Impatient size loses to patient size. Almost always.
What it looks like in the footprint
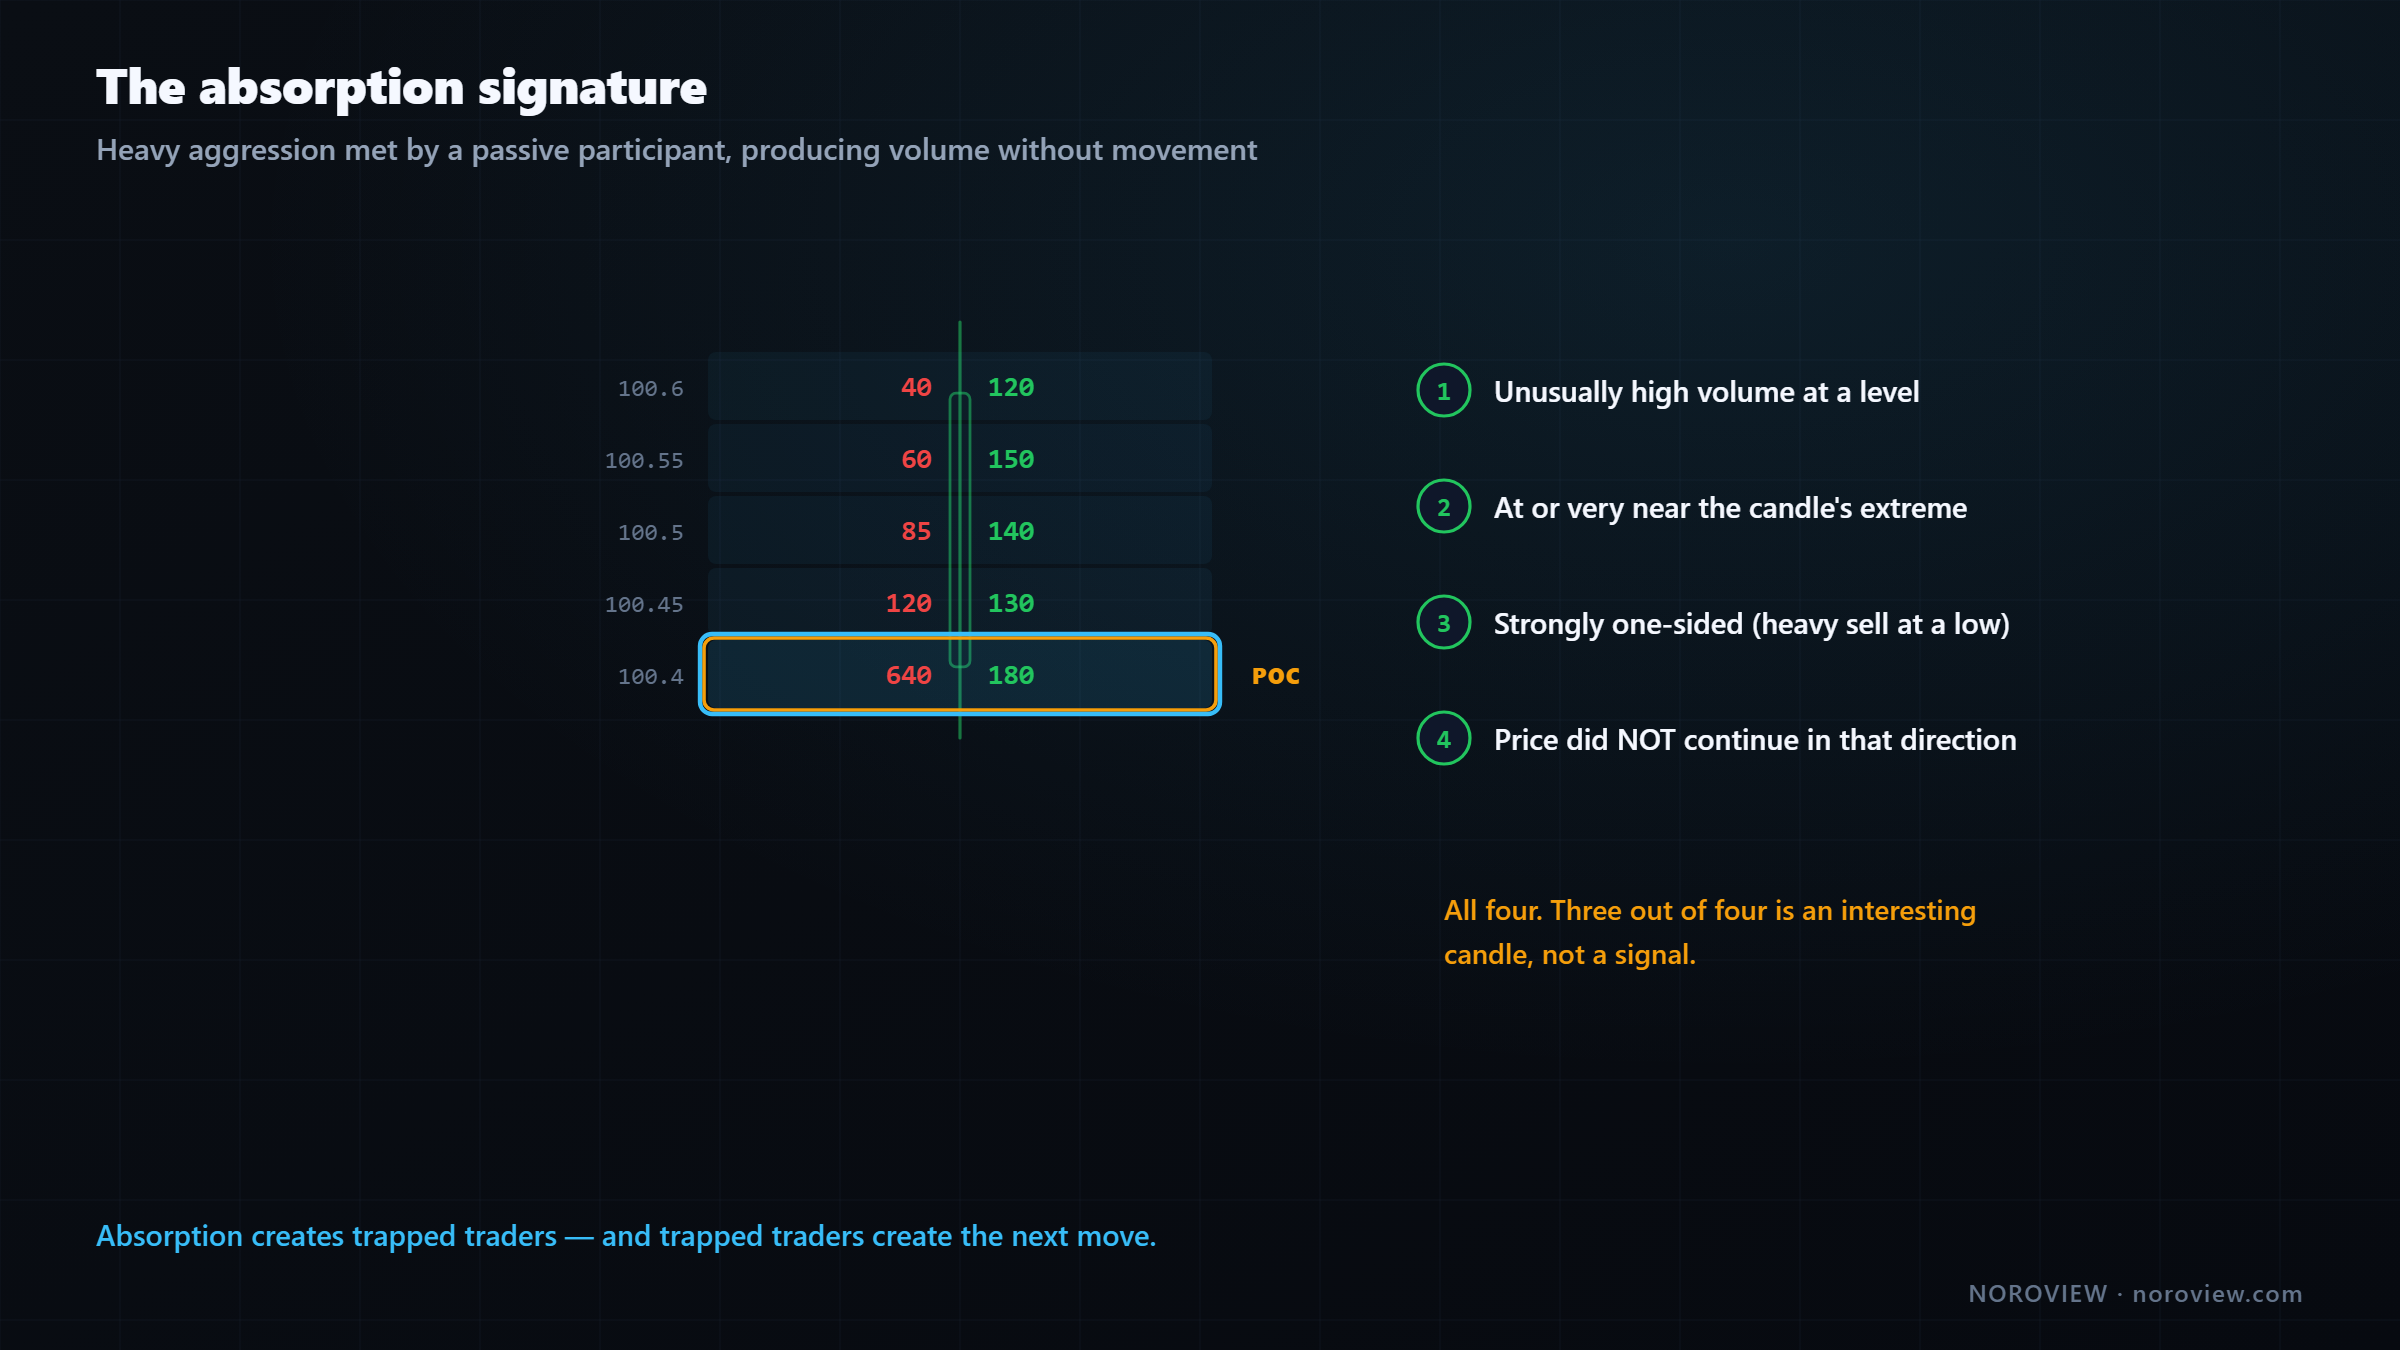
The four conditions — you need all four:
- Unusually high volume at a level
- At or very near the candle's extreme
- Strongly one-sided — heavy selling at a low, heavy buying at a high
- Price did NOT continue in that direction
Three of these gives you an interesting candle, not a signal. And the fourth — price did not continue — is the one people skip. It is also the one that makes the difference: heavy selling that produced a big down move is not absorption, it is just selling, and it worked.
One more check that separates good absorption from noise: is there also elevated average trade size? If the absorbing is being done in big pieces you are watching one large participant. If the same volume came from a thousand tiny trades you are watching a crowd — and crowds do not defend levels.
Absorption + high ATS = one big participant. That is the good version.
Why it produces a move
| Who | What they have now |
|---|---|
| The aggressive sellers | Spent money, got nothing, and are now underwater |
| The passive buyer | A large long position at a price they chose |
The aggressive sellers are short from a price that has not gone down. Every one of them is watching a losing position and thinking about the exit — and their exit is a buy. Meanwhile the absorber holds a large long position at their chosen price and a very strong interest in defending it.
One group must eventually buy to escape. One large participant wants price up.
That is your move. Not magic. Mechanics.
How to trade it
| Entry | After the absorption confirms — price holding above the absorbed level |
| Stop | Below the absorbed level. If it breaks, the absorber failed |
| Target | The next level up from your map |
The stop placement is the elegant part. Your entire idea is "somebody big defended this price." The moment price trades meaningfully below that price, the idea is not "probably wrong" — it is factually dead. The thing you observed has failed.
That gives you a stop with an actual meaning, and it is usually tight, because the absorption level is right there. Tight stop plus a real reason equals good reward-to-risk. That combination is rare, and it is what you are hunting for.
The warning:
Absorption in the middle of nowhere is just two traders arguing.
Absorption at a level from your map is a trade. Absorption in the middle of a range is an observation. The level is what makes other participants care.
▶ Try this now
Open Market Replay, pick a random moment, and step forward one candle at a time until you find a candle with a big one-sided number at its extreme. Then check condition four: did price continue? Most will have. The ones that did not are what you are learning to see. Launch NOROVIEW free →
Exhaustion — and why it is not absorption
This is the distinction almost nobody teaches properly, and it matters enormously.
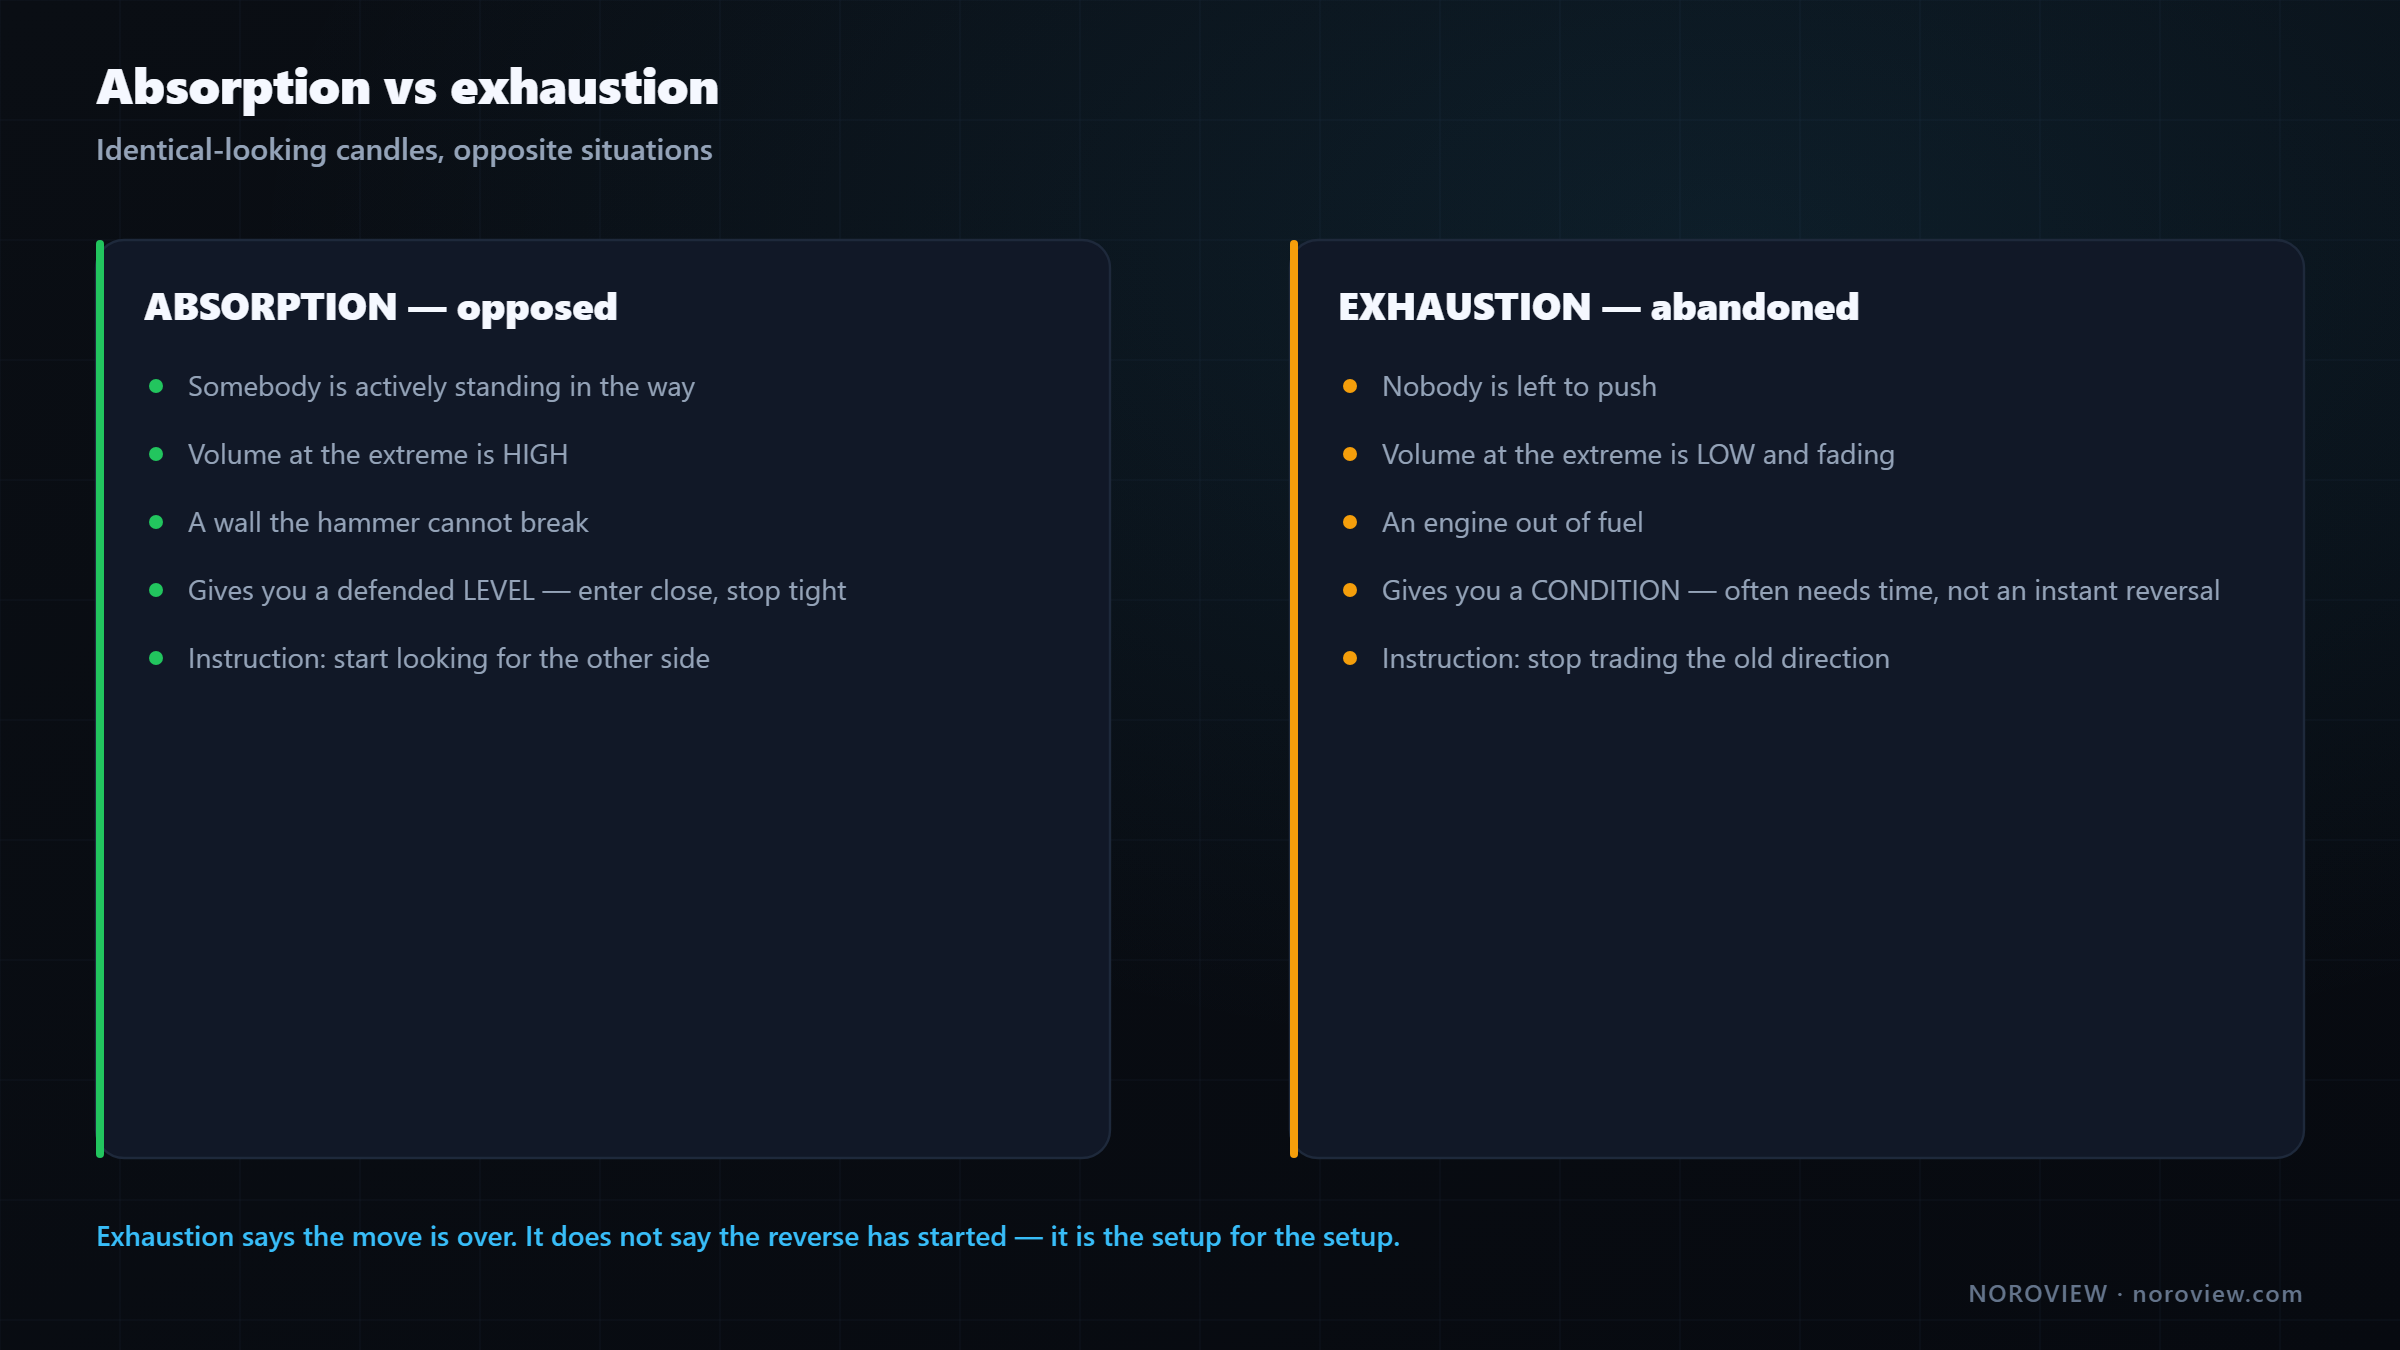
| Absorption | Exhaustion | |
|---|---|---|
| What is happening | Someone is taking the other side | Nobody is left to push |
| Volume at the extreme | High | Low and fading |
| The metaphor | A wall | An engine out of fuel |
Absorption = opposed. Exhaustion = abandoned.
The visual tell. In exhaustion, price makes new lows but the volume at each new low gets smaller. Each push down is being done by less and less selling. That is not somebody defending — that is the sellers finishing. They have all sold; nobody is left to hit the bid.
There is a second signature on the delta side: price makes a new low, delta does not make a new low. The move is still going, on less and less fuel. That is the divergence idea applied to an extreme, and CVD makes it visible directly.
They are traded completely differently
ABSORPTION → a strong, defended level. Enter close, stop tight, expect a reaction. EXHAUSTION → a move running out. Often needs TIME. Do not expect an instant reversal.
Absorption gives you a level. Somebody defended a specific price, so you have a line to trade against and a tight stop.
Exhaustion gives you a condition. Nobody is pushing any more — but "nobody is selling" does not mean "buyers have arrived." Very often after exhaustion price simply goes quiet and drifts sideways, sometimes for a long time, before anything happens.
Exhaustion says the move is over. It doesn't say the reverse has started.
That is the mistake: seeing exhaustion and immediately buying, expecting a V-shaped reversal. What usually needs to happen first is that price stops going down, builds a base, and then shows you absorption or aggressive buying at that base. Exhaustion is the setup for the setup.
My practical rule:
Exhaustion = stop looking for shorts. Absorption = start looking for longs.
Two different instructions, arriving at two different times.
Icebergs and spoofs
Event three lives in the order book rather than the footprint.
Iceberg: an order that shows a small piece and refills every time it is eaten.
Think about the problem a large participant has. They want to buy a very large amount at a specific price. Put the whole order in the book and everybody sees it, and the market front-runs them — price never comes back down to them. So they use an iceberg: the order displays a small piece, and every time that piece is eaten it automatically refills from the hidden quantity behind it. You see ten units. Behind them, two thousand.
How to spot one
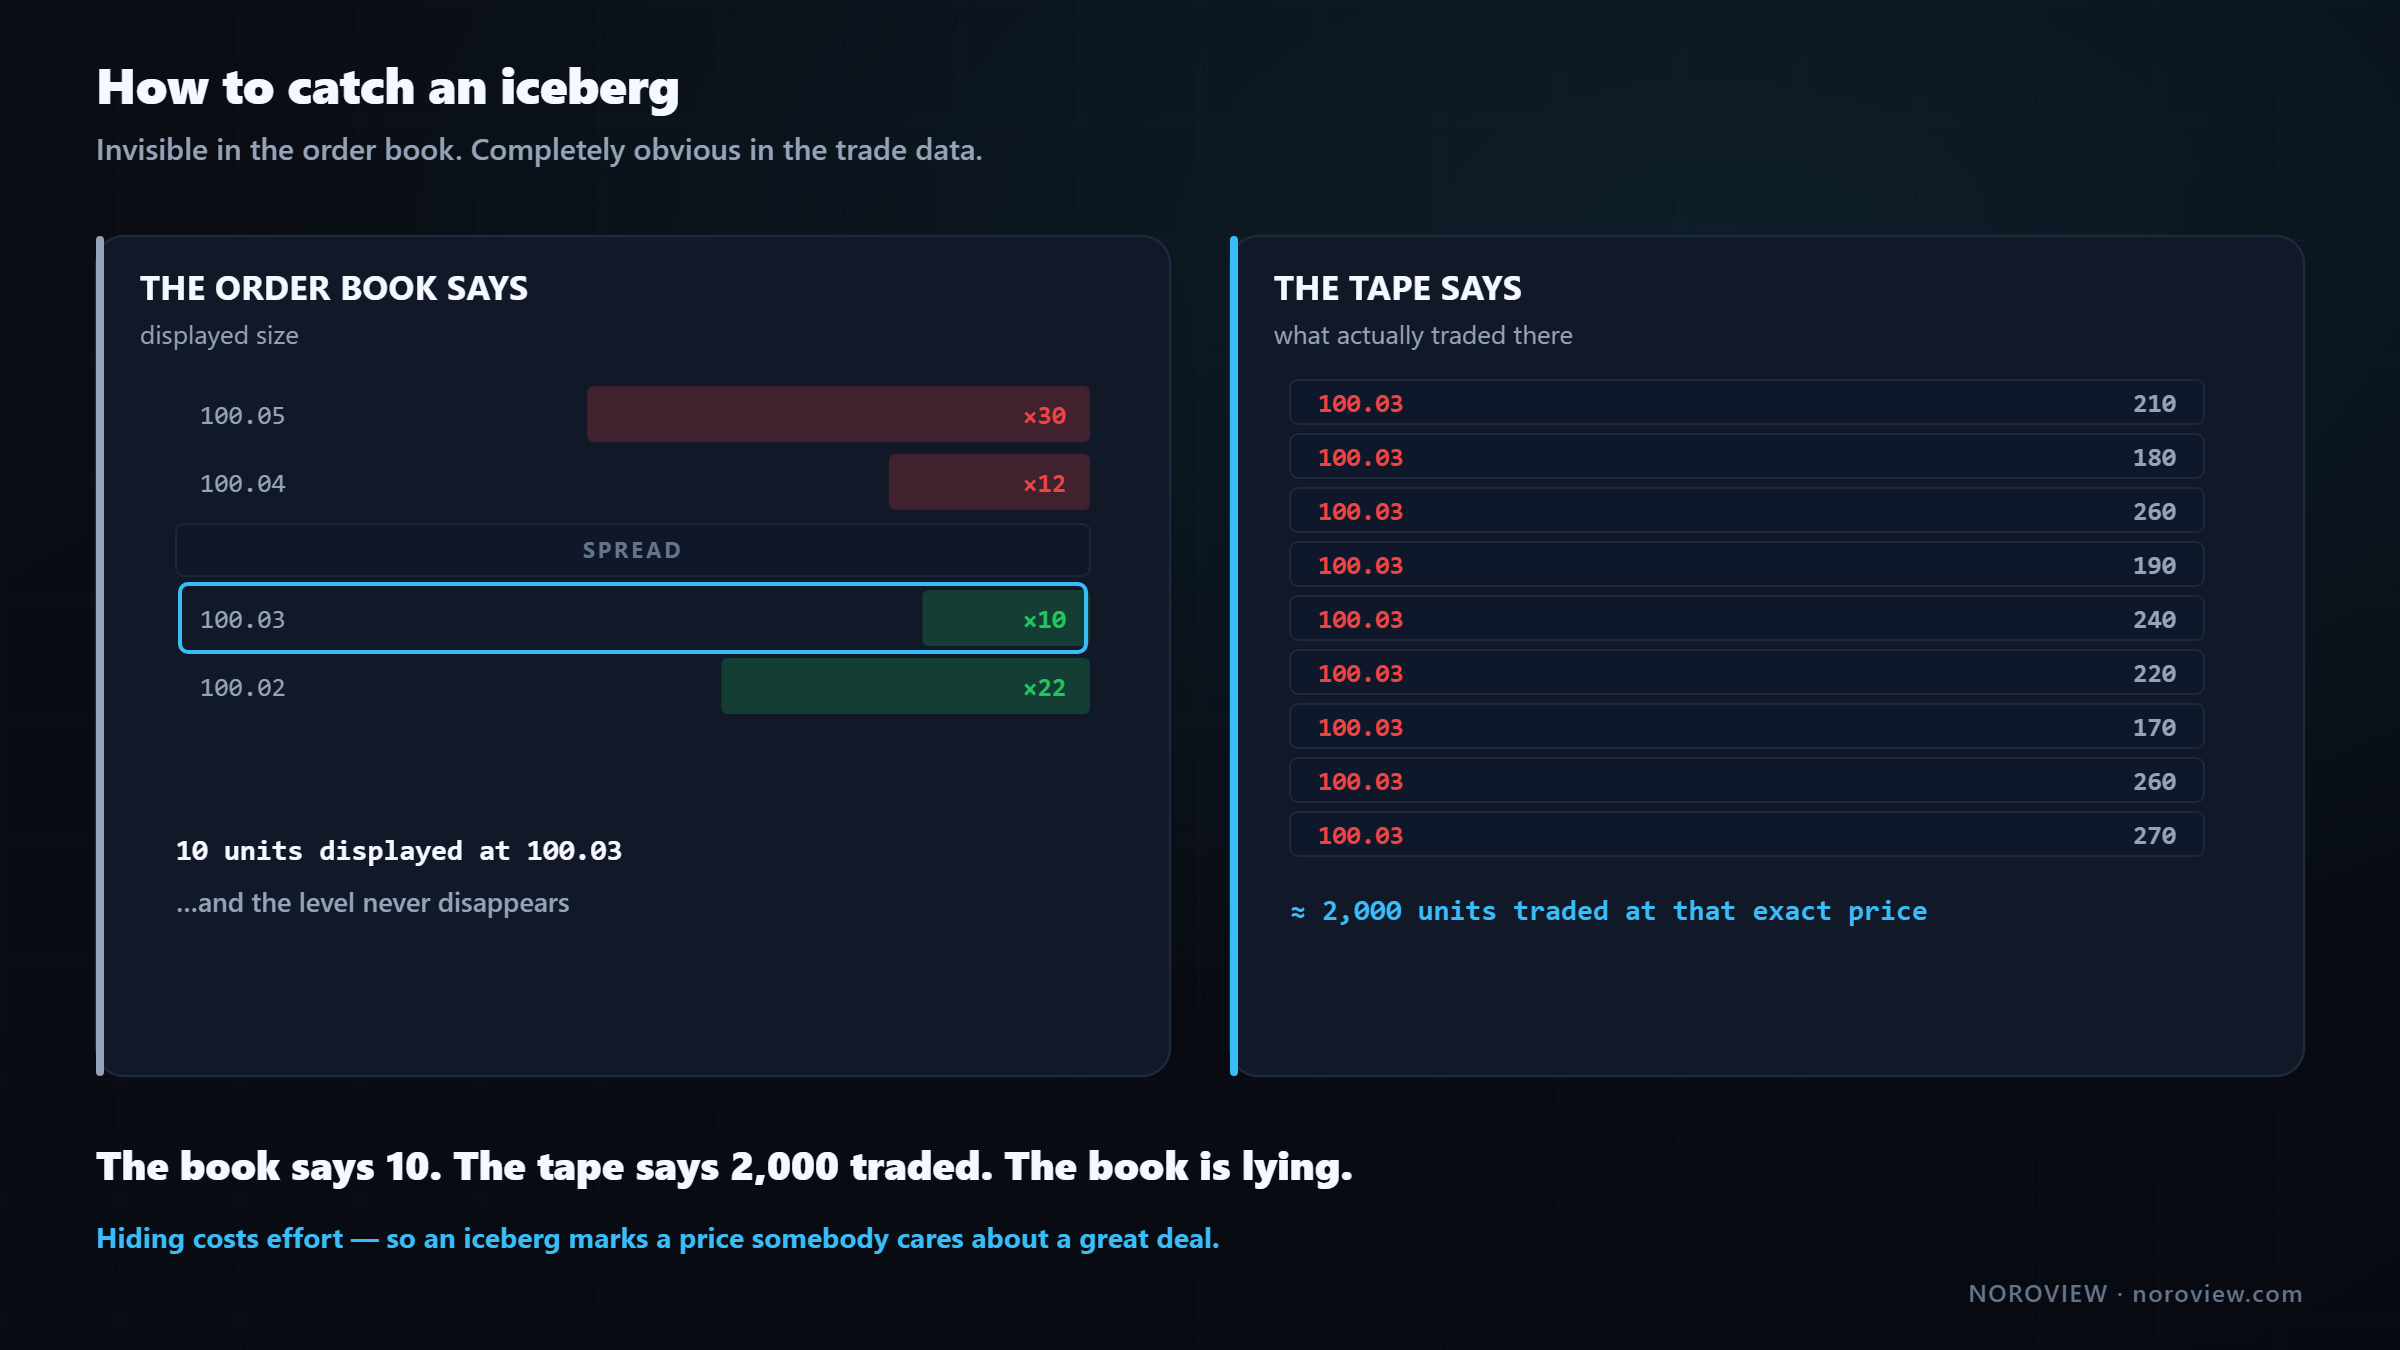
Watch a price level that shows a small size. Then watch the tape and count what actually trades at that price. When you see far more volume trading at a level than the book ever displayed — and the level does not disappear — that is an iceberg.
This is exactly the point from lesson 2: the book shows intentions and intentions can be hidden. Trades cannot. An iceberg is invisible in the book and completely obvious in the trade data. The hiding technique defeats one instrument and exposes itself completely to the other.
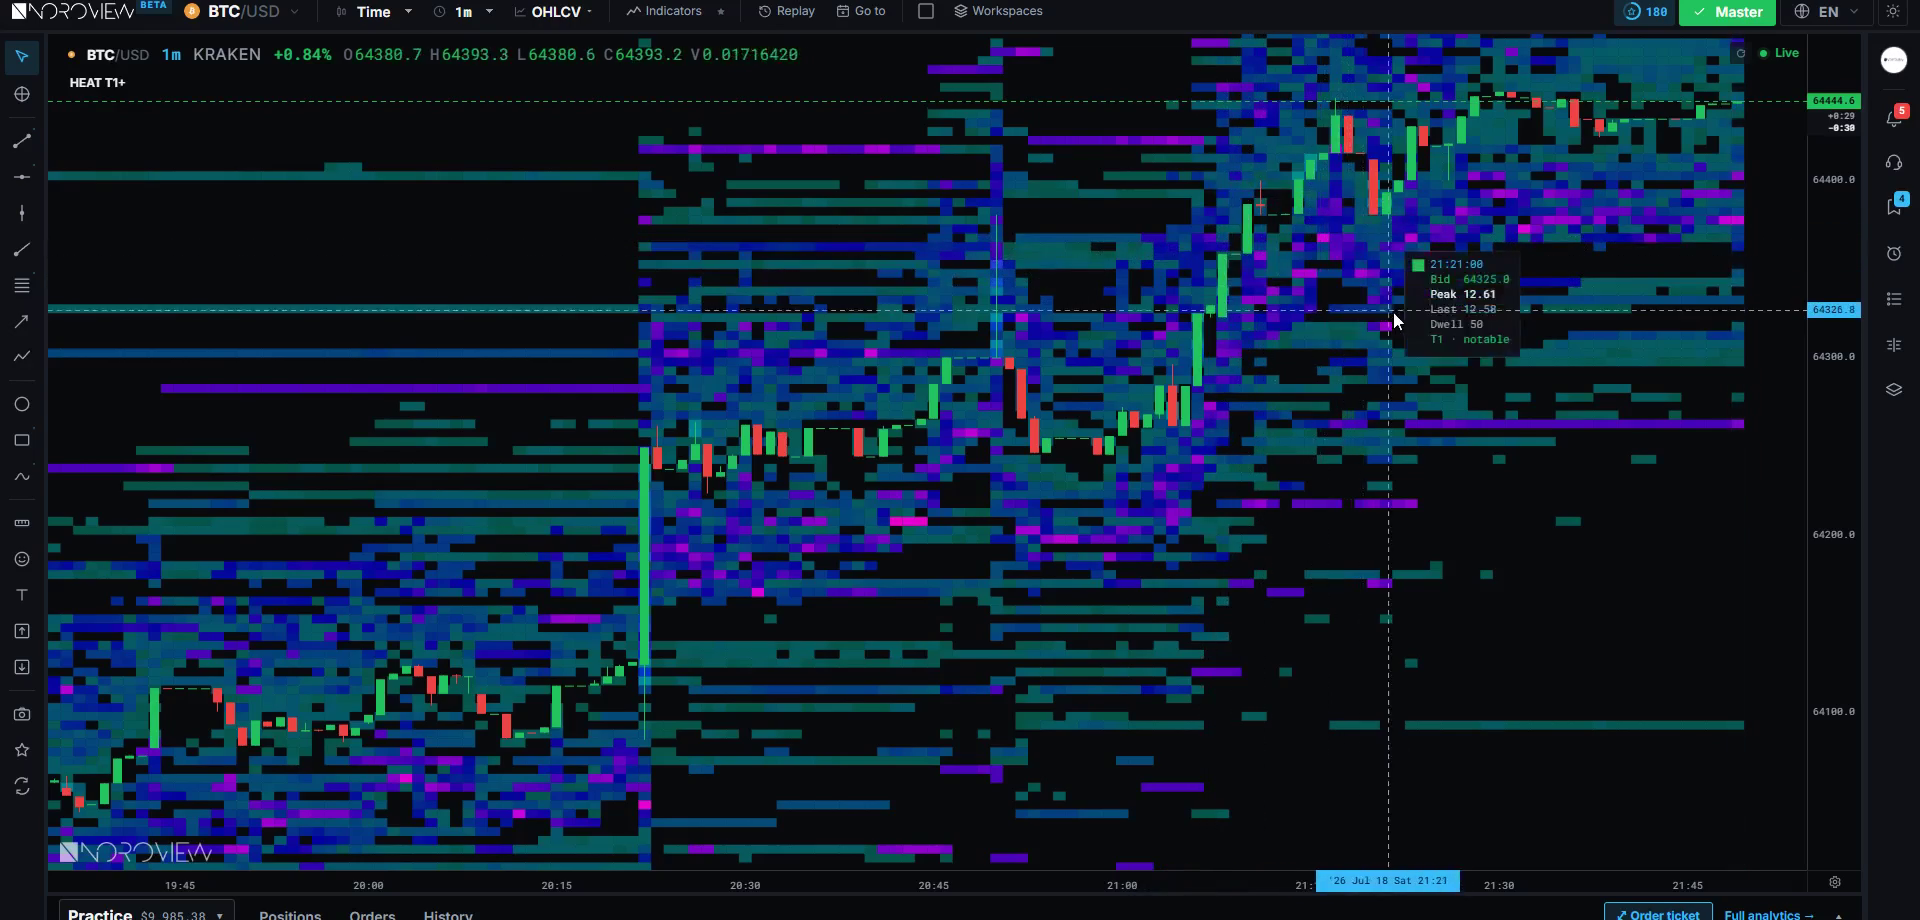
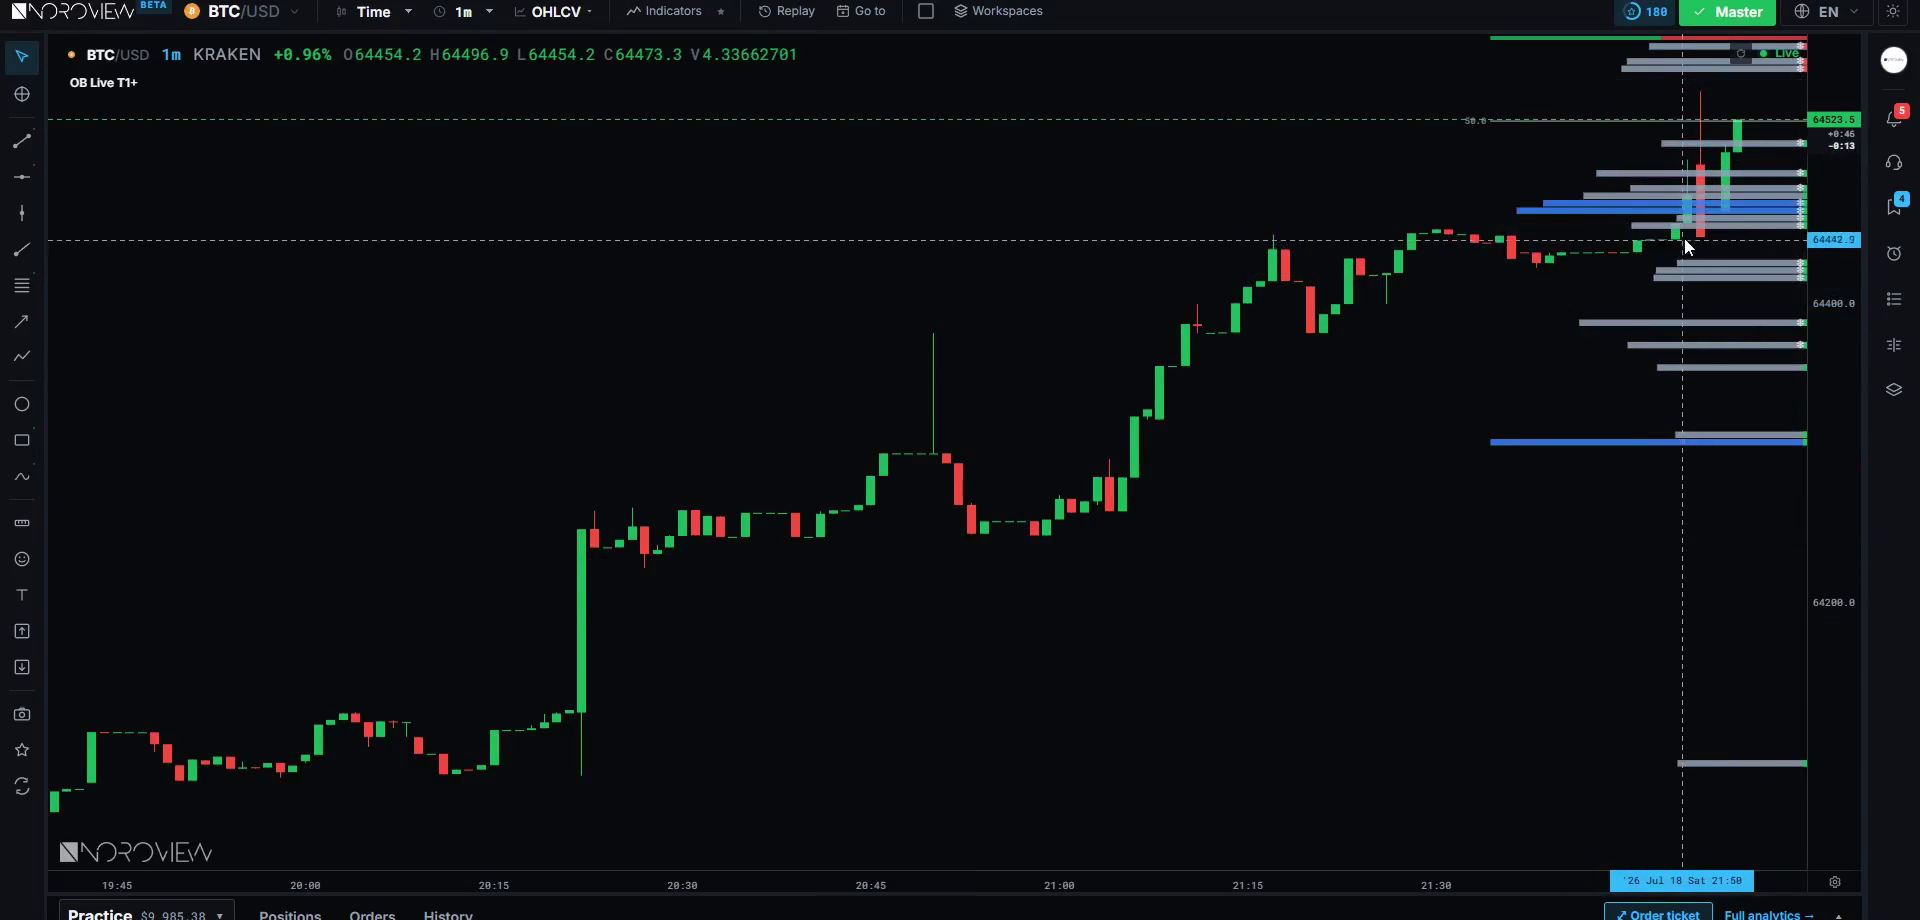
NOROVIEW's Smart Orderbook — Live (top-tier paid) flags these for you as a depth ledge beside the price axis showing only the abnormal resting levels, with an iceberg badge when a level keeps refilling after being eaten. It also marks walls with rays across the chart and shows spoof ghosts.
Spoofs are the opposite
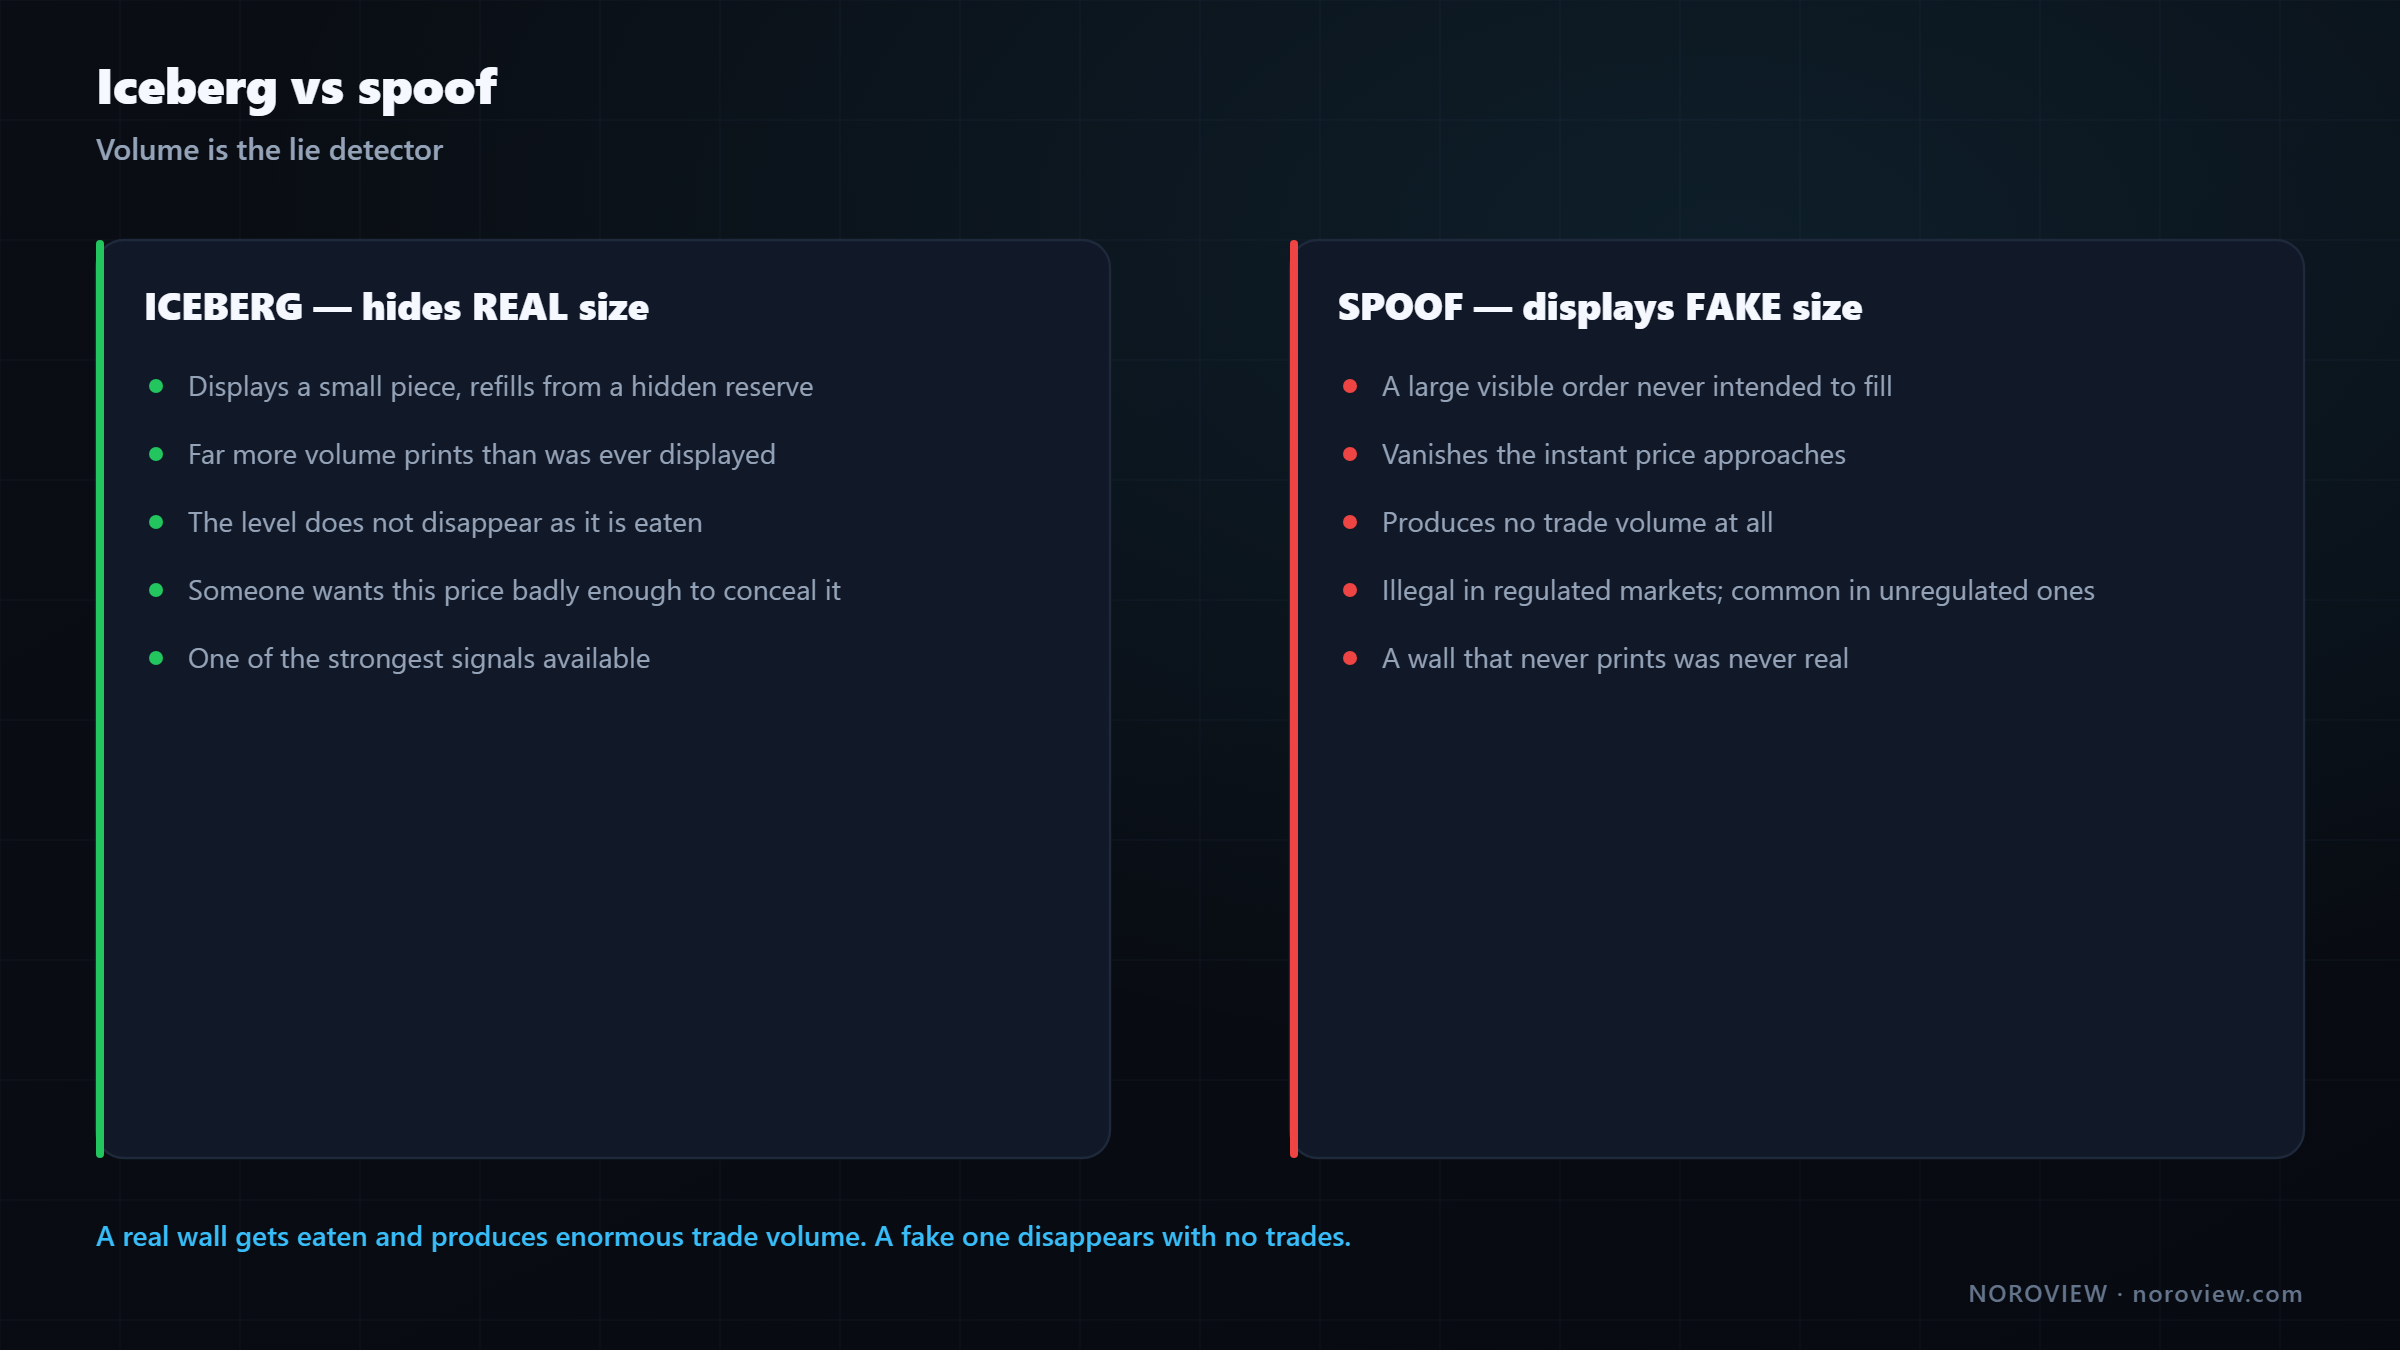
Spoof: a big order pulled the instant price approached. Never intended to fill.
An iceberg hides real size. A spoof displays fake size. Somebody puts a large visible order in the book, you see a wall and adjust your behaviour, and the moment price approaches it vanishes. It was never going to fill. In regulated markets this is illegal — the CFTC has brought a series of spoofing enforcement actions — and in unregulated venues it is common.
Two things to take from this:
1. When you see a big wall, do not assume it is real. A real wall gets eaten and produces enormous trade volume. A fake one disappears with no trades at all. Volume is the lie detector.
2. An iceberg is one of the strongest signals you can get, because hiding costs effort. Nobody sets up an iceberg to buy a small amount. If somebody has gone to the trouble of hiding, they have size worth hiding — and they chose that price deliberately.
An iceberg is a price someone cares about enough to hide their interest.
One honest limitation: the smart order book is live only. It shows the book right now; it cannot go back and show you the book from Tuesday. For history you use trade data and the liquidity heatmap. So icebergs are something you catch live, not something you research afterwards.
Watch liquidity build, hold, and vanish — in a browser tab
Footprint charts and market replay are free. The Level 2 heatmap and smart order book sit on the higher plans. Create a free account → · Compare plans
Imbalances
Event four is pure footprint (advanced, paid indicator).
An imbalance compares two cells diagonally — not the two numbers in the same row.
Compare the BUYING at one price against the SELLING at the price just below.
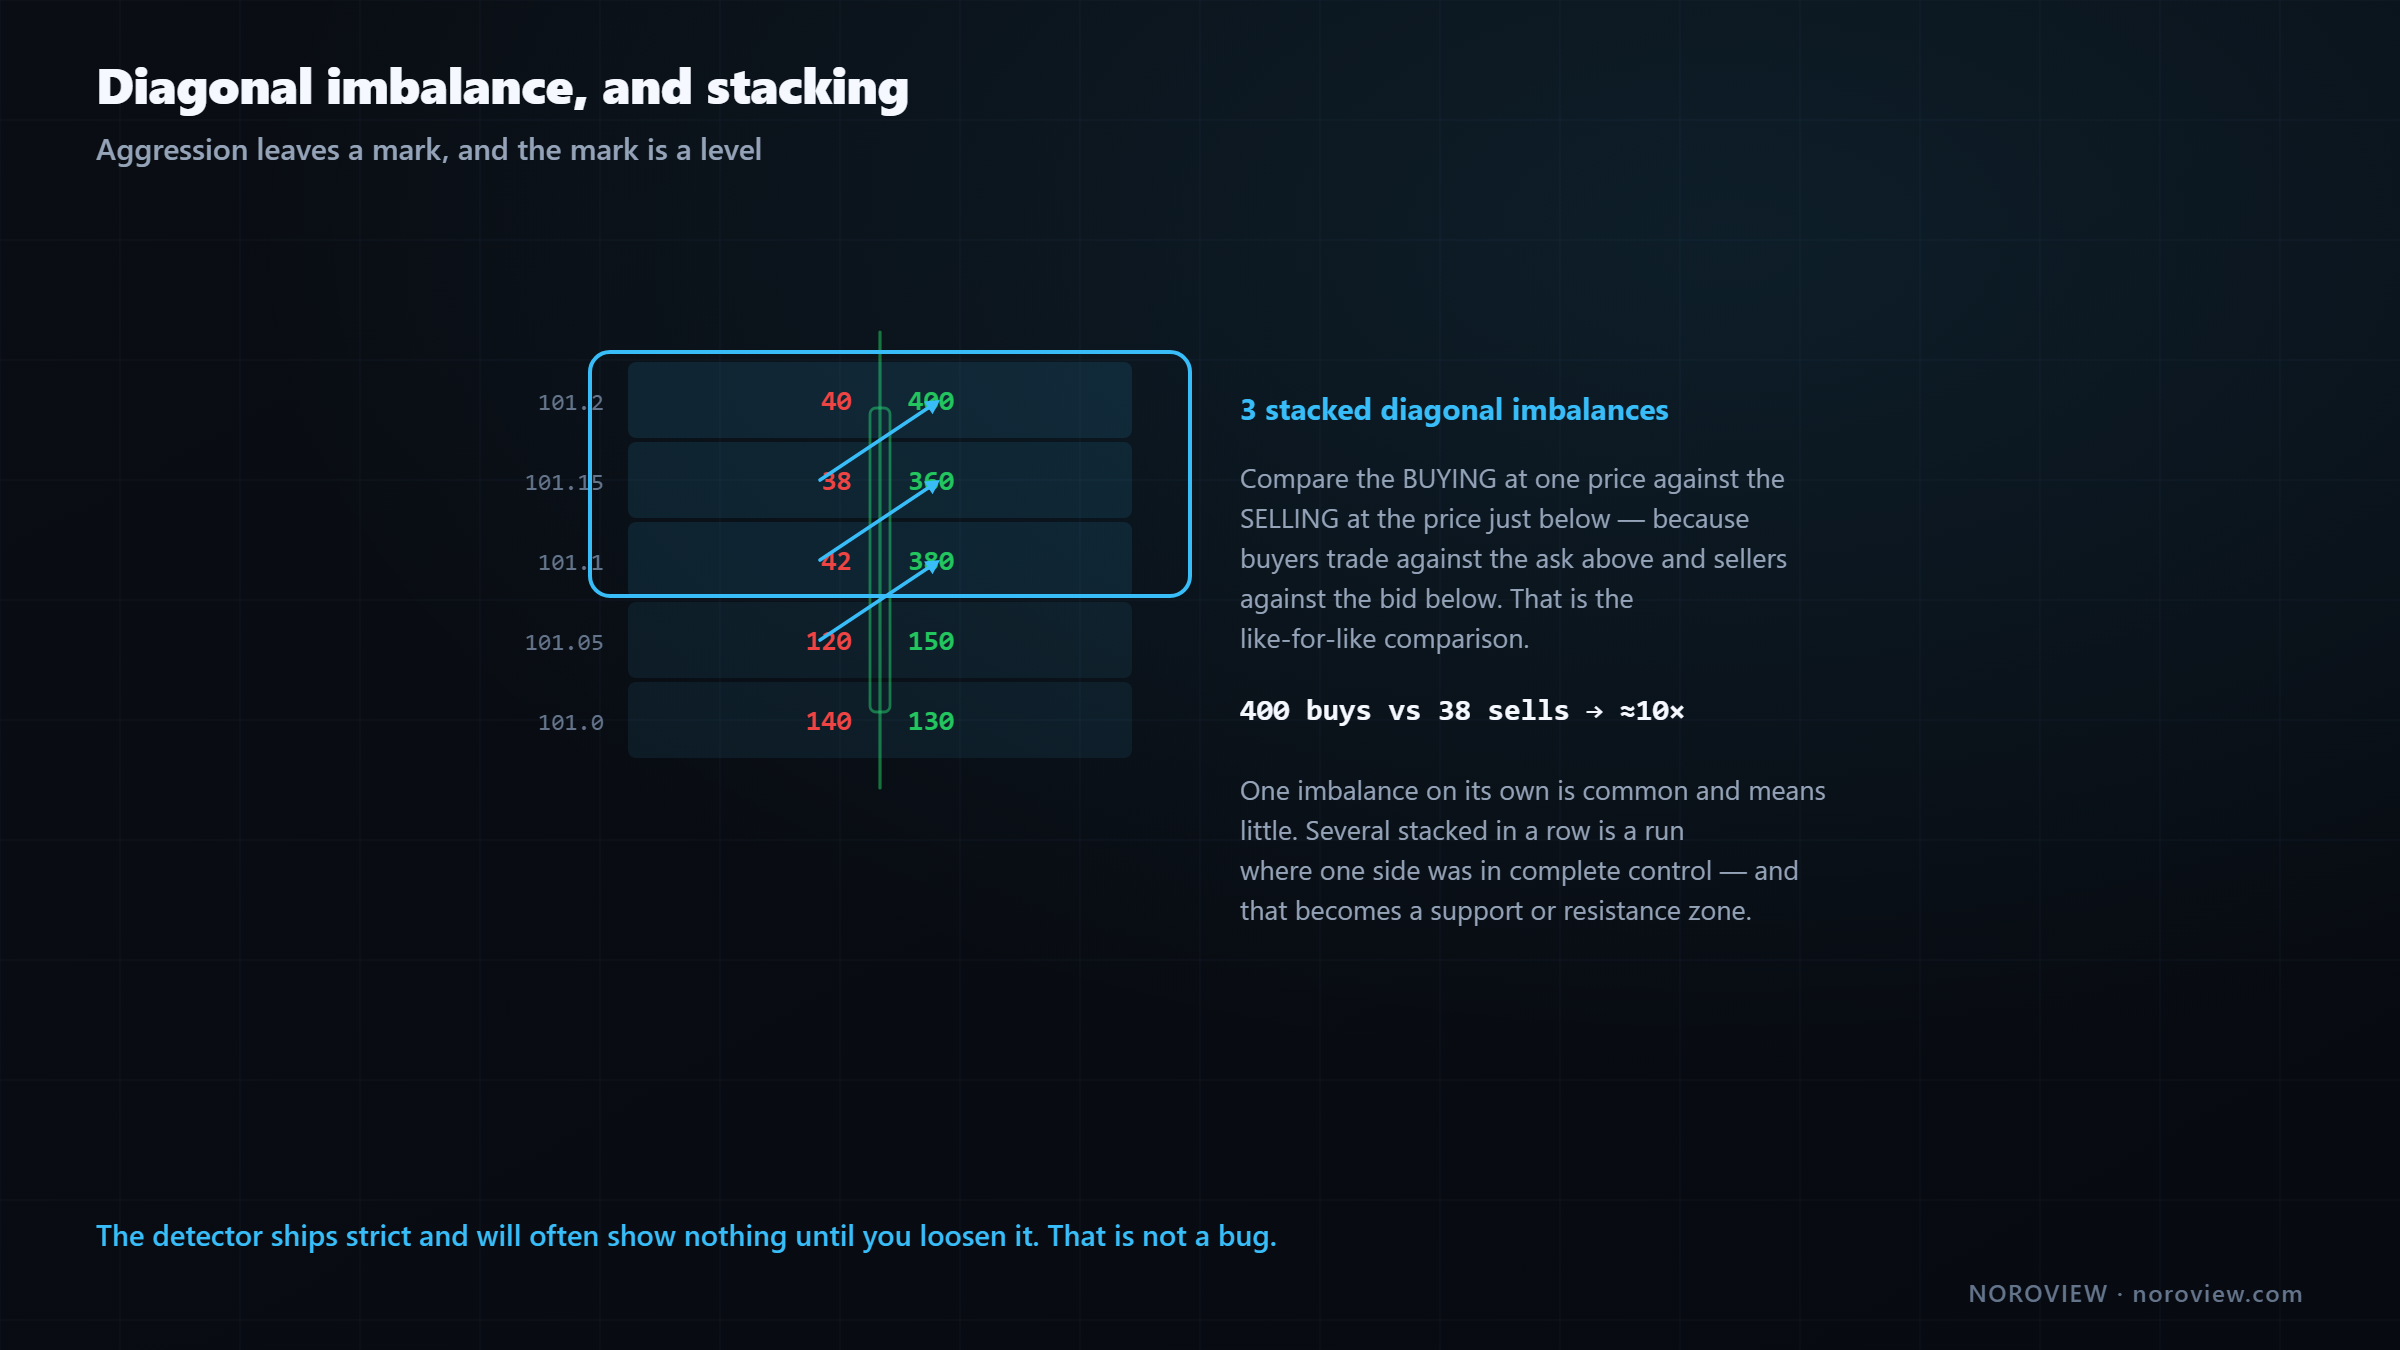
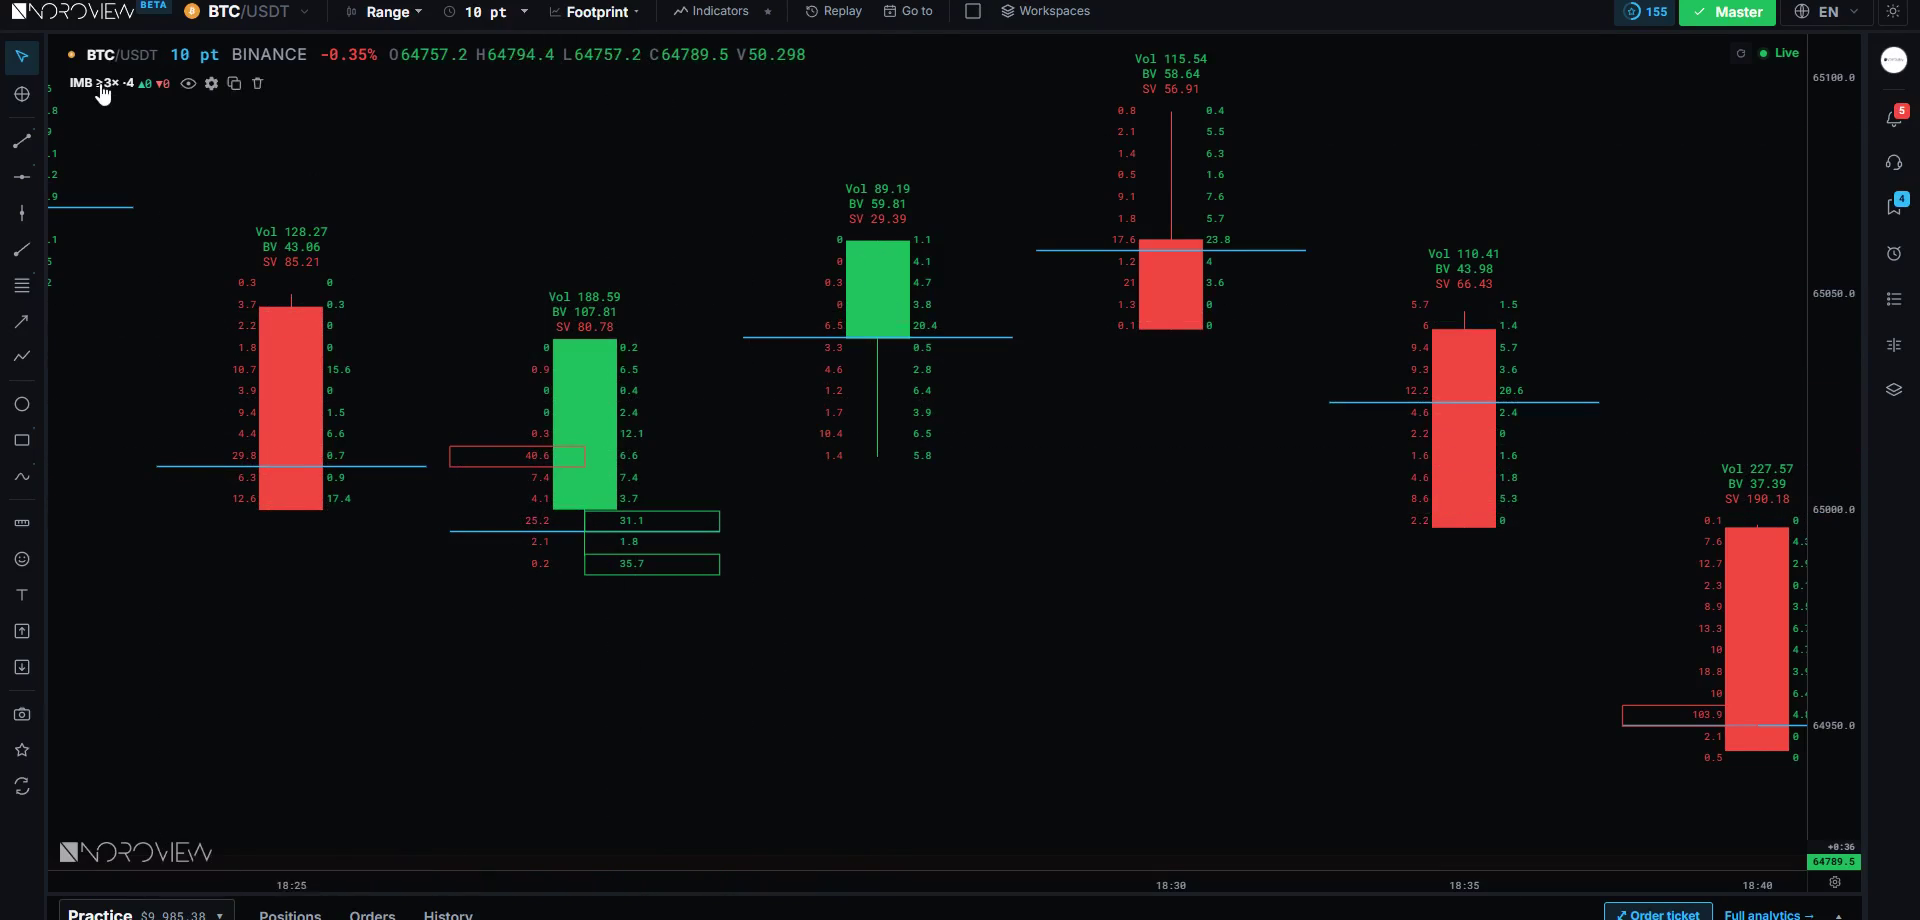
Why diagonally? Because of the mechanics: aggressive buyers trade against the ask, which sits above; aggressive sellers trade against the bid, which sits below. So the like-for-like comparison is diagonal — the buying at one price against the selling at the price beneath it.
When one side massively outweighs the other on that diagonal — say 400 buys against 40 sells, a 10× ratio — that is a diagonal imbalance. At those two adjacent prices, one side was overwhelmingly dominant.
Stacking is what matters
One imbalance on its own is common and does not mean much.
Several imbalances stacked in a row = a zone of one-sided aggression.
When several consecutive price levels are all imbalanced in the same direction, that is a run where one side was in complete control. Those stacks become support and resistance zones, because that is where the aggression came from — and if price returns there, the same participants often defend it.
The settings, and an important reality
- Ratio — how lopsided it must be. 3 means 300%: one side is three times the other.
- Min volume — the size floor, either a manual number or one of the named tiers. Stops it flagging imbalances between two tiny numbers.
- Min stack for a zone — how many consecutive imbalanced levels are needed before a zone is drawn.
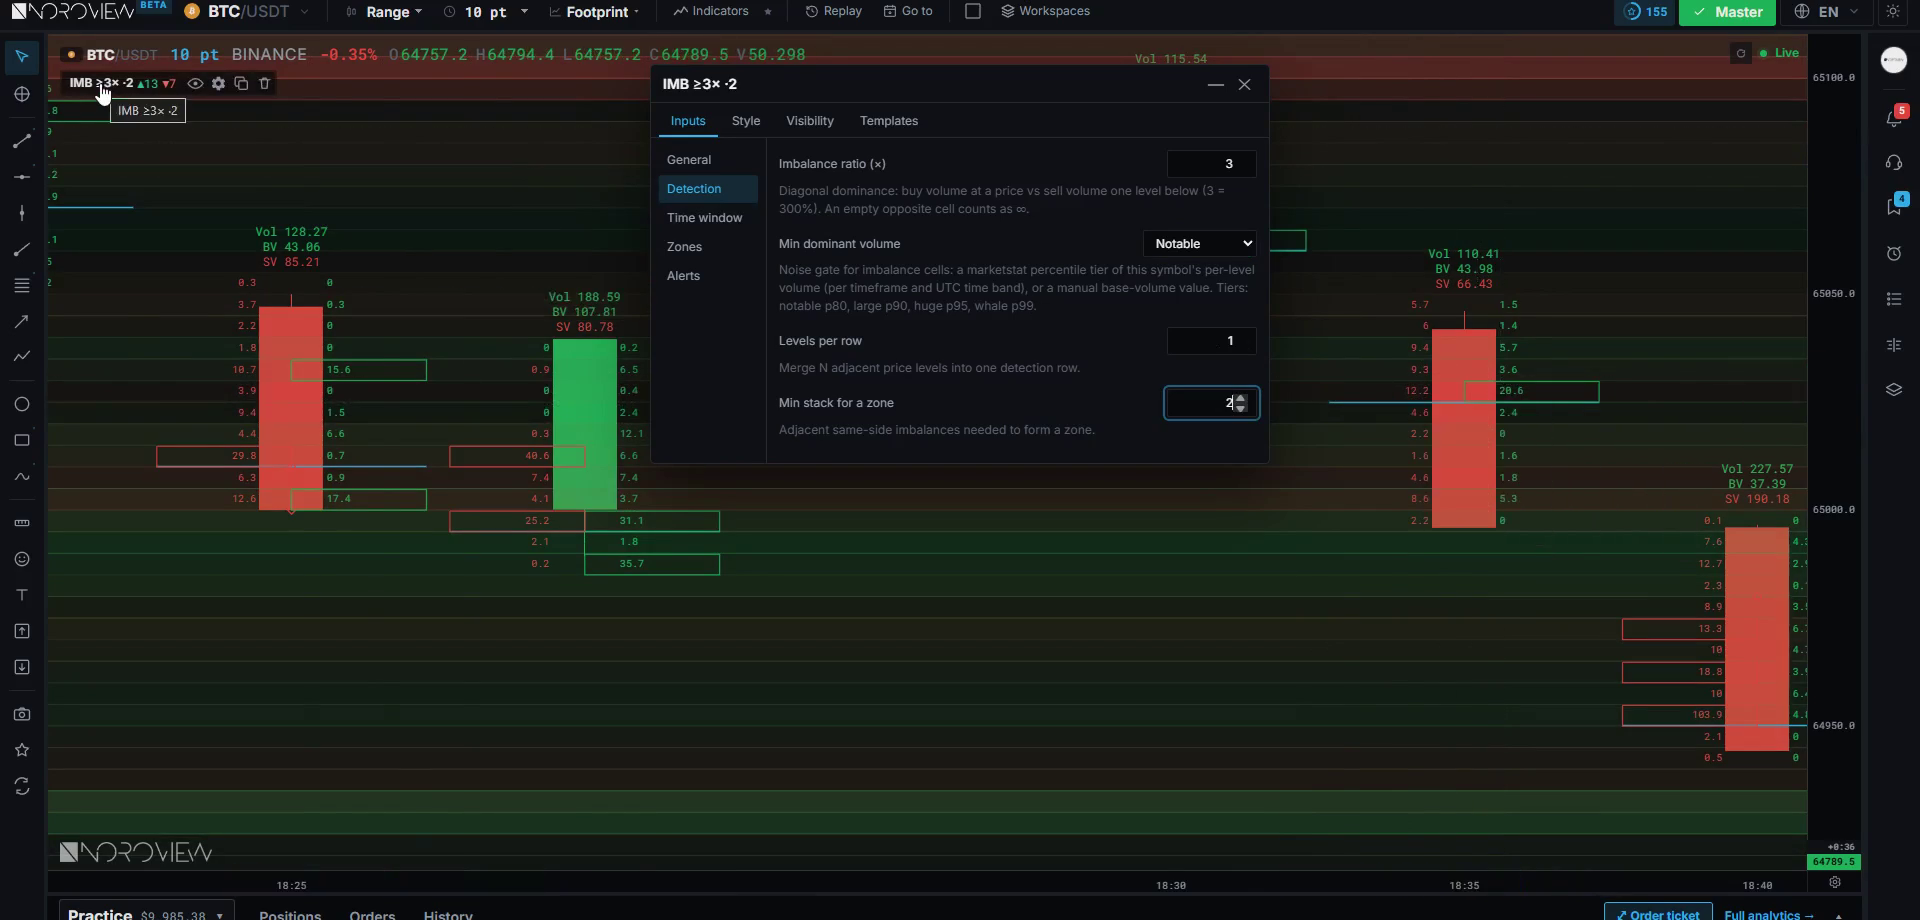
With the default settings you will probably see nothing at all. That is not broken. The defaults ship strict — high ratio, high volume floor, long required stack — designed to show only the very best. And on a normal day, the very best is rare.
Loosen it live (drop the volume floor from Huge to Notable, drop the required stack from 4 to 2) and zones appear.
Tighter = fewer, better. Looser = more, weaker. There is no correct setting — there is YOUR setting.
That is the general lesson for every detector in this platform. My advice: loosen until you get roughly two to five zones a day on your execution timeframe. That is a number a human can actually respect. Twenty a day and you will ignore all of them.
For lifecycle, keep zones until broken, with a small tolerance so a wick does not kill them, and keep broken ones visible — because a break and retest of an imbalance zone is a textbook order-flow entry.
Aggression leaves a mark, and the mark is a level.
Unfinished auctions and poor highs
Event five. A practical note first: you have to zoom OUT to see these. They sit outside a tight view most of the time. Add the indicator and see nothing — that is why. Which is the opposite of the imbalance detector, which needed you zoomed in.
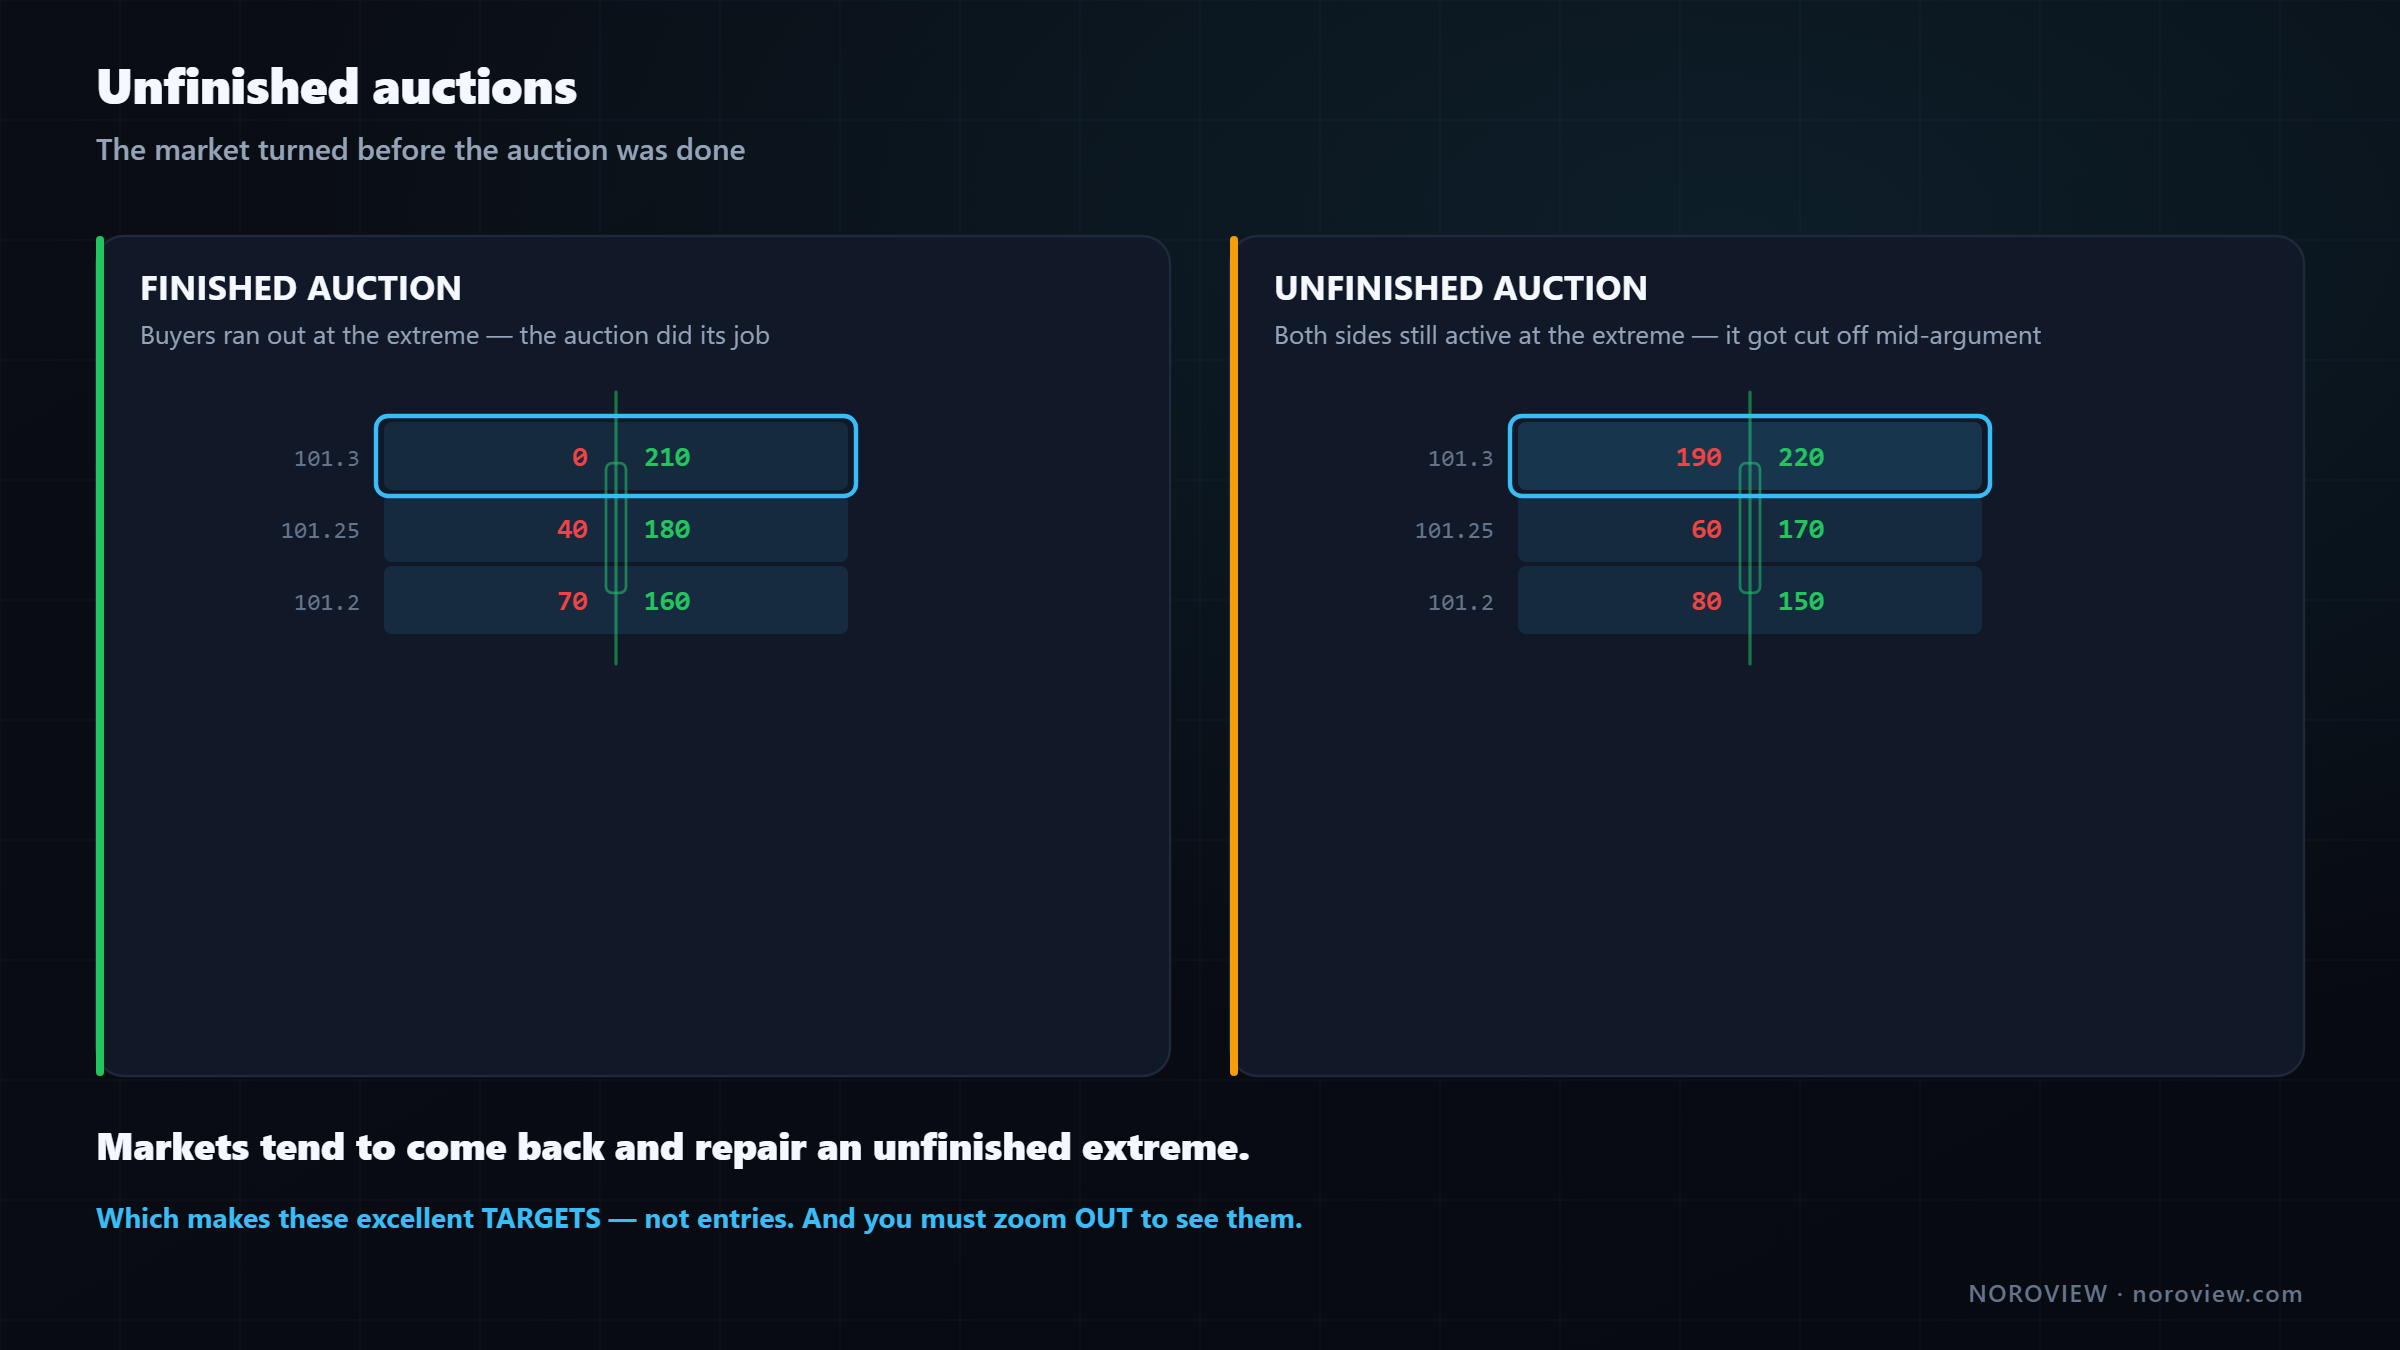
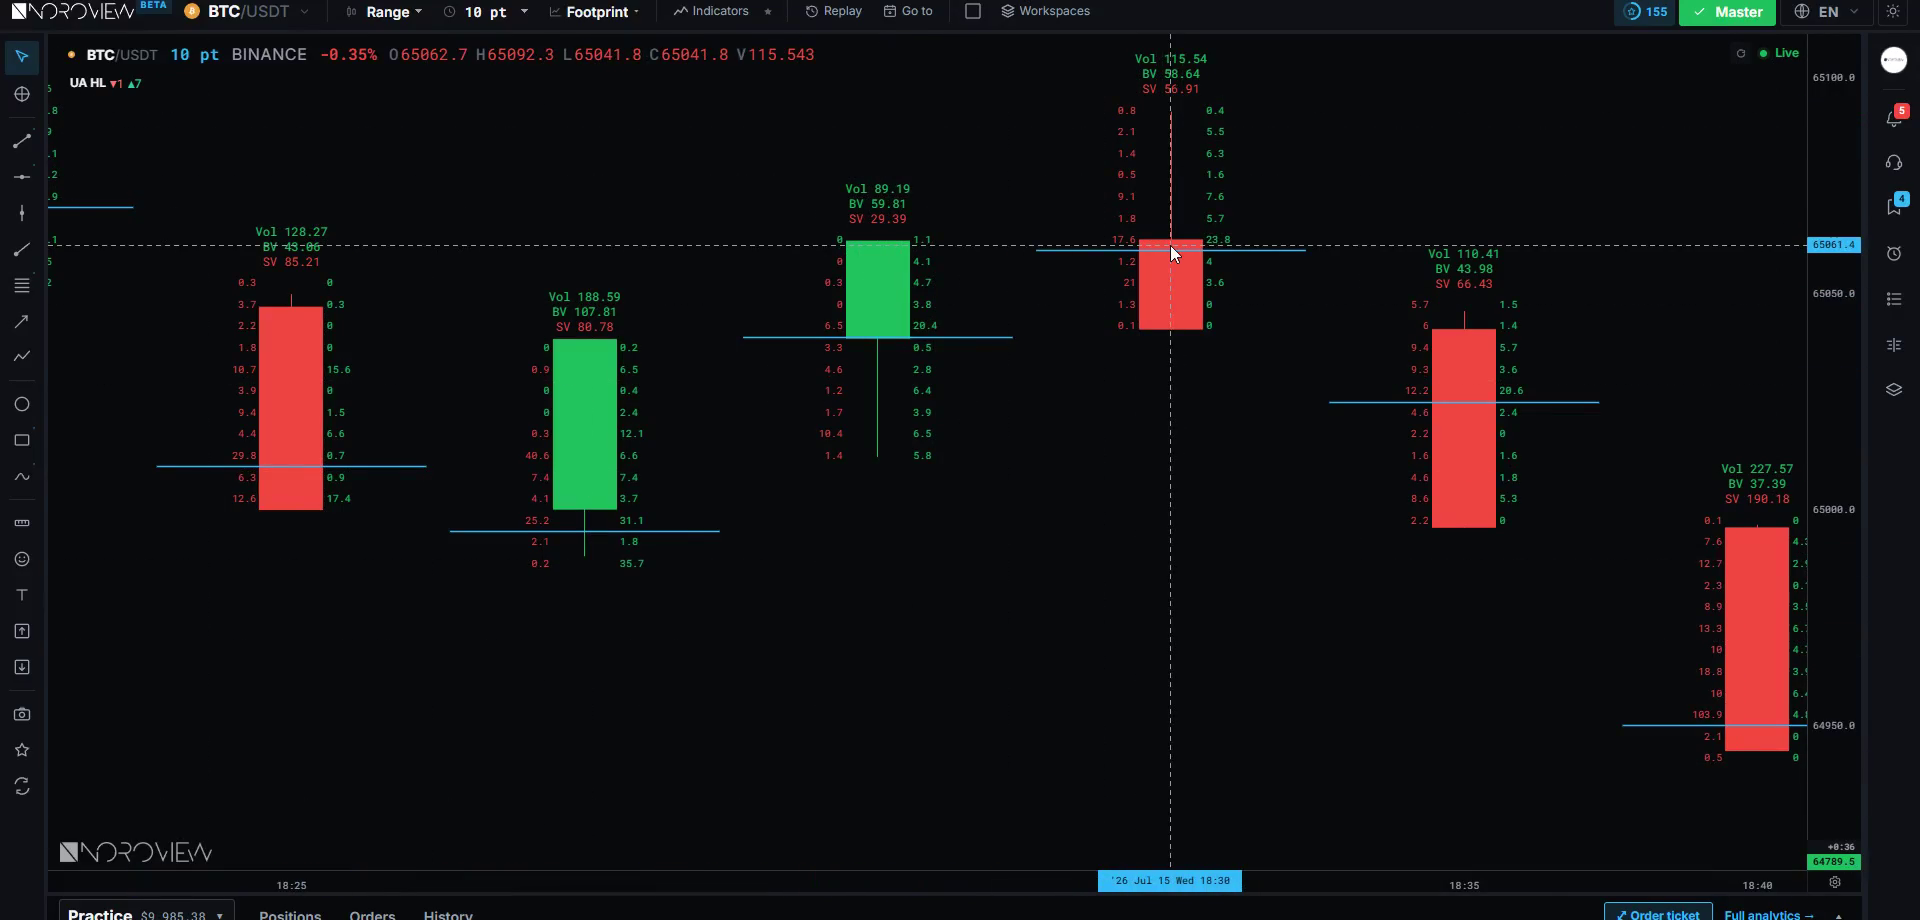
When an auction finishes at a high, it means the buyers ran out up there — the very top level shows buying with essentially nothing responding. The auction did its job: it went up until there were no more buyers, and it turned.
An unfinished auction is when price turns around while both buyers and sellers were still active at the extreme. The auction got cut off mid-argument. It never found the point where one side ran out.
Unfinished = the market turned before the auction was done. It tends to come back and finish.
Markets have a strong tendency to return and repair those. Why? Same reason as the naked POC: there were participants still active at that price who did not get what they wanted. That business is unfinished, and unfinished business attracts price.
Which makes these excellent targets, not entries. When you are long and looking for somewhere sensible to take profit, an unfinished high above you is a strong candidate, because the market has a mechanical reason to go there.
Poor highs and poor lows
A poor high = a flat top. Several bars with the same high, none of them decisive.
Note that in the Unfinished Auction settings this control only appears once you enable the feature, and then you set how many equal bars are required and how much tolerance in ticks counts as "equal."
Why is a flat top weak rather than strong? This is counter-intuitive and worth a moment. Most people see a triple top and think "strong resistance." Mechanically, the opposite is happening.
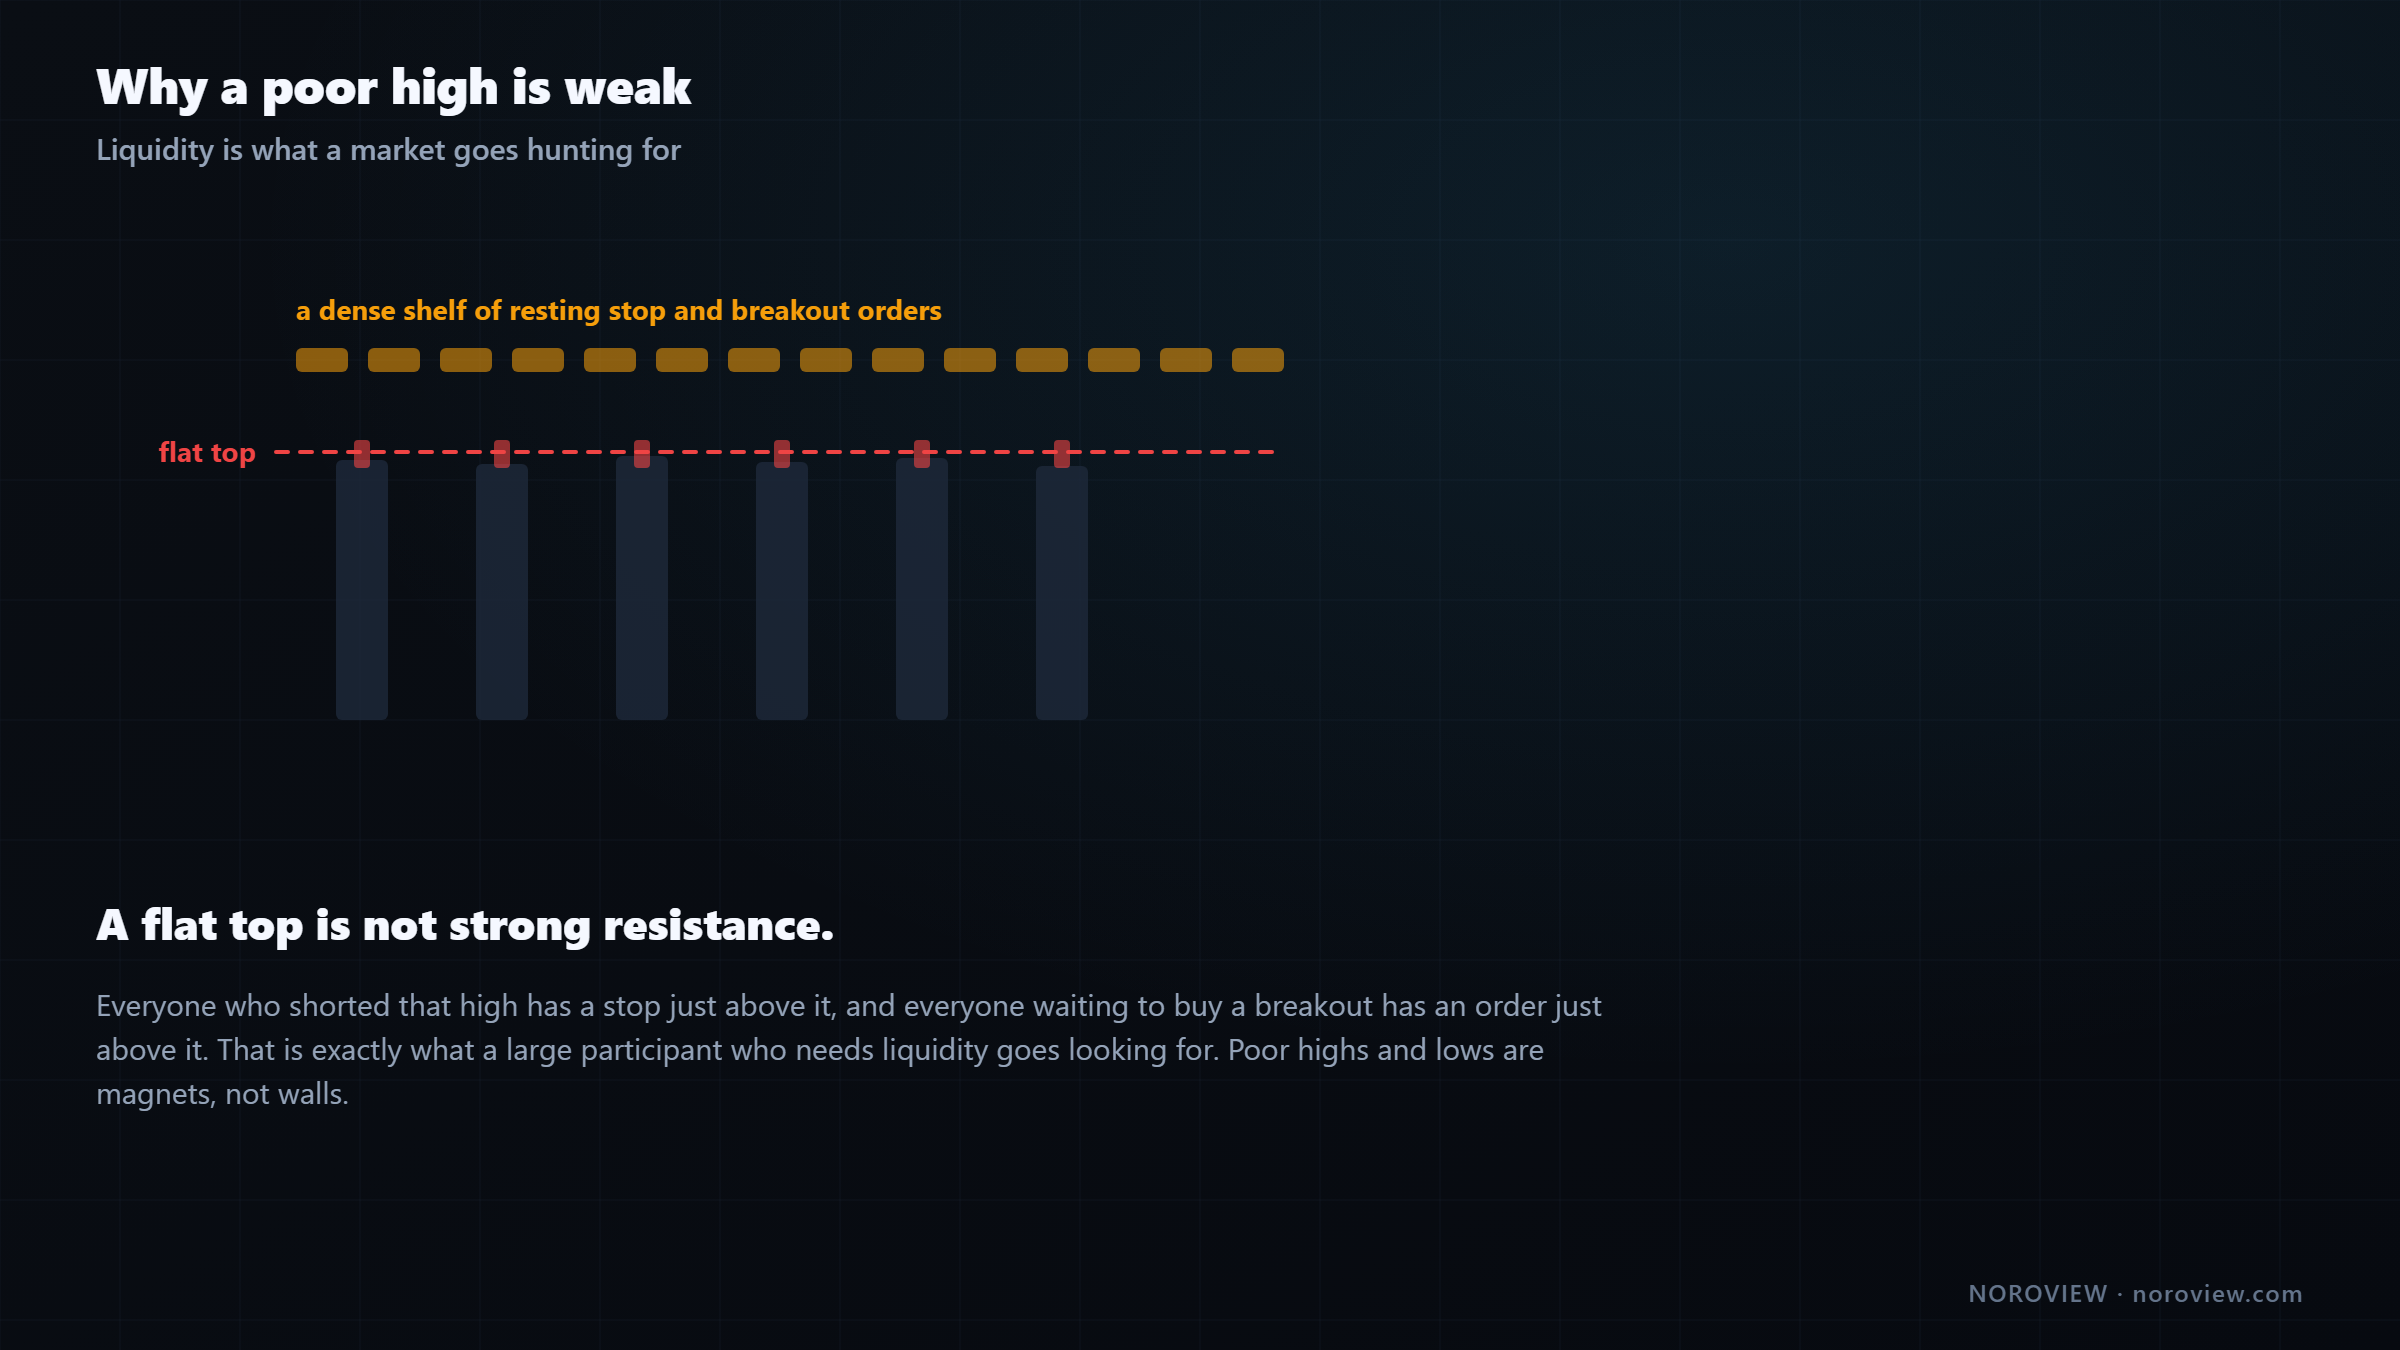
A flat top is a shelf of stop orders sitting in plain sight.
Every person who shorted that high has a stop just above it. Every person waiting to buy a breakout has an order just above it. So there is a dense, obvious pool of resting orders sitting right there — and that is exactly what attracts price. Liquidity is what a market goes hunting for.
That is why flat, obvious highs and lows get taken out so often, and why "the market always hunts my stops" feels true. It is not personal. Your stop is in the same place as everybody else's, and a large participant who needs to fill a big order goes where the orders are.
Poor highs and lows are magnets, not walls.
One accuracy note: cyan lines you see on a footprint chart are drawn by the footprint chart type itself, not by the Unfinished Auction indicator. If you are unsure which lines belong to what, turn the indicator off and see what disappears. That trick works on any chart with several tools on it.
Trapped traders: where all five lead
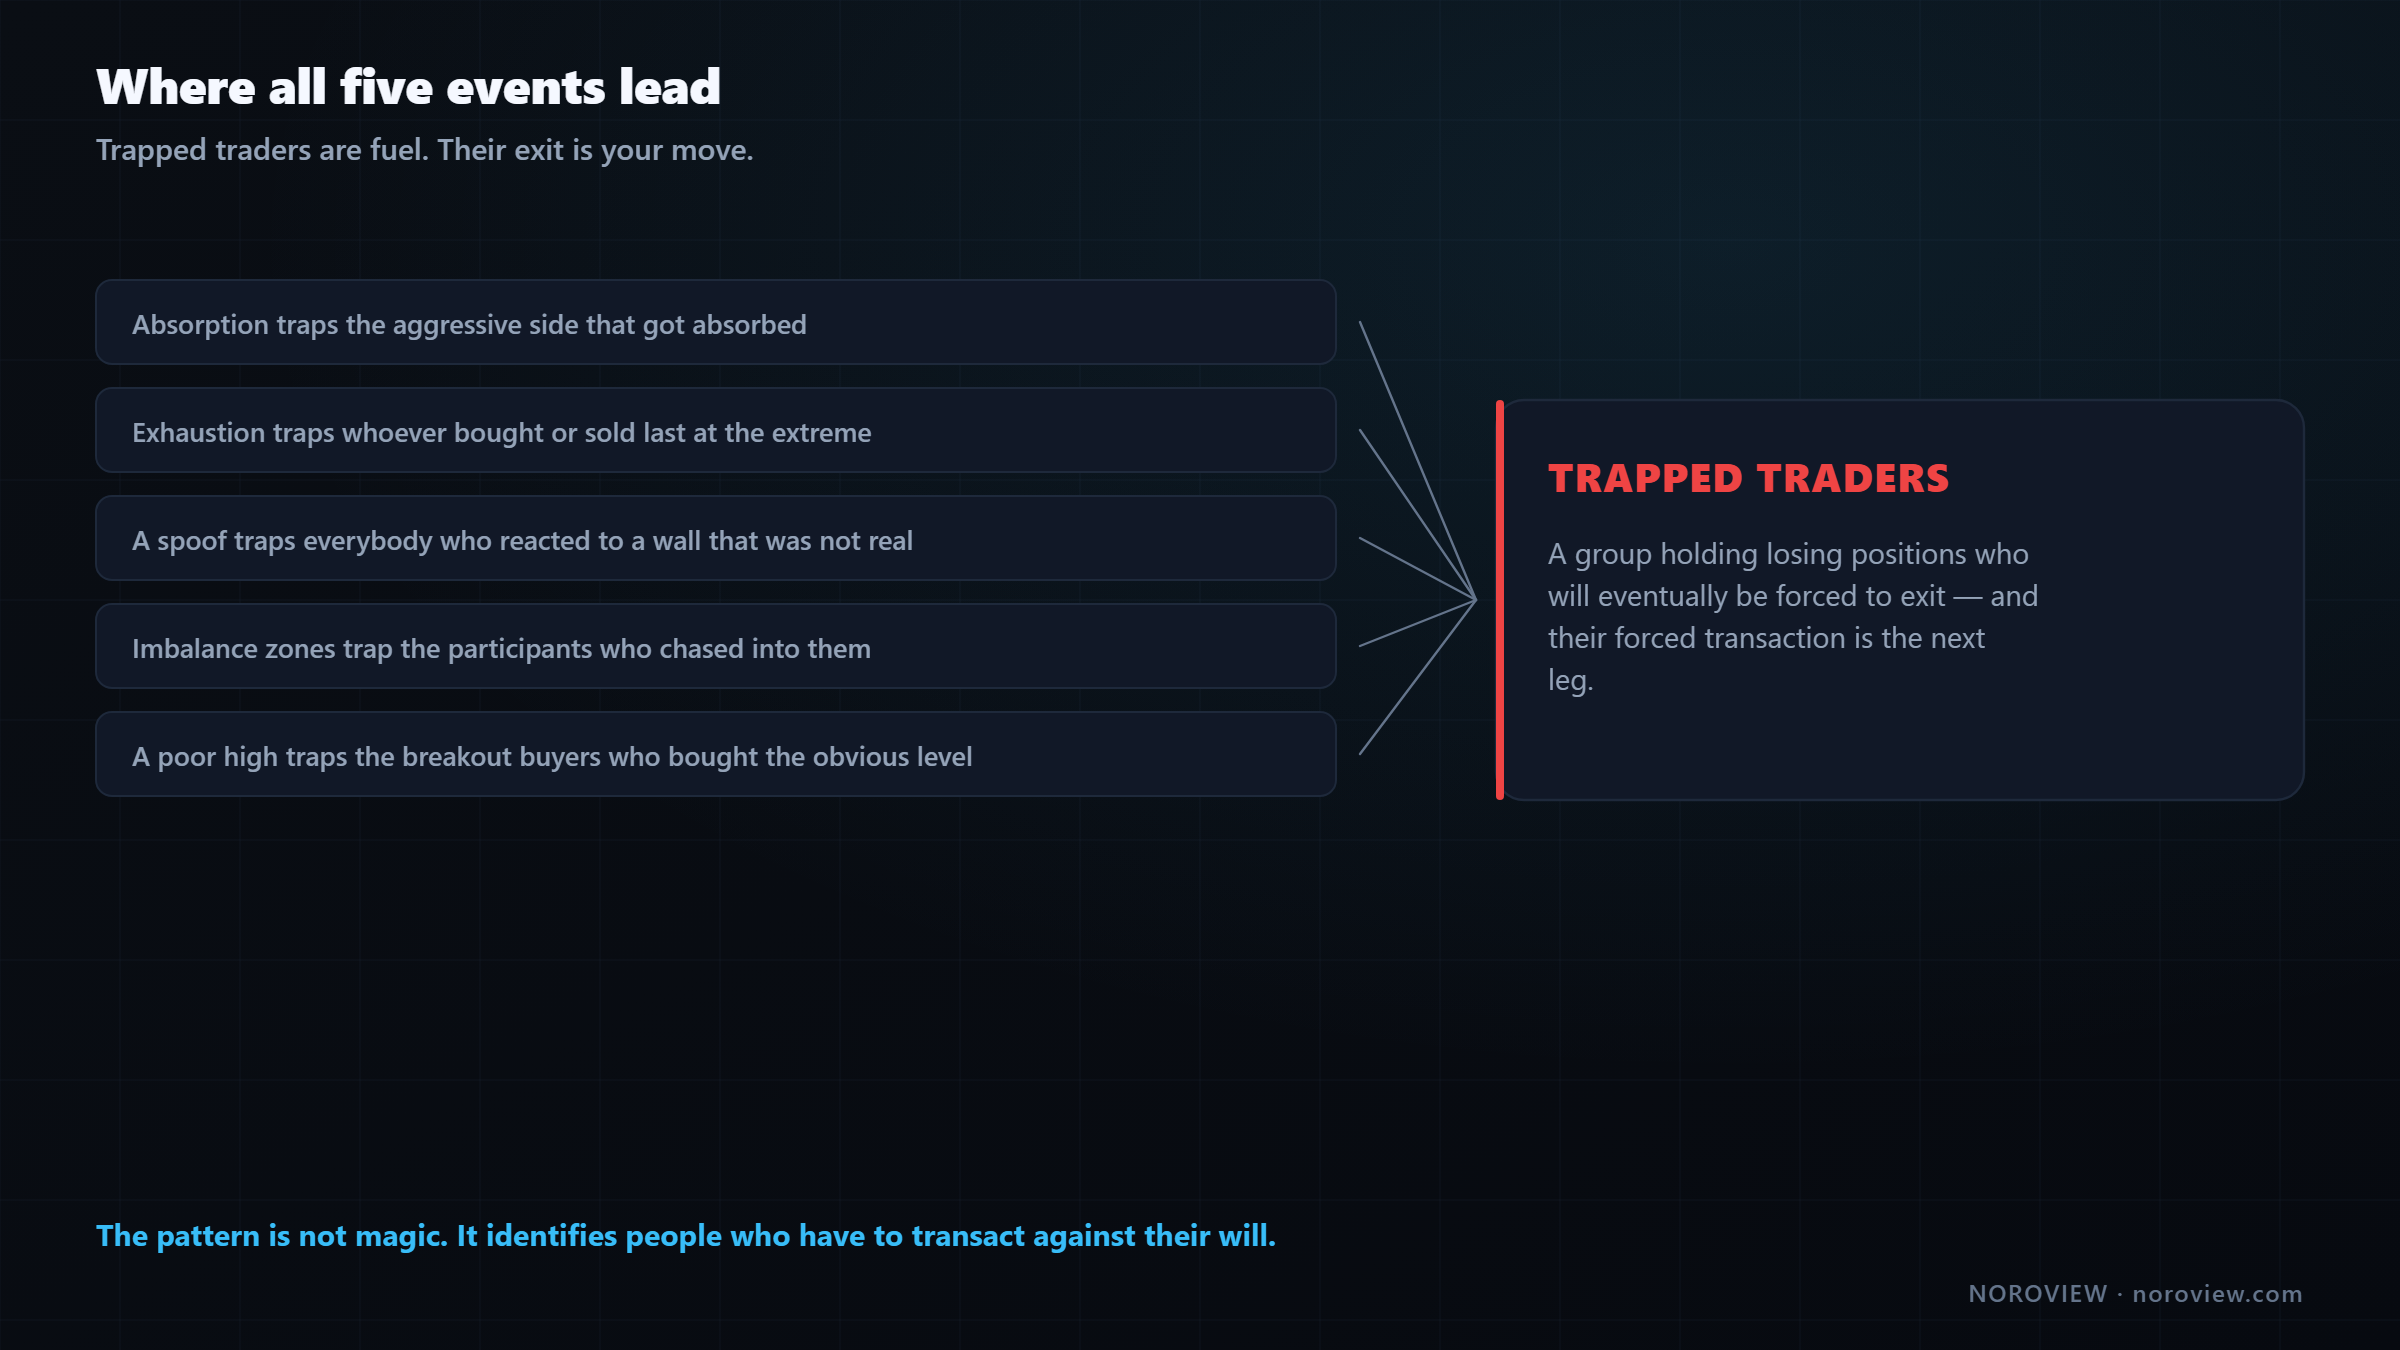
Every one of these events creates a group of people who are wrong.
- Absorption traps the aggressive side that got absorbed.
- Exhaustion traps whoever bought or sold last, at the extreme, right before it stopped.
- A spoof traps everybody who reacted to a wall that was not real.
- Imbalance zones trap the participants who chased into them.
- A poor high traps the breakout buyers who bought the obvious level.
Every one produces the same thing: a group of participants with losing positions who will eventually be forced to exit.
Trapped traders are fuel. Their exit is your move.
That is the real reason these patterns work. It is not that the pattern is magic — it is that the pattern identifies a group of people who have to transact against their will, and their forced transaction is the next leg.
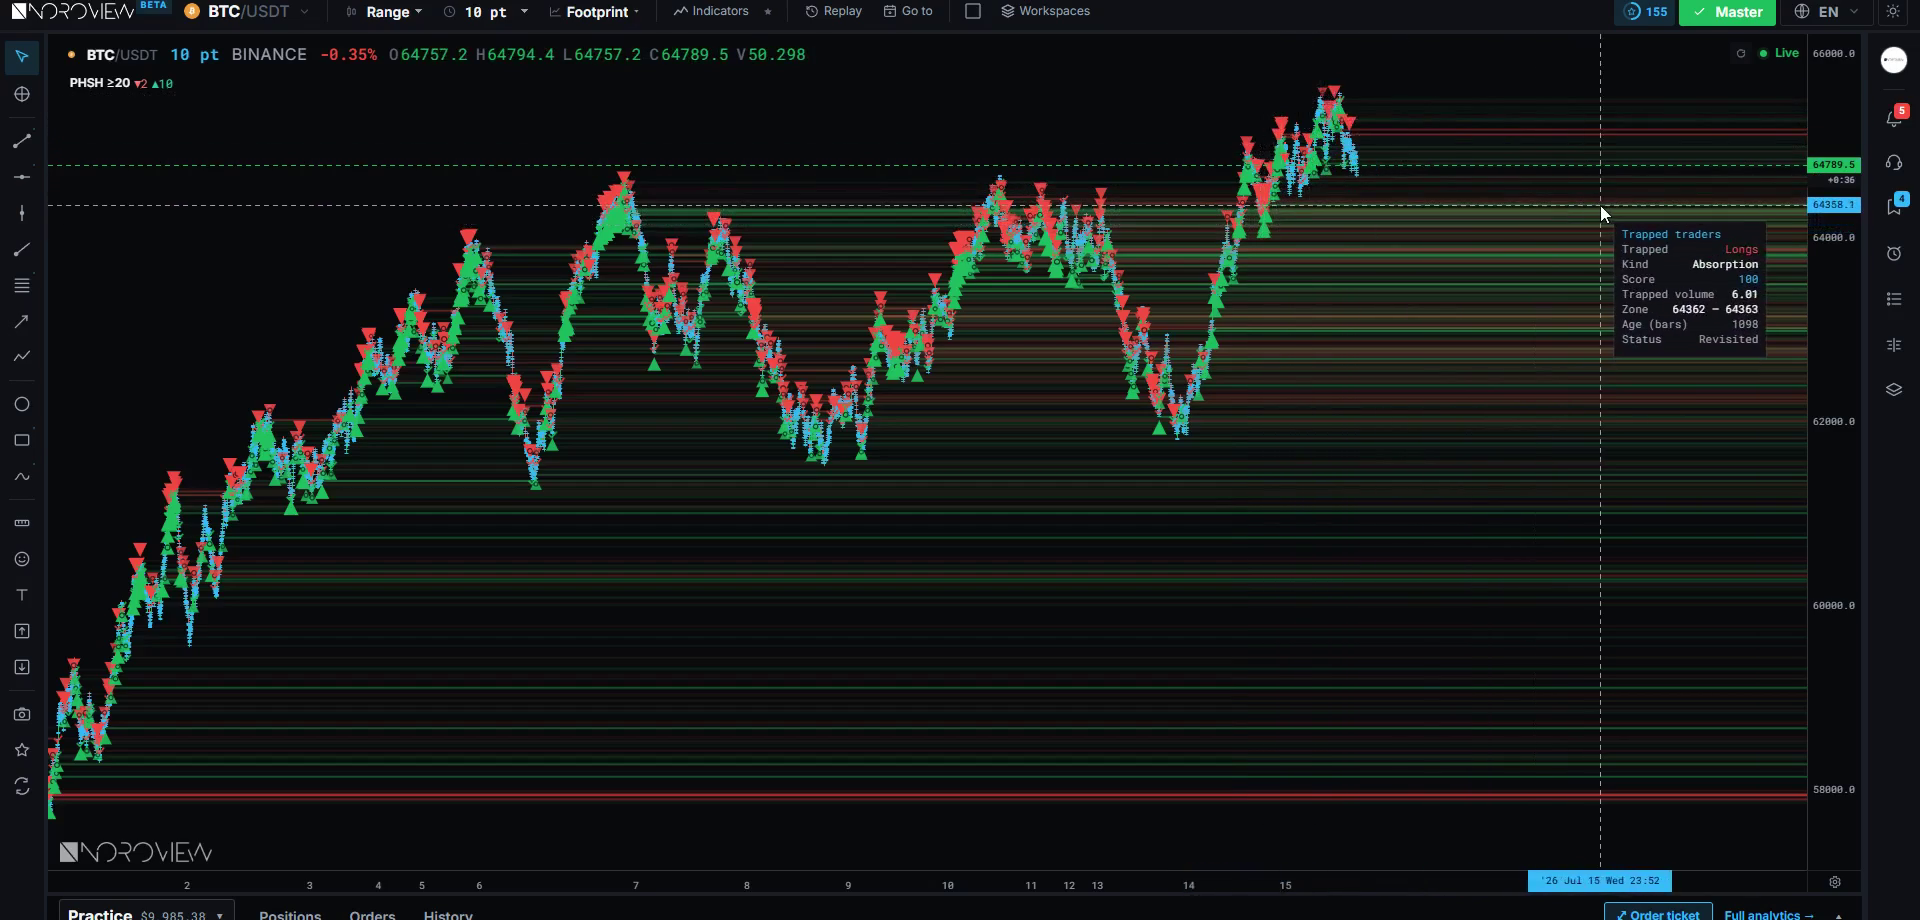
NOROVIEW has a detector specifically for this (Phishing Detection, advanced paid) that hunts for aggressive players who piled in and got absorbed or closed against as price reversed. Each trap gets a quality score, a marker, and a zone holding the trapped volume until price revisits it. It auto-loads roughly two weeks of history and needs no zoom change.
How I rank the five
Not all five are used the same way, and conflating them is a common source of bad trades.
| Event | What it is for | Typical use |
|---|---|---|
| Absorption at a mapped level | The strongest single piece of evidence | Entry |
| Stacked imbalance zone | Where aggression came from | Entry on break-and-retest |
| Iceberg (live) | Confirmation that someone large wants this price | Entry confirmation |
| Exhaustion | The old move is finished | Stop trading the old direction |
| Unfinished auction / poor high | Unfinished business | Target |
Read that table twice. The most common mistake in this whole lesson is using a target as an entry, or treating exhaustion as a reversal signal.
Common mistakes
- Calling three of the four absorption conditions a signal. Condition four — price did not continue — is the one that matters.
- Buying exhaustion expecting a V. Exhaustion is the setup for the setup.
- Reacting to a visible wall. If it never prints, it was theatre.
- Trading a single imbalance. Stacking is the signal.
- Assuming the imbalance detector is broken because the strict defaults show nothing.
- Treating a flat triple top as strong resistance. It is a stop shelf.
- Using unfinished auctions as entries rather than targets.
- Reading absorption away from a level. Two traders arguing.
Your homework
About ninety minutes, and this one is worth the time.
- Find five absorption candles in replay, and for each write down all four conditions and whether the trade would have worked. Include at least two failures.
- Find one clear exhaustion sequence — three consecutive new lows with shrinking volume at each — and mark how long price then spent going sideways before anything happened.
- Watch the order book live for twenty minutes and try to catch one iceberg: a level where far more trades through than was ever displayed, and the level does not vanish.
Three things to remember
- Absorption is opposed; exhaustion is abandoned. High volume at the extreme means someone is standing in the way; fading volume means nobody is left to push.
- The book lies, the tape does not. An iceberg is invisible in the order book and obvious in trade data. A spoof never prints at all.
- All five events create trapped traders, and it is the forced exit of those traders that produces the next move.
← Previous: Order Flow Support and Resistance · Course index: Order Flow Trading Course · Next → My Order Flow Entry Model
Frequently asked questions
What is absorption in trading? Absorption is heavy aggressive buying or selling that fails to move price, because a large passive participant is taking the other side with resting limit orders. It requires four conditions: unusually high volume, at or near the candle's extreme, strongly one-sided, and no continuation in that direction.
What is the difference between absorption and exhaustion? Absorption means somebody is actively standing in the way, and volume at the extreme is high. Exhaustion means the pushing side simply ran out, and volume at the extreme is low and fading. Absorption gives you a defended level to trade against; exhaustion only tells you the old move is finished.
How do you spot absorption on a footprint chart? Look for a price level at the very top or bottom of a candle with volume far larger than its neighbours, overwhelmingly one-sided, where price then failed to continue in that direction. Elevated average trade size at that level indicates one large participant rather than a crowd.
What is an iceberg order? An iceberg order displays only a small portion of its true size and automatically refills from a hidden reserve each time the visible piece is filled. It hides size in the order book but exposes itself in trade data, because far more volume prints at that price than was ever displayed.
What is spoofing in the order book? Spoofing is placing large visible orders with no intention of filling them, to make other participants react, then cancelling as price approaches. It is prohibited in regulated markets. The tell is that a spoofed wall produces no trade volume at all when price arrives.
What is a stacked imbalance? A stacked imbalance is several consecutive price levels where one side's aggressive volume overwhelmingly exceeds the other side's on the diagonal comparison. Stacks mark zones of one-sided control, and a break and retest of such a zone is a common order-flow entry.
What is a poor high in order flow? A poor high is a flat, multi-touch extreme where several bars top at almost the same price without any of them decisively rejecting. Rather than strong resistance, it represents a dense shelf of resting stop and breakout orders, which tends to attract price rather than repel it.
What is a trapped trader? A trapped trader is a participant who entered aggressively and immediately found themselves offside — absorbed, exhausted, or caught by a false break. Because their exit is a forced transaction in the opposite direction, groups of trapped traders provide the fuel for the next move.
Sources
- Harris, L. (2003). Trading and Exchanges: Market Microstructure for Practitioners — Oxford University Press
- Investopedia — iceberg orders
- U.S. Commodity Futures Trading Commission — market manipulation and spoofing enforcement
Soroosh Moghimi — six years inside financial markets: algorithmic trading, HFT, crypto and AI, after a decade building startups. He publishes this course free because he already paid for the lessons in it. There is no paid course and no signal group. @sorooshmoghimi · About
Start reading real order flow
You cannot learn this from a candlestick chart, and you do not need to spend a cent to begin. The standard footprint chart is free for every NOROVIEW user, market replay is free, and the paper-trading simulator is free.
Open NOROVIEW free → · Compare plans →
⚠️ DISCLAIMER — EDUCATIONAL CONTENT ONLY
This article is for educational and informational purposes only. It is not financial, investment, or trading advice, and nothing in it is a recommendation to buy, sell, or hold any asset. Trading cryptocurrencies and leveraged derivatives is high risk and can result in the loss of some or all of your capital. Only risk money you can afford to lose. Any levels, indicators, signals or results shown are illustrative and are not a promise or prediction of future performance. Charts may be shown on a demo or paper-trading account and do not represent real trades or returns. Always do your own research. You alone are responsible for your decisions.
Keep reading
Related posts

16. Trade Management: Break-Even, Partials and Trailing Stops
Trade management explained: when break-even stops cost you money, partial exits, four kinds of trailing stop, the order-flow exit, and diagnosing yourself with MFE and MAE.

15. How to Day Trade Crypto With Order Flow (Starting Small)
How to day trade crypto with order flow: exchange security, spot vs perpetuals, leverage and liquidation, order types, fees, and an honest $100 starting plan.

14. Risk, Drawdown and the Mind: Day Trading's Real Edge
Day trading risk management and psychology: position sizing math, drawdown recovery arithmetic, hard limits, decision vs outcome, and the five states that break traders.

13. Fair Value Gaps, Confirmed With Order Flow
Most fair value gaps do nothing. Five order-flow checks that tell you in advance which FVGs are worth trading and which are decoration.

5. Market Structure and Trend: How to Pick Your Side Objectively
How to identify market structure objectively: higher highs and higher lows, swing point rules, impulse vs correction, and the arithmetic behind trading with the trend.

11. My Order Flow Entry Model, Step by Step
A complete order flow entry model: the four conditions, the exact trigger candle, the value-area filter, and the ten-item blocker list that vetoes a trade.
Discussion (0)
Want to join the discussion? Comments live inside the platform.
Open NOROVIEW