
12. Cumulative Volume Delta (CVD): The Complete Guide
Cumulative volume delta explained: how CVD is built, the four price/CVD combinations, reading CVD candle wicks, and the four honest limits of divergence.
12. Cumulative Volume Delta (CVD): The Complete Guide
Cumulative volume delta is a running total of aggressive buying minus aggressive selling, accumulated from the start of the session. It rises when aggressive buyers dominate and falls when aggressive sellers do. Its entire value comes from one comparison: how much aggression it took to produce the price movement you can see.
Price making higher highs while CVD makes lower highs means somebody is pushing price up on less and less fuel — which usually means somebody else is selling into it. That is a divergence, and divergence is the single most over-traded concept in order flow, which is why the honest-limits section here matters as much as the technique.
Open a chart — even on the free plan the per-candle footprint delta plus the Volume indicator in Buy/Sell split mode teaches the same idea.
What you'll learn in this lesson
- What CVD actually is, built candle by candle
- The three sources — volume delta, trades delta and ABS delta — and what comparing them tells you
- Convergence, and why boring is what you want to be positioned in
- The four combinations of price and CVD, plus the fifth situation that is not on the card
- How to read CVD candles and their wicks — the trick almost nobody uses
- The four honest limits, including the deepest one nobody mentions
Lesson 12 of 16 · Part 2 — Technique. Part of the free order flow trading course. Previous: My Order Flow Entry Model. Next: Fair Value Gaps With Order Flow.
▶ Prefer to watch it?
Volume Profile, Anchored VWAP & CVD Explained — NOROVIEW Order Flow (Ep 14) builds CVD on a live chart and walks the divergence detection settings.
Key terms
| Term | What it means |
|---|---|
| Delta | Aggressive buy volume − aggressive sell volume, per candle |
| CVD | Delta accumulated over the session |
| Convergence | Price and CVD agreeing |
| Divergence | Price and CVD disagreeing |
| Volume delta | Buy volume − sell volume |
| Trades delta | Buy trade count − sell trade count |
| ABS delta | The A-B-S metric, accumulated. Not the same as the absorption pattern |
| Pivot strength | How many candles either side are needed before a high or low counts |
What CVD actually is
From lesson 4: delta is aggressive buy volume minus aggressive sell volume, per candle, one number. CVD is that number, added up as the session goes.
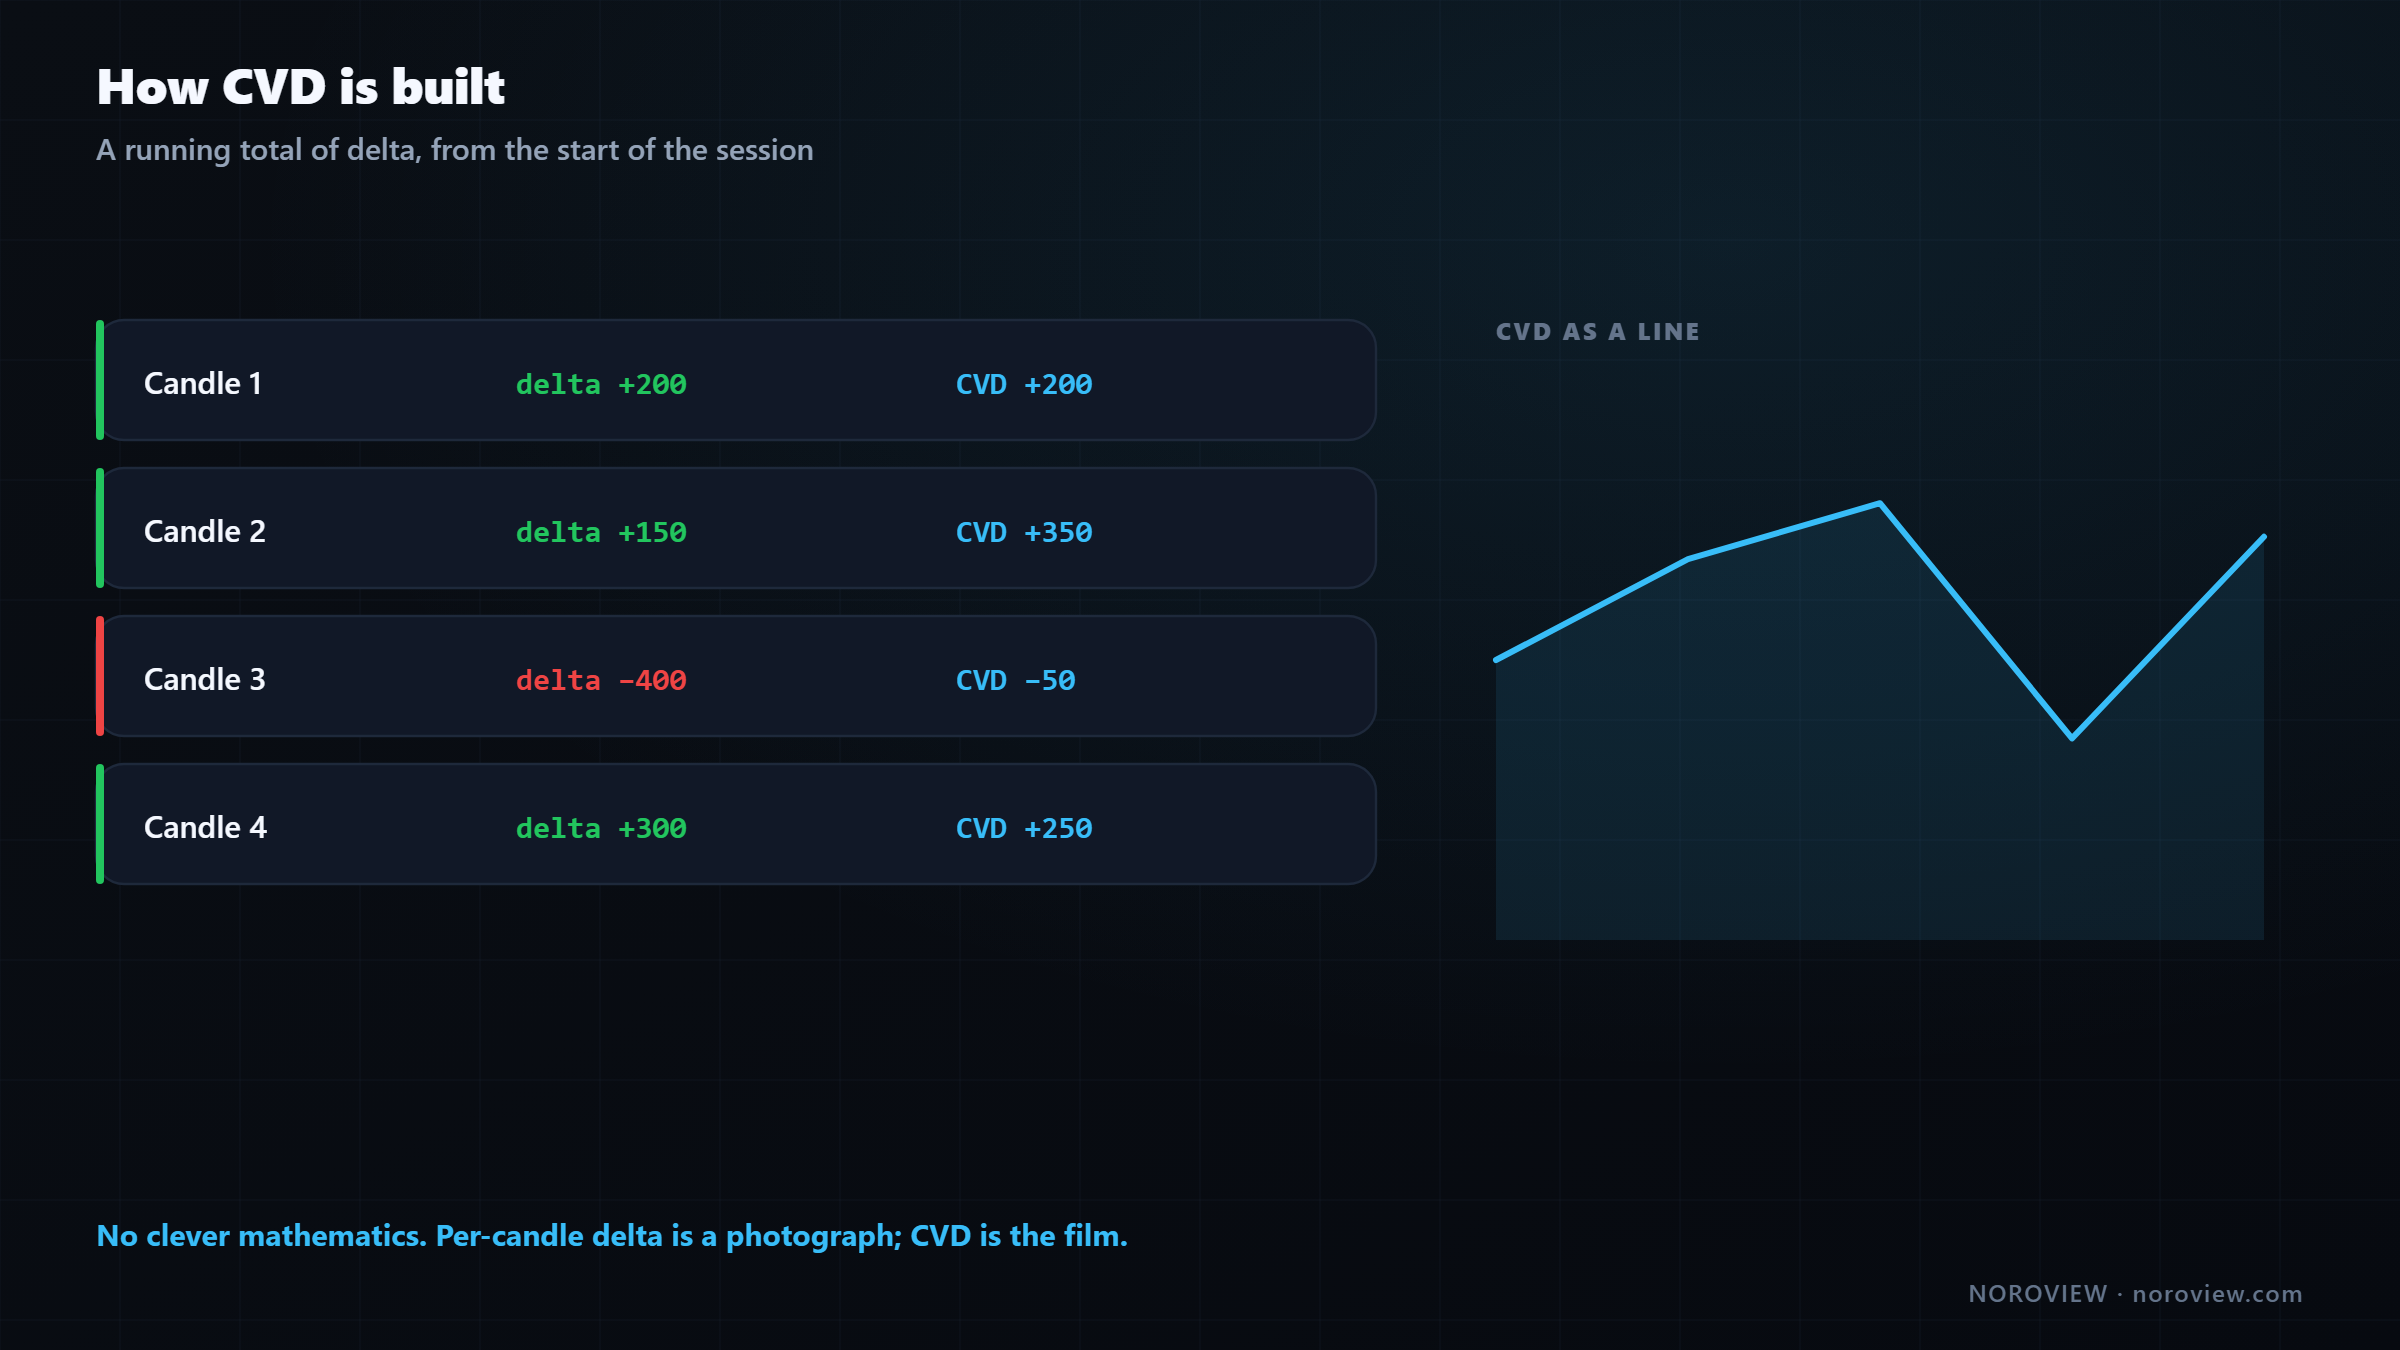
Candle 1:  delta +200   →  CVD  +200
Candle 2:  delta +150   →  CVD  +350
Candle 3:  delta −400   →  CVD   −50
Candle 4:  delta +300   →  CVD  +250
That is it. No clever mathematics — a running total. Because it is a running total you can draw it like a price chart: a line that rises when aggressive buyers dominate and falls when aggressive sellers do.
Why bother, when you already have per-candle delta?
Per-candle delta is a photograph. CVD is the film.
A single candle's delta is a snapshot, and snapshots are noisy. One candle with big positive delta tells you very little — it happens all day, in both directions, constantly.
CVD tells you the cumulative story: who has been winning, for how long, and — the important part — how much aggression it has taken to produce the movement you can see on the price chart. That comparison, between what it cost and how far price went, is the entire value of the tool.
Adding it, and the three sources
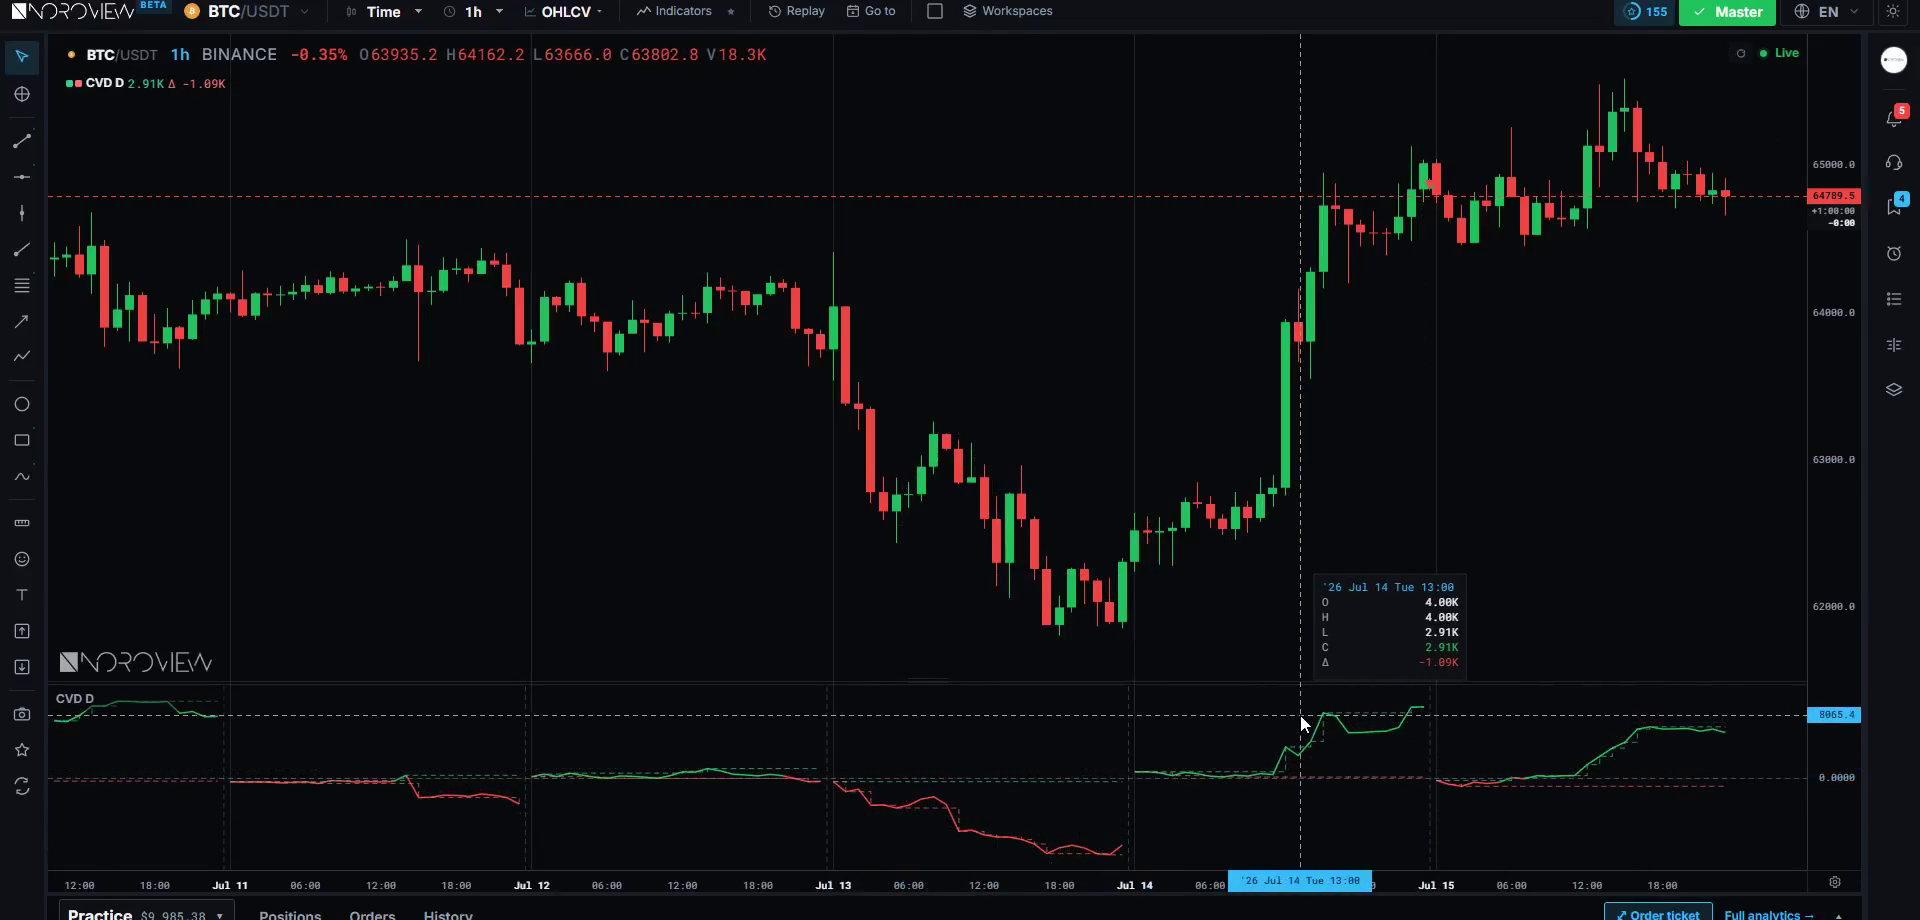
CVD is an advanced, paid indicator in NOROVIEW. It opens in its own pane below the chart because it has its own scale — it is measured in volume, not price. You can flip it onto the price chart with the overlay⇄section toggle in the legend (you will see the right-hand axis swap when you do), but I keep it in its own pane: overlaying two things with different units on one axis makes people read relationships that are not there.
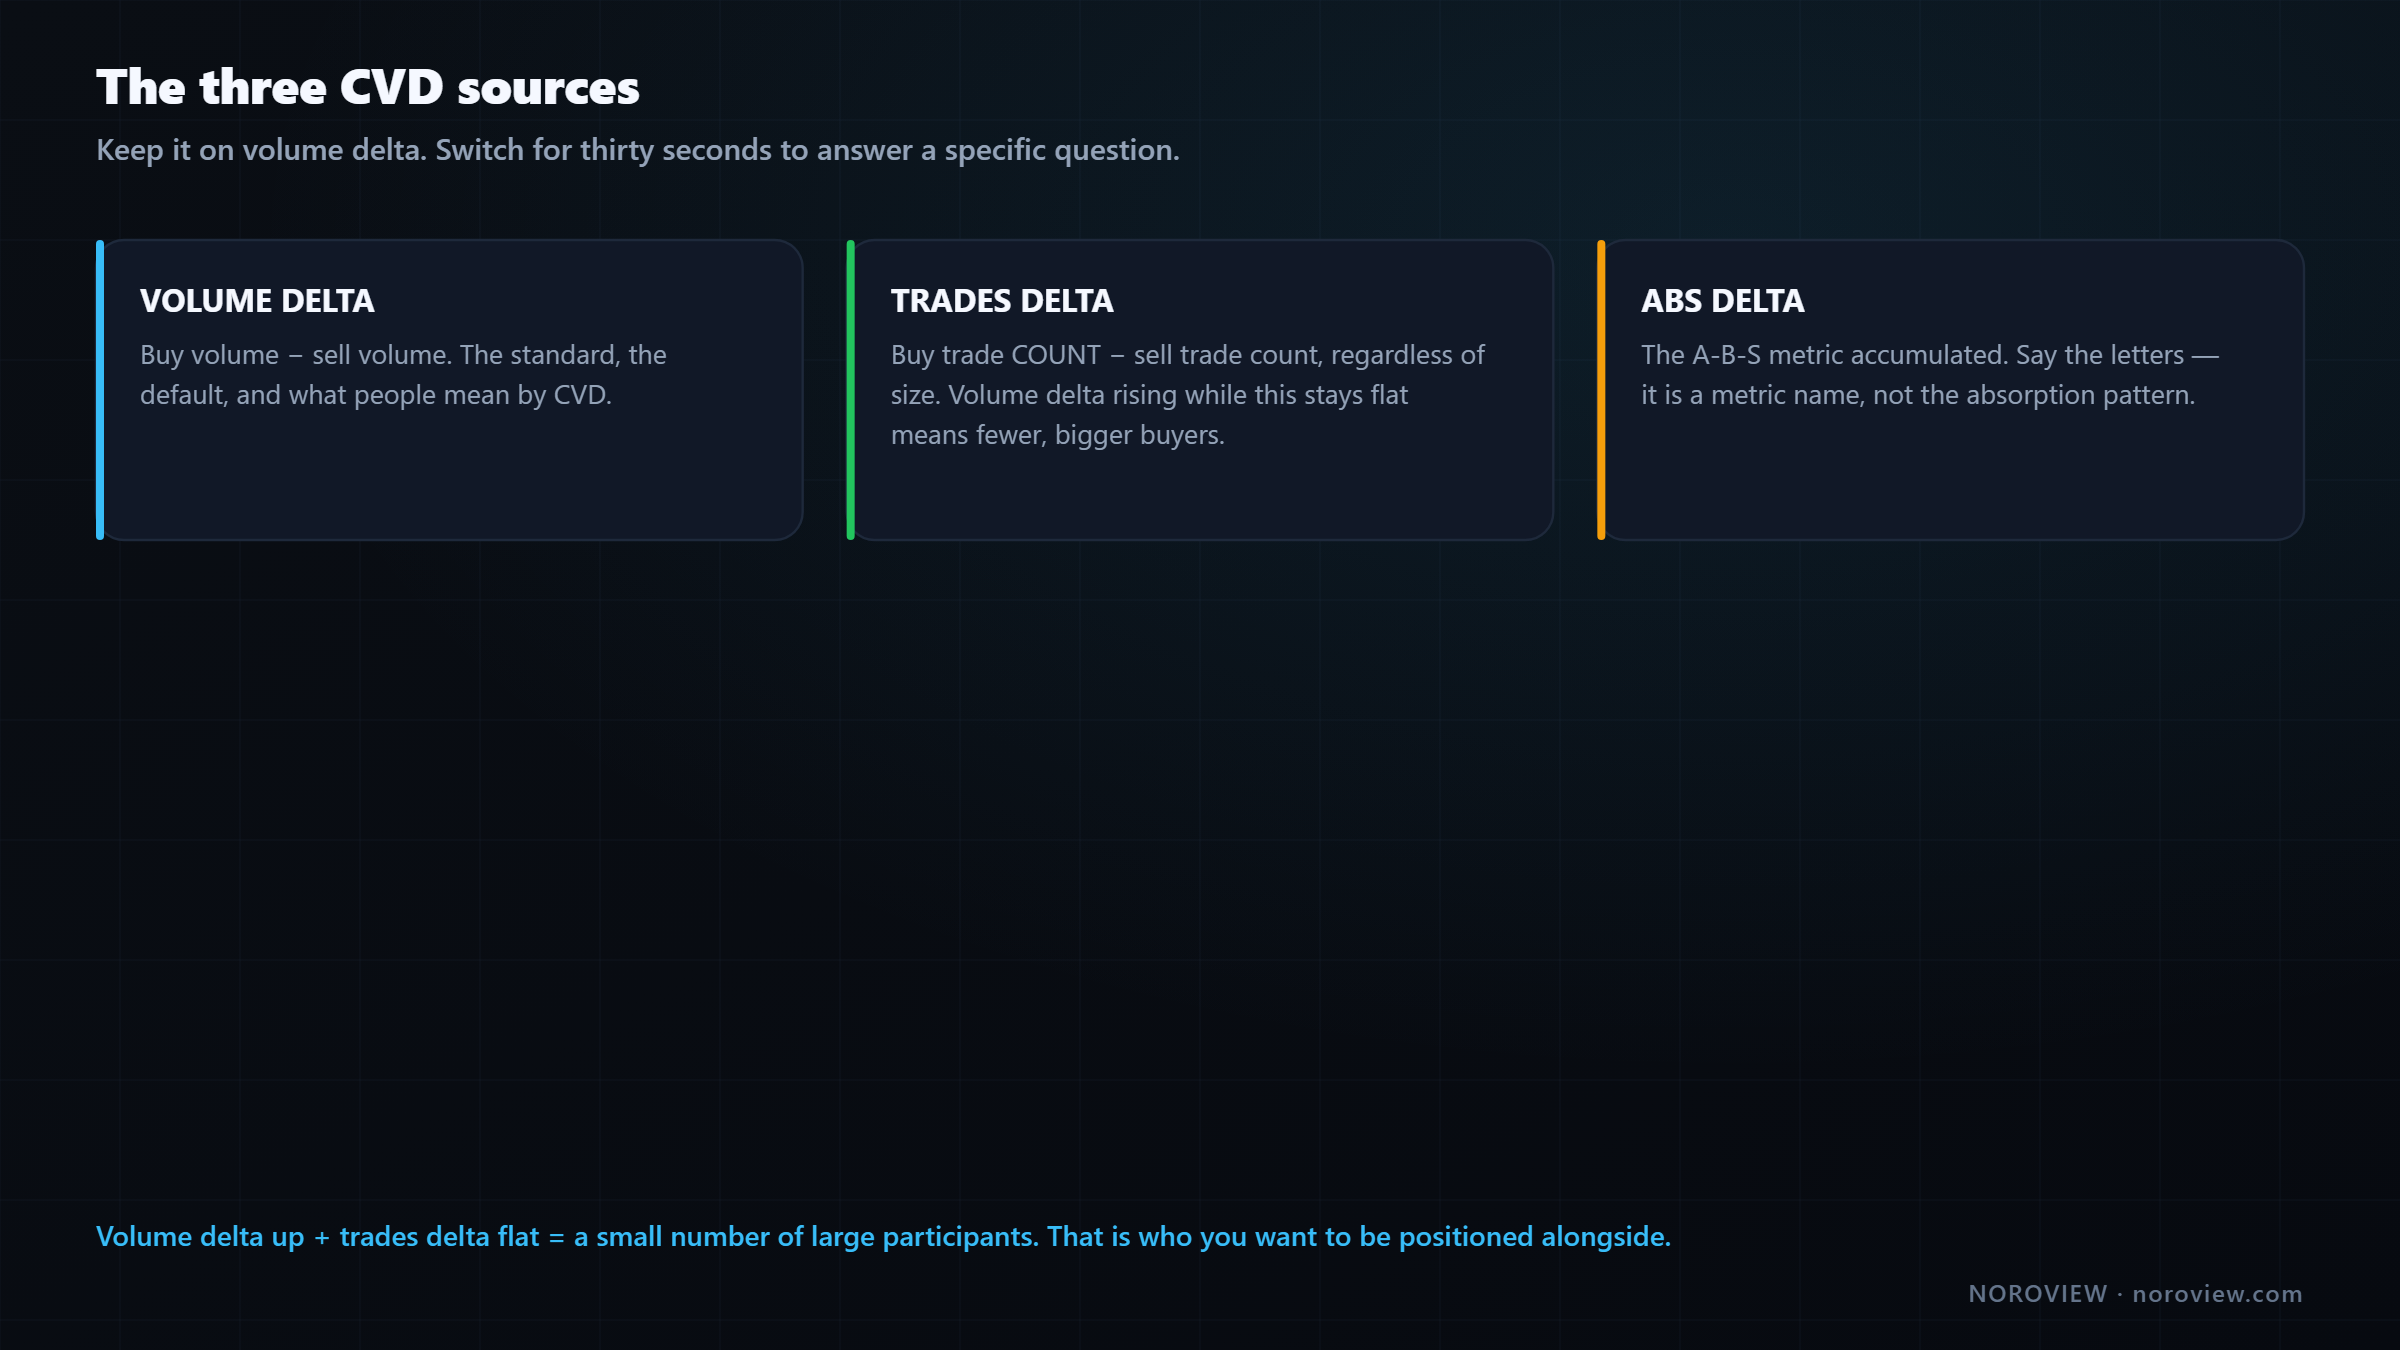
| Source | What it accumulates |
|---|---|
| Volume delta | Buy volume − sell volume. The standard and the default |
| Trades delta | Buy trade count − sell trade count, regardless of size |
| ABS delta | The A-B-S metric from lesson 4, accumulated |
The comparison between the first two is genuinely useful, for exactly the reason covered in lesson 4:
Volume delta up + trades delta flat = fewer, bigger buyers.
If volume delta is rising strongly but trades delta is flat, the buying is coming from a small number of large participants. If trades delta is rising but volume delta is not, you have many small buyers — a crowd. I know which of those two I would rather be positioned alongside.
A precision note on the third: A-B-S is the name of a metric. It is not the same thing as the absorption pattern from lesson 10. Related idea, different thing. Do not mix them up. Always write and say it as "A-B-S."
Keep it on volume delta. That is your default. Switching source is something you do for thirty seconds to answer a specific question, not something you leave changed.
Four settings worth knowing
- Sessions — when CVD resets to zero. Daily is standard, matching the market's own day and the range-candle reset. You can change the start hour to match a session you care about.
- Normalized — scales values so CVD is comparable across markets. Useful if you watch several coins; unnecessary if you watch one.
- MA — a moving average of CVD. Genuinely useful: CVD is jagged, and a smoothed line makes the trend of aggression much easier to see at a glance.
- Draw as — line, candles, histogram or area. Candles unlock something most people never use (see below).
▶ Try this now
Add CVD in its own pane with source Volume delta, session Daily, and turn on the MA. Then ask one question: is the CVD line making the same kind of highs and lows as price? That two-second read is the session's health, and you should do it every time you open the chart. Launch NOROVIEW free →
Convergence: the healthy picture
You cannot recognise sick without knowing what healthy looks like.
Convergence = price and CVD agree.
Price makes higher highs; CVD makes higher highs. Price makes a new high and the accumulated buying makes a new high at the same time. That is a move that is being paid for — real aggressive buyers lifting offers, price responding, actual positions and actual people who now have a reason to defend lower prices.
Convergence is boring. Boring is what you want to be positioned in.
The practical use: convergence is a reason to stay in a trade and a reason to be relaxed about a pullback. If you are long and price is grinding up with CVD grinding up alongside it, you are not looking for reasons to exit. The move has its fuel.
Same in reverse for a downtrend: price making lower lows, CVD making lower lows, aggressive sellers genuinely doing it. Convergent, healthy — and if you are short, leave it alone.
The four combinations
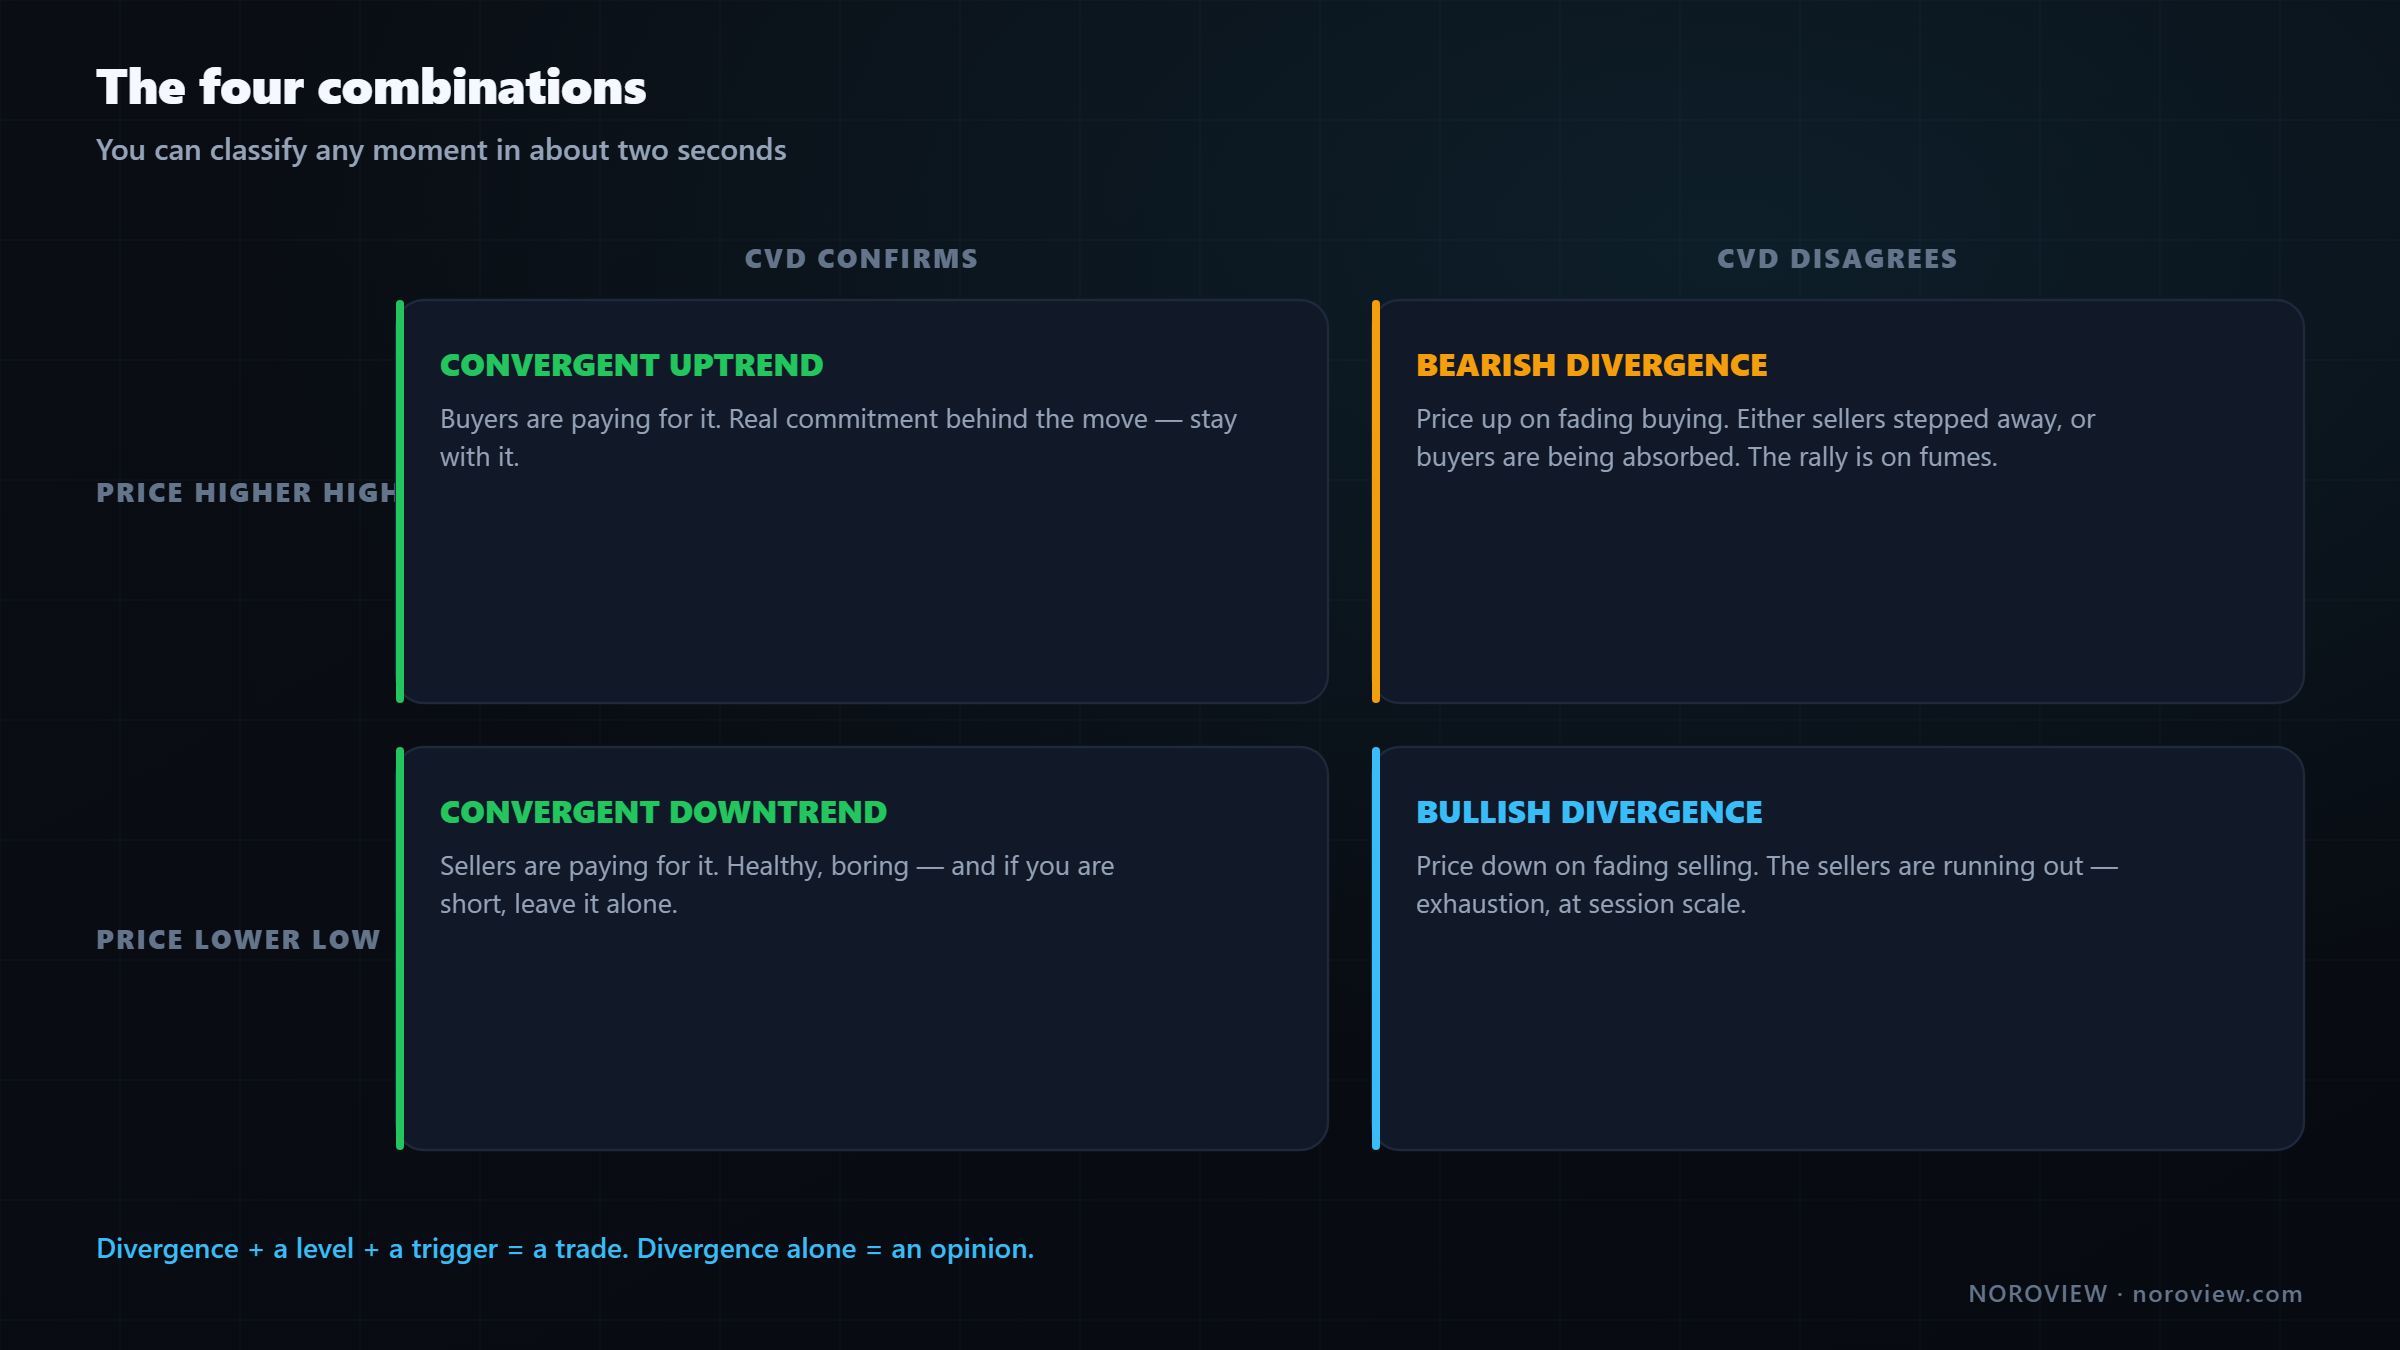
| CVD confirms | CVD disagrees | |
|---|---|---|
| Price higher high | ✅ Convergent uptrend — buyers are paying for it → stay with it | ⚠️ Bearish divergence — price up on fading buying → the rally is on fumes |
| Price lower low | ✅ Convergent downtrend — sellers are paying for it → stay with it | ⚠️ Bullish divergence — price down on fading selling → the sell-off is out of fuel |
Bearish divergence. Price makes a new high; CVD makes a lower high. Price got to a higher level on less aggressive buying than the previous push. That means one of two things, and both are interesting:
- Sellers stepped away and price drifted up on very little buying — price can move on absence.
- Buyers are being absorbed by a bigger seller, so the buying is not producing proportional movement.
Both mean the same thing for you: the move is weaker than it looks.
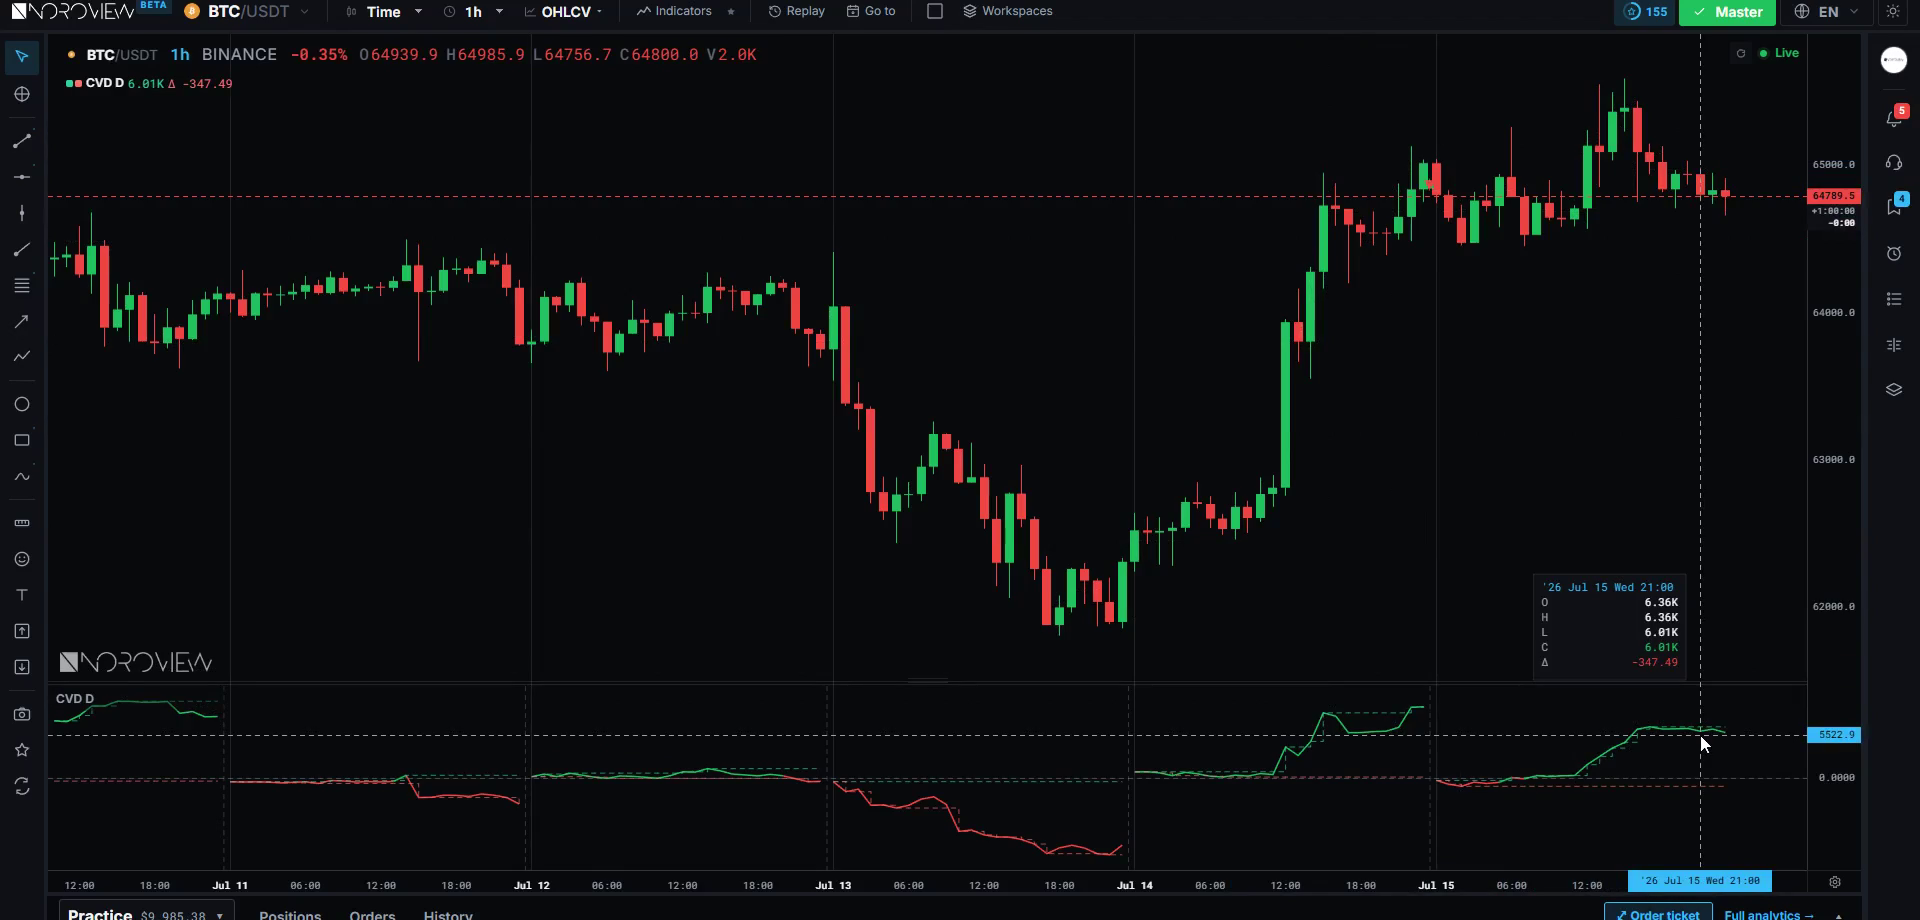
Bullish divergence is the mirror, and it is the one I like most. Price makes a new low; CVD makes a higher low. Price is dripping to new lows on less and less selling — the sellers are running out. That is the exhaustion idea, visible on the session scale instead of inside one candle.
The fifth situation — the one I look for most
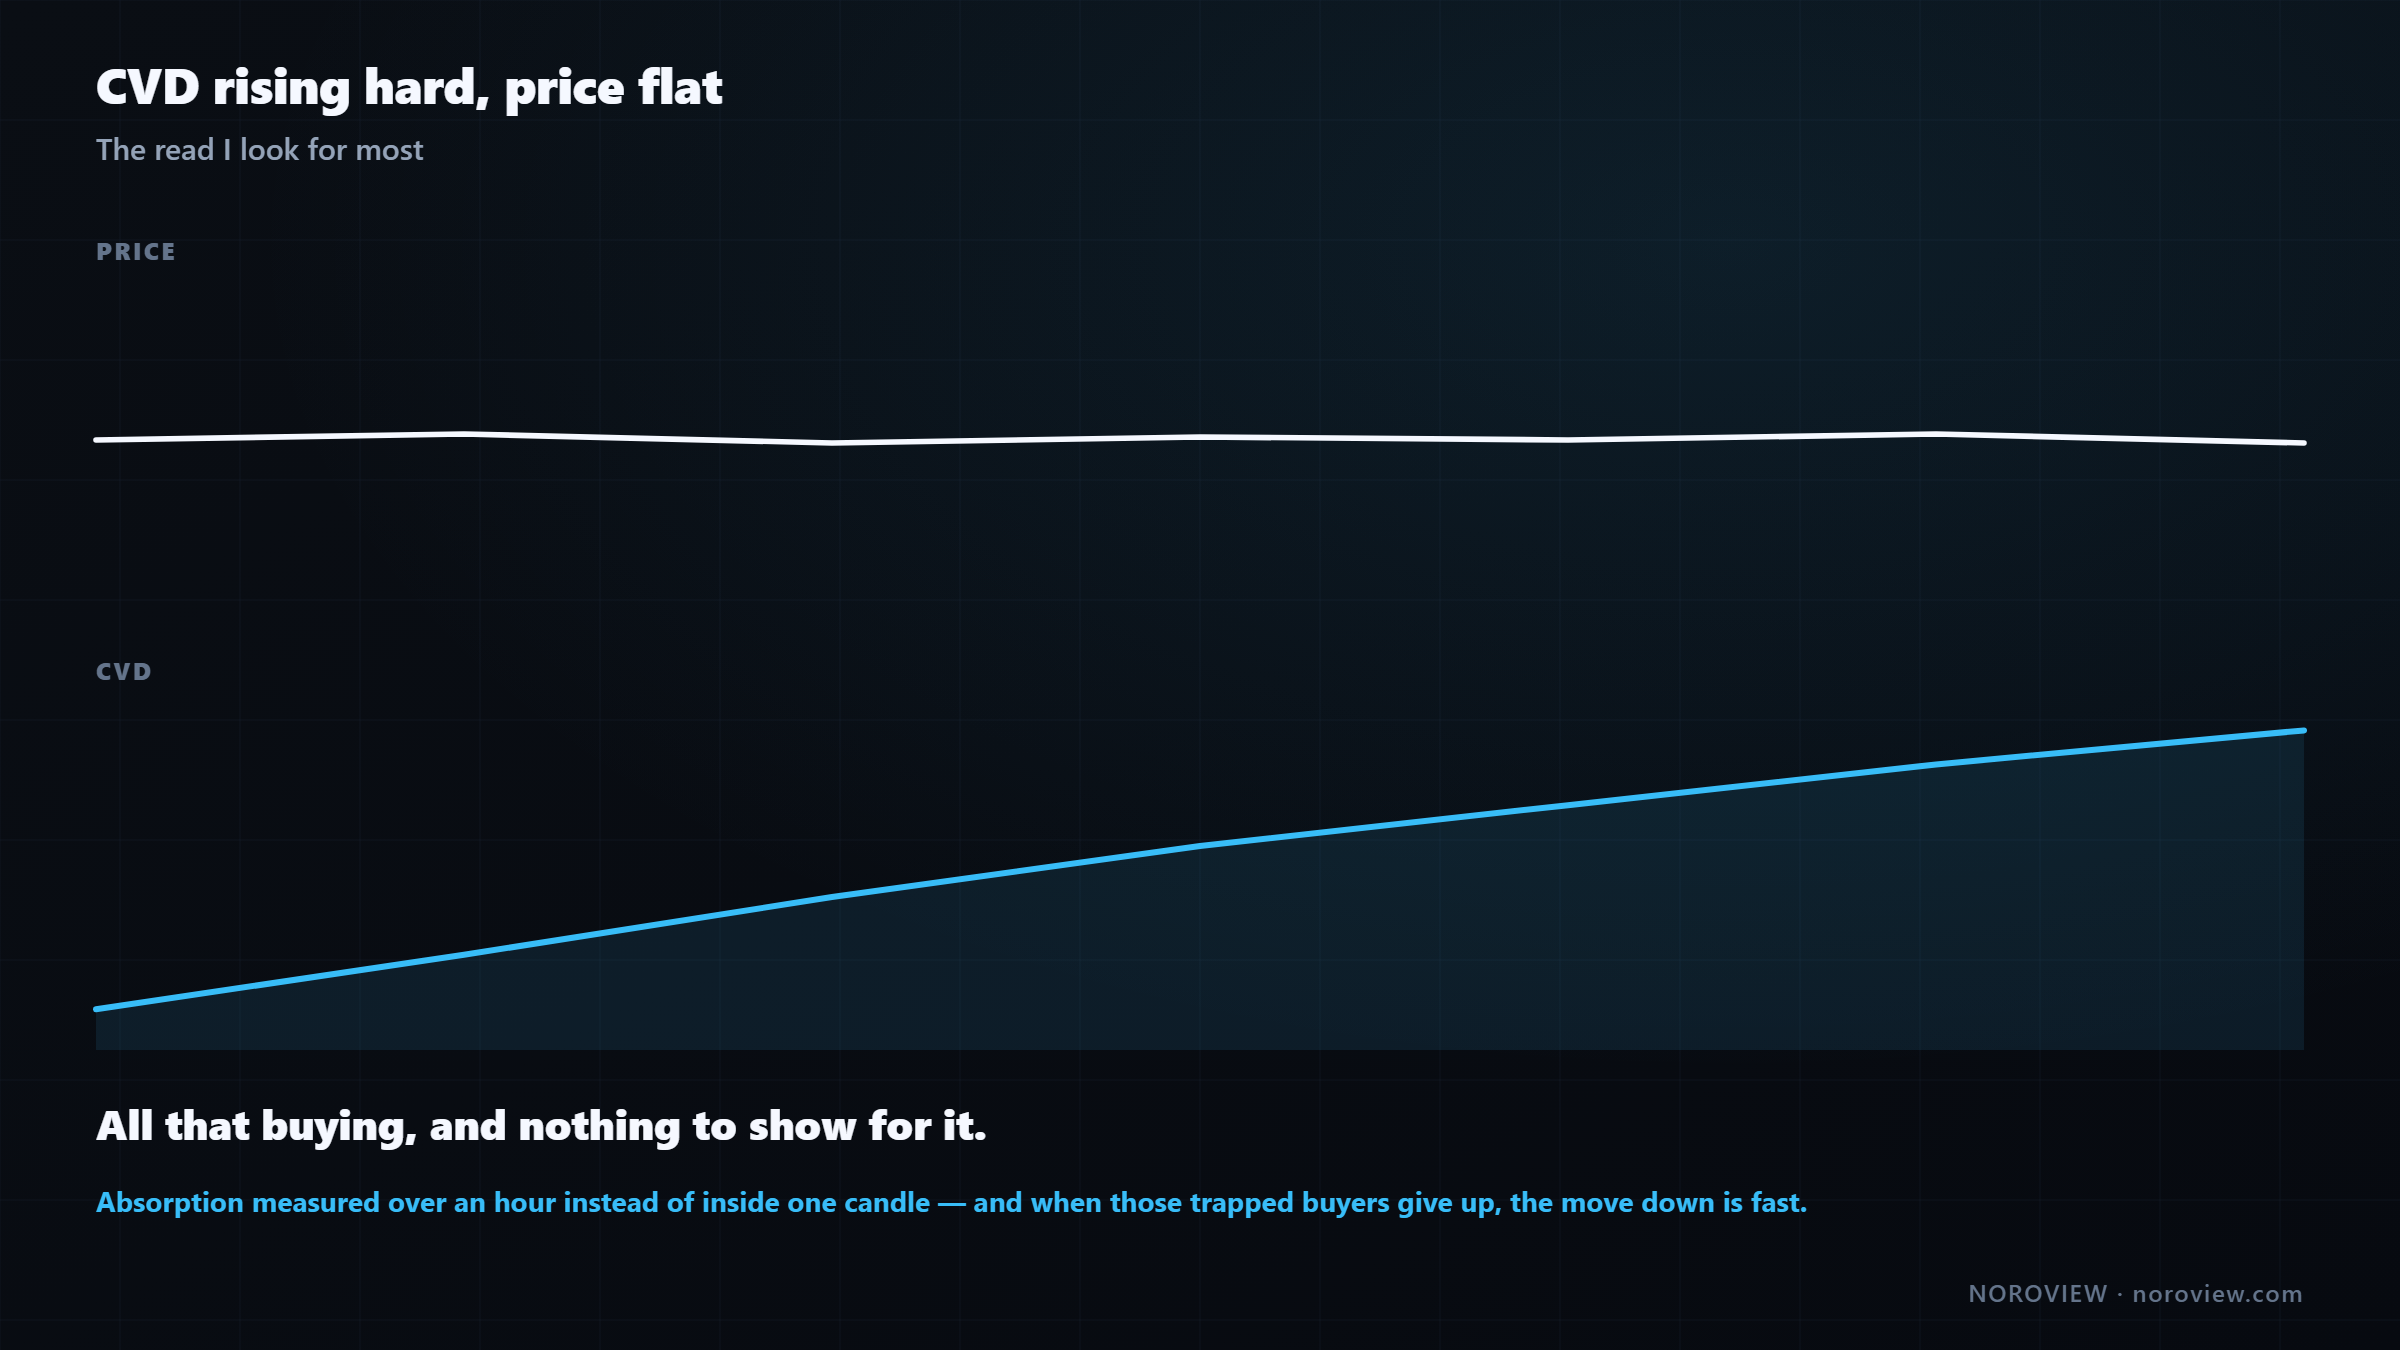
CVD rising hard + price flat = absorption, on the session scale.
CVD climbing steeply — aggressive buyers pouring in — and price going sideways. All that buying, and nothing to show for it. That is absorption exactly as in lesson 10, but measured over an hour instead of inside one candle. Somebody large is selling into every bit of it.
And when those trapped buyers give up, the move down can be fast, because they all need to sell at once.
See the aggression and what it achieved, on one screen
Footprint charts and market replay are free on every plan. CVD and the advanced order-flow indicators sit on the paid tiers. Create a free account → · Compare plans
CVD candles and their wicks
This is the part almost nobody uses, and my favourite thing about the indicator.
Switch Draw as to Candles and CVD stops being a line and becomes a candlestick chart — with an open, high, low and close, for delta.
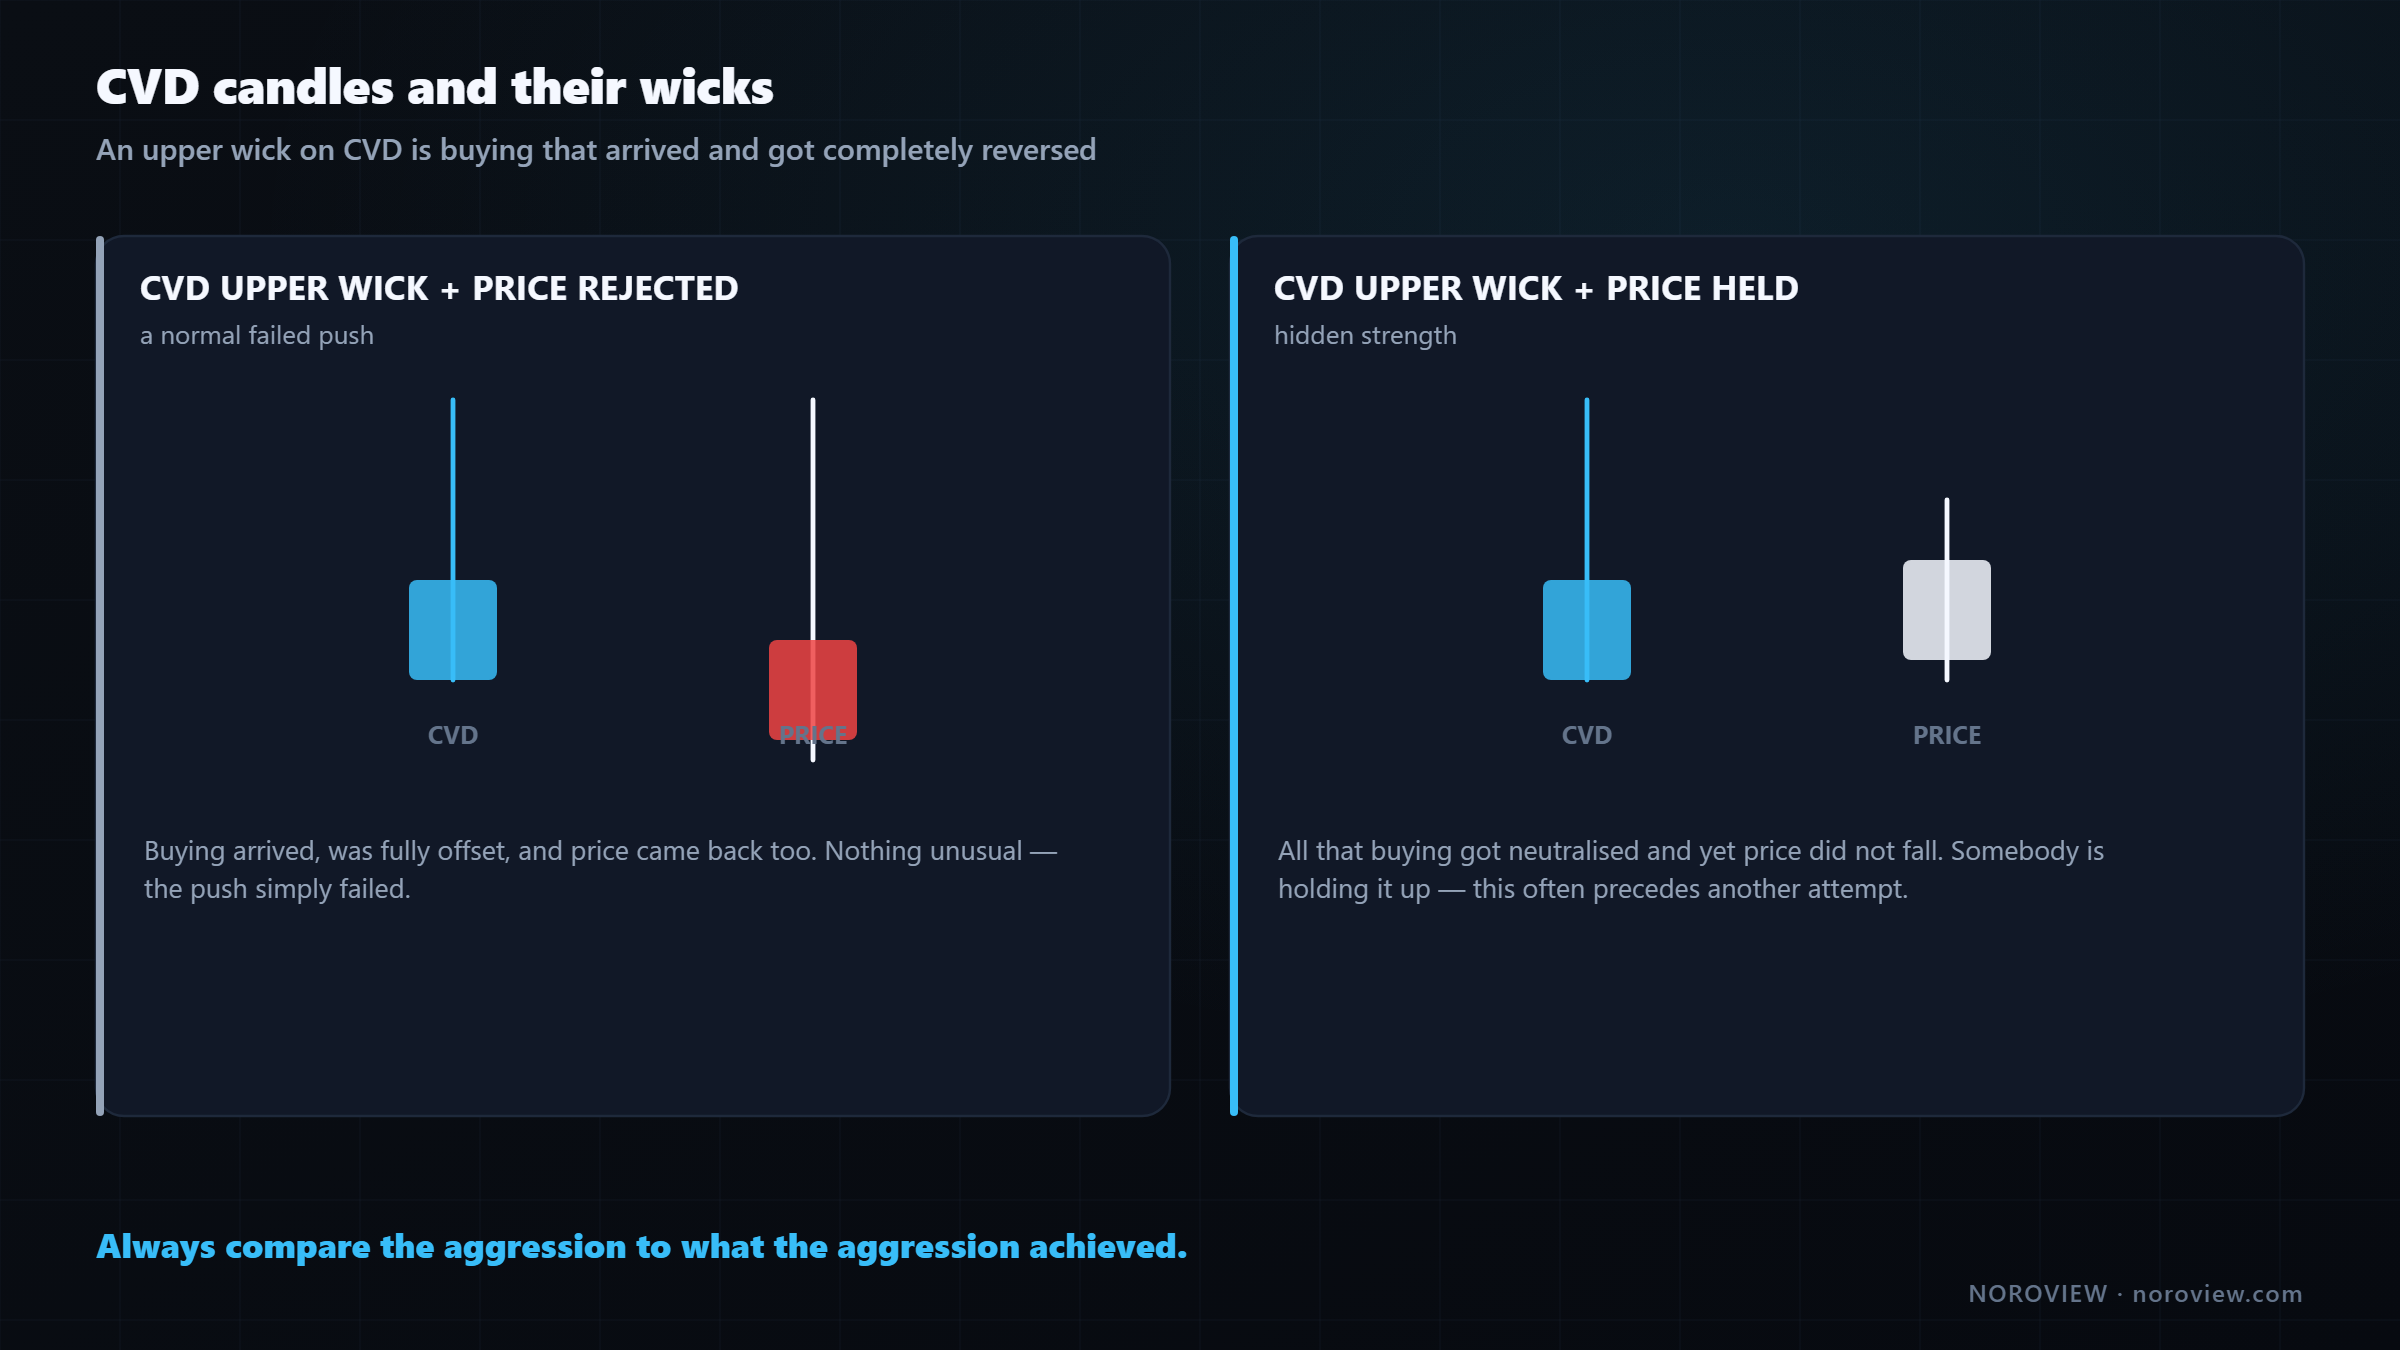
Think about what a wick on a CVD candle means. A long upper wick means that during that period cumulative delta went way up — a burst of aggressive buying — and then came all the way back down by the close.
An upper wick on CVD = buying that arrived, and got completely reversed.
Aggressive buyers came in with size, and by the end of the period all of it had been offset. It achieved nothing.
Now compare that CVD candle to the price candle for the same period. This is the powerful bit:
| CVD | Price | Reading |
|---|---|---|
| Big upper wick | Also rejected | A normal failed push. The buying came, it failed, price came back |
| Big upper wick | Held its level | Unusual. All that buying got neutralised and yet price did not fall — hidden strength, often preceding another attempt |
This is the same skill as reading a footprint candle, one level up. Same idea we have been using since lesson 4:
Always compare the aggression to what the aggression achieved.
That single sentence is honestly the whole course. Footprint does it inside a candle. CVD does it across a session. Same question, two different scales.
Automatic divergence detection
NOROVIEW will find divergences for you. Turn on Detect divergences in the settings and it marks them automatically, with a pivot strength control — exactly the same idea as the swing-point rule from lesson 5: how many candles either side are required before something counts as a genuine high or low.
Higher pivot strength = fewer, more significant divergences.
Same trade-off as every other sensitivity control, and the same advice: set it so you get a handful a day, not dozens.
But attach this warning to the feature specifically, because automatic detection creates a very particular bad habit:
An automatic marker is a place to LOOK. It is not a trade.
When a tool draws a divergence on your chart it feels like a signal. It is not. It is the tool saying "here is a place where price and delta disagreed." Whether that matters depends entirely on where it happened — which the tool does not know, because it has never seen your level map.
A divergence at one of your levels is worth your attention. A divergence in the middle of a range is noise with a label on it.
The four limits
If you remember one section of this article, make it this one — because CVD divergence is probably the single most over-traded idea in all of order flow.
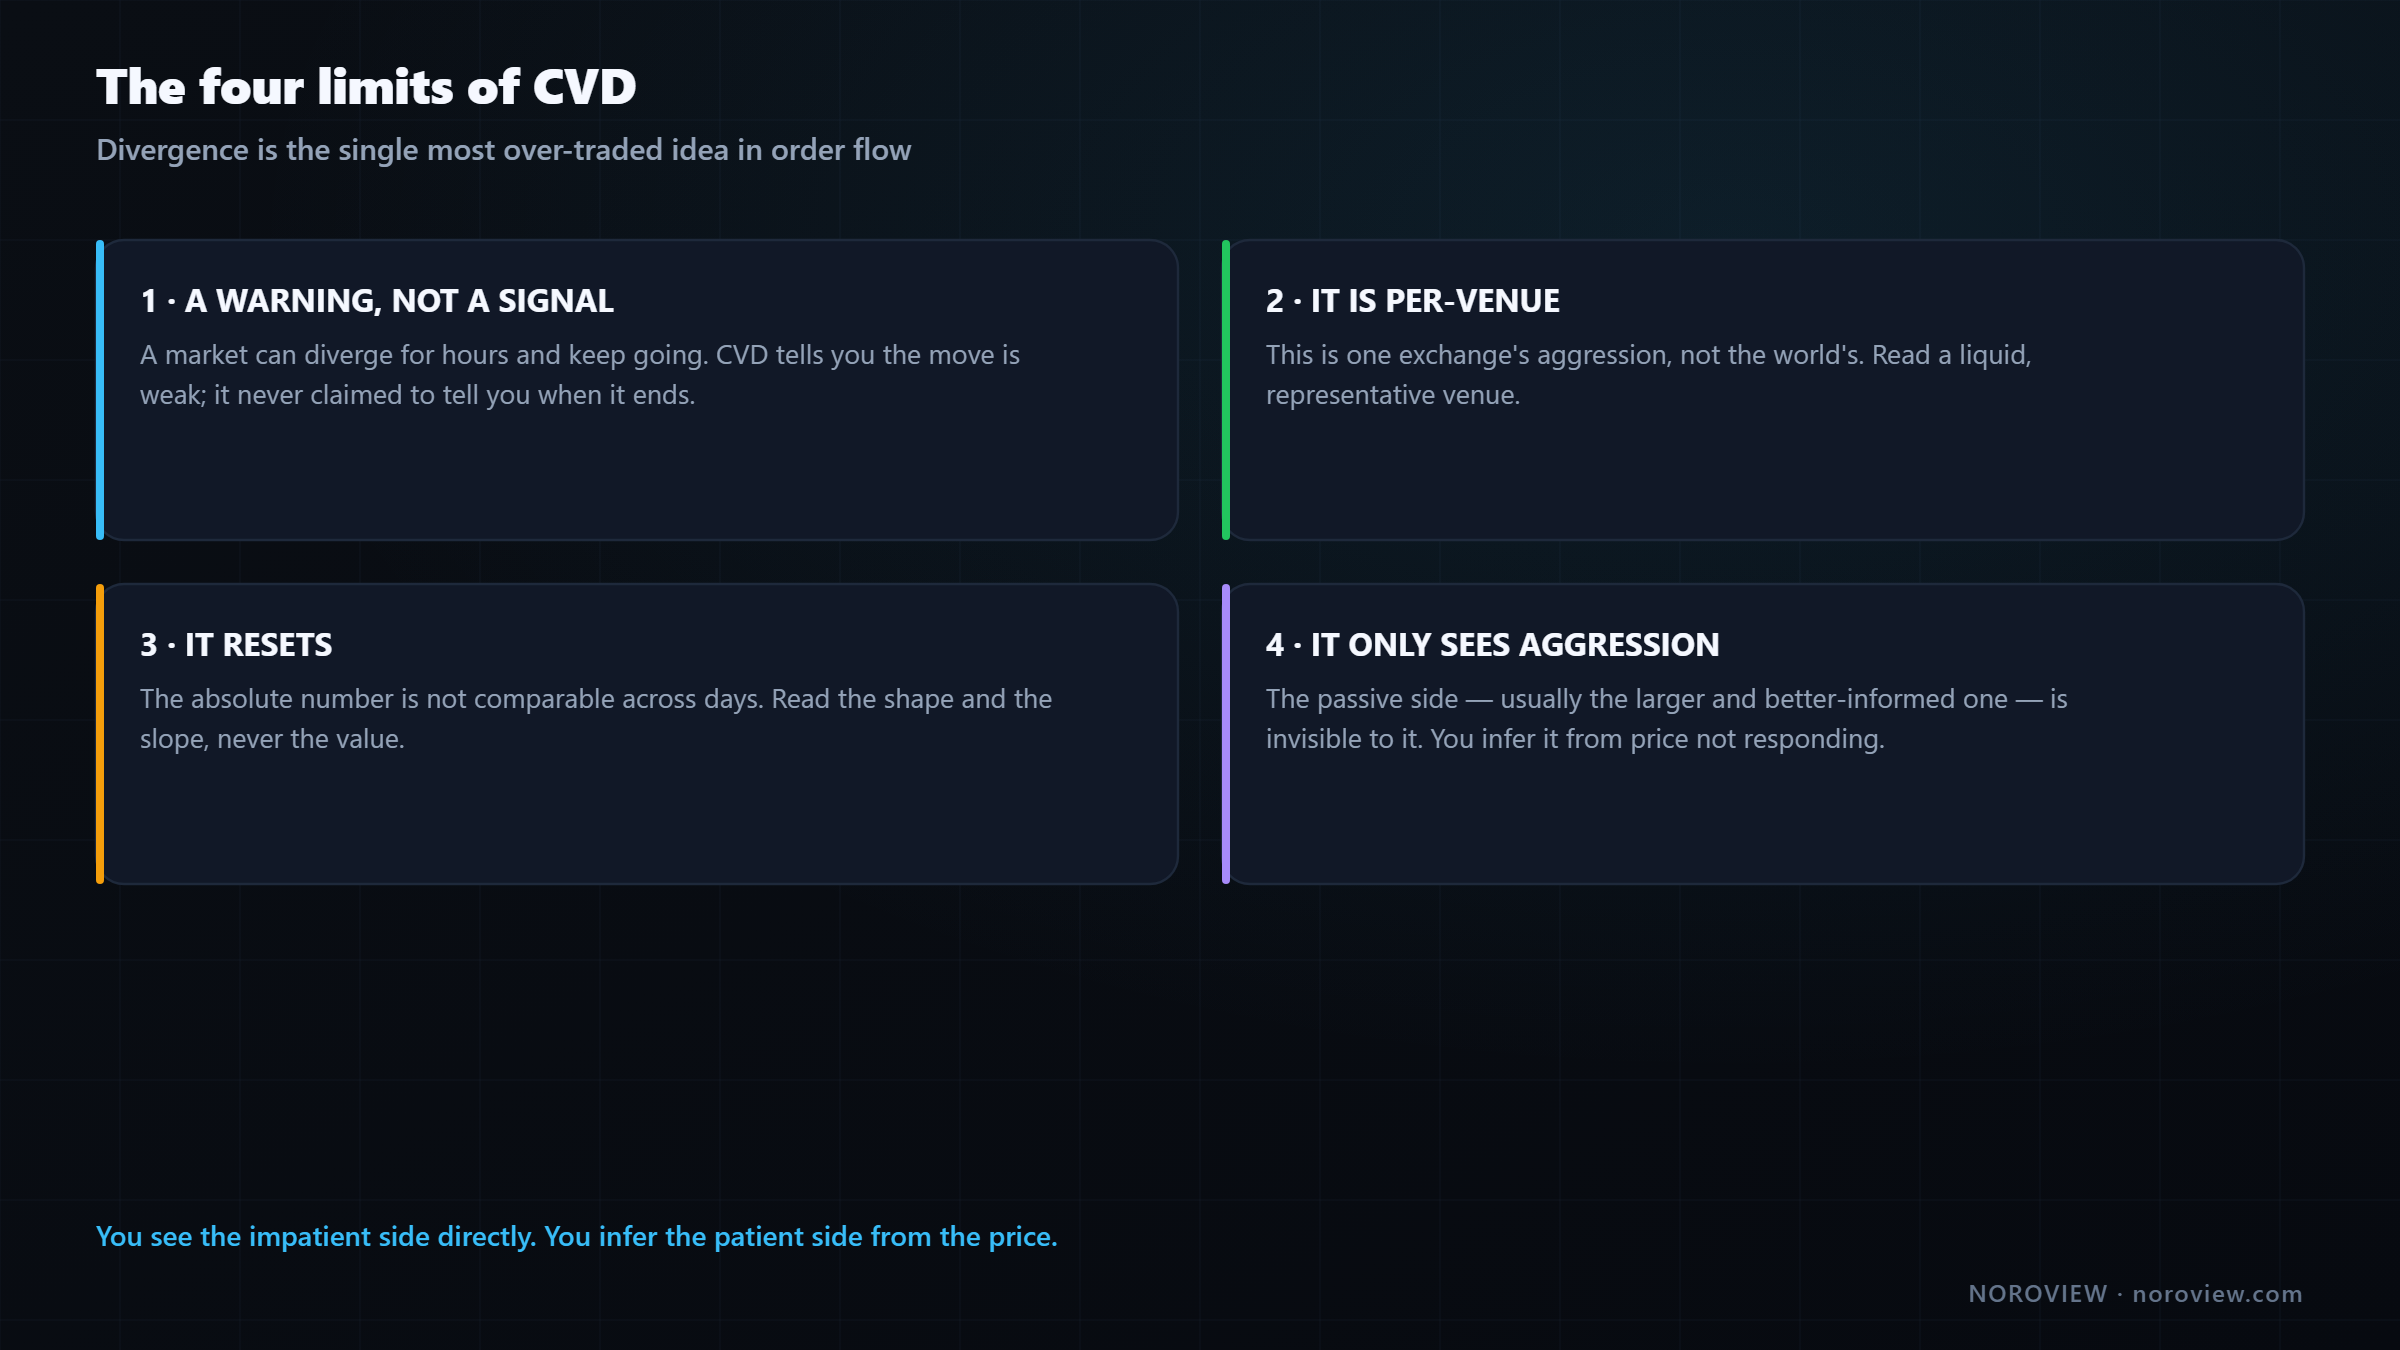
Limit 1 — divergence is a warning, not a signal
A textbook bearish divergence — price makes a higher high, CVD makes a clearly lower high — and then price goes up for another three hours. That happens constantly.
A market can diverge for a very long time and keep going.
Divergence tells you the current move is weaker than it looks. It does not tell you the move is over, and it certainly does not tell you to trade the other way right now. Traders who short the first divergence in a strong trend get destroyed, repeatedly, and then announce that CVD does not work. CVD worked perfectly. It told them the move was weak. It never claimed to tell them when it would end.
Divergence + a level + a trigger = a trade. Divergence alone = an opinion.
Limit 2 — CVD is per-venue
This CVD is this exchange's aggression. Not the world's.
The CVD you are looking at is calculated from the trades on this venue. It is not global, and a different exchange can have a genuinely different CVD shape over the same period because different participants trade there. That is not a flaw — there is no single global market — but it means two things: read a liquid, representative venue, and do not treat a small divergence on one exchange as a statement about all of crypto.
Limit 3 — it resets
CVD resets at the start of each session, which is exactly what you want for reading today, but it means the absolute number is not comparable across days, and a divergence that started before the reset is invisible after it.
Read the SHAPE, not the number.
"CVD is at +14,000" means nothing on its own. "CVD is making lower highs while price makes higher highs" means everything.
Limit 4 — it does not know about passive flow
The deepest limitation, and almost nobody mentions it.
CVD only measures the AGGRESSIVE side. The patient side is invisible to it.
CVD measures aggression — who crossed the spread. It says nothing directly about the passive participants sitting in the book. And as lesson 3 established, the patient side is usually the larger and better-informed one. Larry Harris's Trading and Exchanges treats this asymmetry at length.
So a rising CVD tells you aggressive buyers are active. It does not tell you they are winning. Which is exactly why absorption shows up as a divergence: you are seeing the aggressive side clearly, and inferring the passive side from the fact that price is not responding.
You see the impatient side directly. You infer the patient side from the price.
Once you understand that, CVD stops being a magic indicator and becomes what it actually is: half of a picture — and a very good half.
How I actually use it
- CVD in its own pane, on volume delta, resetting daily, with an MA. I do not change those settings.
- One glance: converging or diverging? That is the session's health. Two-second read, done every time I look at the chart.
- A divergence is a reason to look at my level map — never an entry. If price is nowhere that matters, I note it and move on.
- CVD rising while price goes nowhere is the read I value most. Absorption at session scale, and combined with a level it is one of the highest-quality setups I get.
- In a trade, CVD is a management tool. Converging with my direction, I hold and stay relaxed about noise. Diverging against me, I tighten up — move the stop, take partial profit (lesson 16).
- Never take a trade on CVD alone. It is a context tool. Entries come from a level plus footprint evidence plus a trigger — the model from lesson 11, unchanged.
Common mistakes
- Shorting the first bearish divergence in a strong uptrend. Markets diverge for hours and keep going.
- Treating an automatic divergence marker as a signal. The tool has never seen your level map.
- Reading the absolute CVD value instead of the shape and slope.
- Comparing CVD across venues as though it were a global measurement.
- Confusing ABS delta with the absorption pattern. Different things.
- Leaving the source on trades delta because it looked interesting once.
- Assuming rising CVD means buyers are winning. It means they are active.
Your homework
About an hour.
- Classify ten sessions as convergent or divergent using only the four-combination matrix. Write one sentence per session.
- Find three instances of CVD rising steeply while price goes sideways. Mark what happened next in each, including the one that did nothing.
- Switch Draw as to Candles for a full session and find one CVD candle with a long upper wick. Compare it to the price candle for the same period and write down which of the two readings applied.
Open the terminal and add CVD →
Three things to remember
- CVD is a running total of aggression, and its value is the comparison between how much aggression arrived and how much price moved.
- Divergence is a warning, not a signal. It becomes a trade only with a level and a trigger.
- CVD sees only the impatient side. The patient side — usually the larger one — is inferred from the fact that price is not responding.
← Previous: My Order Flow Entry Model · Course index: Order Flow Trading Course · Next → Fair Value Gaps With Order Flow
Frequently asked questions
What is CVD in crypto trading? Cumulative volume delta is a running total of aggressive buy volume minus aggressive sell volume, accumulated from the start of a session. It rises when buyers are crossing the spread more than sellers and falls when sellers dominate, giving you a picture of aggression over time rather than in a single candle.
What does it mean when price goes up but CVD goes down? It is a bearish divergence: price is reaching higher levels on less aggressive buying than before. Either sellers stepped away and price drifted up on very little buying, or buyers are being absorbed by a larger passive seller. Both mean the move is weaker than it looks.
Does CVD divergence work? It works as a warning, not as a signal. Divergence reliably indicates that a move is running on reduced fuel, but markets can diverge for hours and continue. It becomes tradeable only when it occurs at a level you already care about and a trigger confirms it.
What is the difference between delta and CVD? Delta is the buy-minus-sell figure for a single candle. CVD is those figures accumulated across the session. Delta is a snapshot and is noisy; CVD shows the cumulative story of who has been aggressive and how much movement that aggression actually produced.
Is CVD the same on every exchange? No. CVD is calculated from trades on one venue, so different exchanges can show genuinely different CVD shapes over the same period because different participants trade there. Read a liquid, representative venue and avoid treating one exchange's divergence as a global statement.
What does a wick on a CVD candle mean? An upper wick means cumulative delta spiked upward during the period and was fully given back by the close — aggressive buying that achieved nothing. The useful part is comparing it with the price candle: if price held its level anyway, that is hidden strength.
Can you trade using CVD alone? Not reliably. CVD measures only the aggressive side of the market and says nothing directly about the passive orders that usually determine whether a level holds. It is a context and management tool, best combined with a level map and a footprint-based trigger.
Sources
- Investopedia — volume analysis
- Harris, L. (2003). Trading and Exchanges: Market Microstructure for Practitioners — Oxford University Press
Soroosh Moghimi — six years inside financial markets: algorithmic trading, HFT, crypto and AI, after a decade building startups. He publishes this course free because he already paid for the lessons in it. There is no paid course and no signal group. @sorooshmoghimi · About
Start reading real order flow
You cannot learn this from a candlestick chart, and you do not need to spend a cent to begin. The standard footprint chart is free for every NOROVIEW user, market replay is free, and the paper-trading simulator is free.
Open NOROVIEW free → · Compare plans →
⚠️ DISCLAIMER — EDUCATIONAL CONTENT ONLY
This article is for educational and informational purposes only. It is not financial, investment, or trading advice, and nothing in it is a recommendation to buy, sell, or hold any asset. Trading cryptocurrencies and leveraged derivatives is high risk and can result in the loss of some or all of your capital. Only risk money you can afford to lose. Any levels, indicators, signals or results shown are illustrative and are not a promise or prediction of future performance. Charts may be shown on a demo or paper-trading account and do not represent real trades or returns. Always do your own research. You alone are responsible for your decisions.
Keep reading
Related posts

16. Trade Management: Break-Even, Partials and Trailing Stops
Trade management explained: when break-even stops cost you money, partial exits, four kinds of trailing stop, the order-flow exit, and diagnosing yourself with MFE and MAE.

15. How to Day Trade Crypto With Order Flow (Starting Small)
How to day trade crypto with order flow: exchange security, spot vs perpetuals, leverage and liquidation, order types, fees, and an honest $100 starting plan.

14. Risk, Drawdown and the Mind: Day Trading's Real Edge
Day trading risk management and psychology: position sizing math, drawdown recovery arithmetic, hard limits, decision vs outcome, and the five states that break traders.

13. Fair Value Gaps, Confirmed With Order Flow
Most fair value gaps do nothing. Five order-flow checks that tell you in advance which FVGs are worth trading and which are decoration.

5. Market Structure and Trend: How to Pick Your Side Objectively
How to identify market structure objectively: higher highs and higher lows, swing point rules, impulse vs correction, and the arithmetic behind trading with the trend.
11. My Order Flow Entry Model, Step by Step
A complete order flow entry model: the four conditions, the exact trigger candle, the value-area filter, and the ten-item blocker list that vetoes a trade.
Discussion (0)
Want to join the discussion? Comments live inside the platform.
Open NOROVIEW