
3. How Price Really Moves: The Order Book, Aggressors and the Auction
How price really moves: why 'more buyers than sellers' is impossible, how aggressive orders walk the book, and why some moves get given straight back.
3. How Price Really Moves: The Order Book, Aggressors and the Auction
Almost everyone who trades believes price goes up when there are more buyers than sellers. That is impossible. Every trade in history has exactly one buyer and one seller — the counts are identical by definition, every single time. Price moves for a completely different reason: one side was impatient enough to cross the spread and consume the orders waiting on the other side. Understanding that one mechanism turns footprint charts from a mystery into something obvious.
This is the most important conceptual lesson in the course. Open a live order book while you read it — the mechanics land much faster when you can see them happening.
What you'll learn in this lesson
- Why every market is an auction, and what an auction is actually trying to do
- The bid, the ask and the spread — and why the spread is the price of impatience
- Passive vs aggressive orders, and the two phrases you will use for the rest of your trading life
- Exactly how a price is formed, tick by tick, with a worked order-book example
- The second way price moves — the one that produces the moves that get given straight back
- Why a whale can hide almost everything except the fact that they had to trade
- Time candles vs range candles, and which to use for what
Lesson 3 of 16 · Part 1 — Analysis. Part of the free order flow trading course. Previous: Level 1 vs Level 2 Market Data. Next: How to Read Footprint Charts.
▶ Prefer to watch it?
Footprint Charts & Range Candles Explained — NOROVIEW Charts Masterclass (Ep 2) covers the candle types and chart types in full. The 30-second version of why this matters: Your candlestick is hiding THIS
Key terms
| Term | What it means |
|---|---|
| Bid | The highest price a buyer is currently willing to pay |
| Ask (offer) | The lowest price a seller is currently willing to accept |
| Spread | The gap between the best bid and the best ask |
| Passive order | A limit order that joins the queue and waits. Provides liquidity. Also called a maker |
| Aggressive order | A market order that crosses the spread and trades immediately. Takes liquidity. Also called a taker |
| Lifting the offer | An aggressive buyer taking the seller's price. Prints as a buy |
| Hitting the bid | An aggressive seller taking the buyer's price. Prints as a sell |
| Walking the book | One order consuming several price levels of resting liquidity in sequence |
| Slippage | The difference between the price you saw and the average price you actually got |
Every market is an auction
A market is an auction whose only job is to find the price where business actually happens. Not the "correct" price, not the "fair" price — the price where somebody is genuinely willing to transact. Everything else in order flow is a consequence of that.
A normal auction has one seller and many buyers, and price rises until only one buyer is left. A financial market has many buyers and many sellers at the same time, running continuously in both directions, with either side able to be the aggressor. But the underlying job is identical. The CME's material on auction market theory describes the same process in listed futures.
Here is the consequence that matters:
- If price goes somewhere and nothing trades, the auction has failed there and it will leave, usually fast.
- If price goes somewhere and a lot of business happens, the auction has found something. It tends to stay, and it tends to come back later.
That single idea explains volume profile, it explains value areas, and it explains why some levels hold and others do not. We use it in six different lessons. Write it down.
The fish market
End of the day. A seller has fish that will not survive the night. He starts high. Nobody buys. He lowers the price. Still nobody. He lowers it again — and suddenly three people step forward.
He has found the price where business happens. Lower than that and he is giving money away.
That is exactly what a market does when it falls. It is not "collapsing." It is advertising lower prices until buyers show up. And when it rises, it is advertising higher prices until sellers show up.
Price falls until buyers appear. Price rises until sellers appear.
Every move you will ever see is a search. Once you see it that way, you stop asking "why is it going down" and start asking "where are the buyers going to appear" — which is a question you can actually answer.
Bid, ask and the spread
In every electronic market there is an order book, and it is much simpler than it looks. It is two lists.
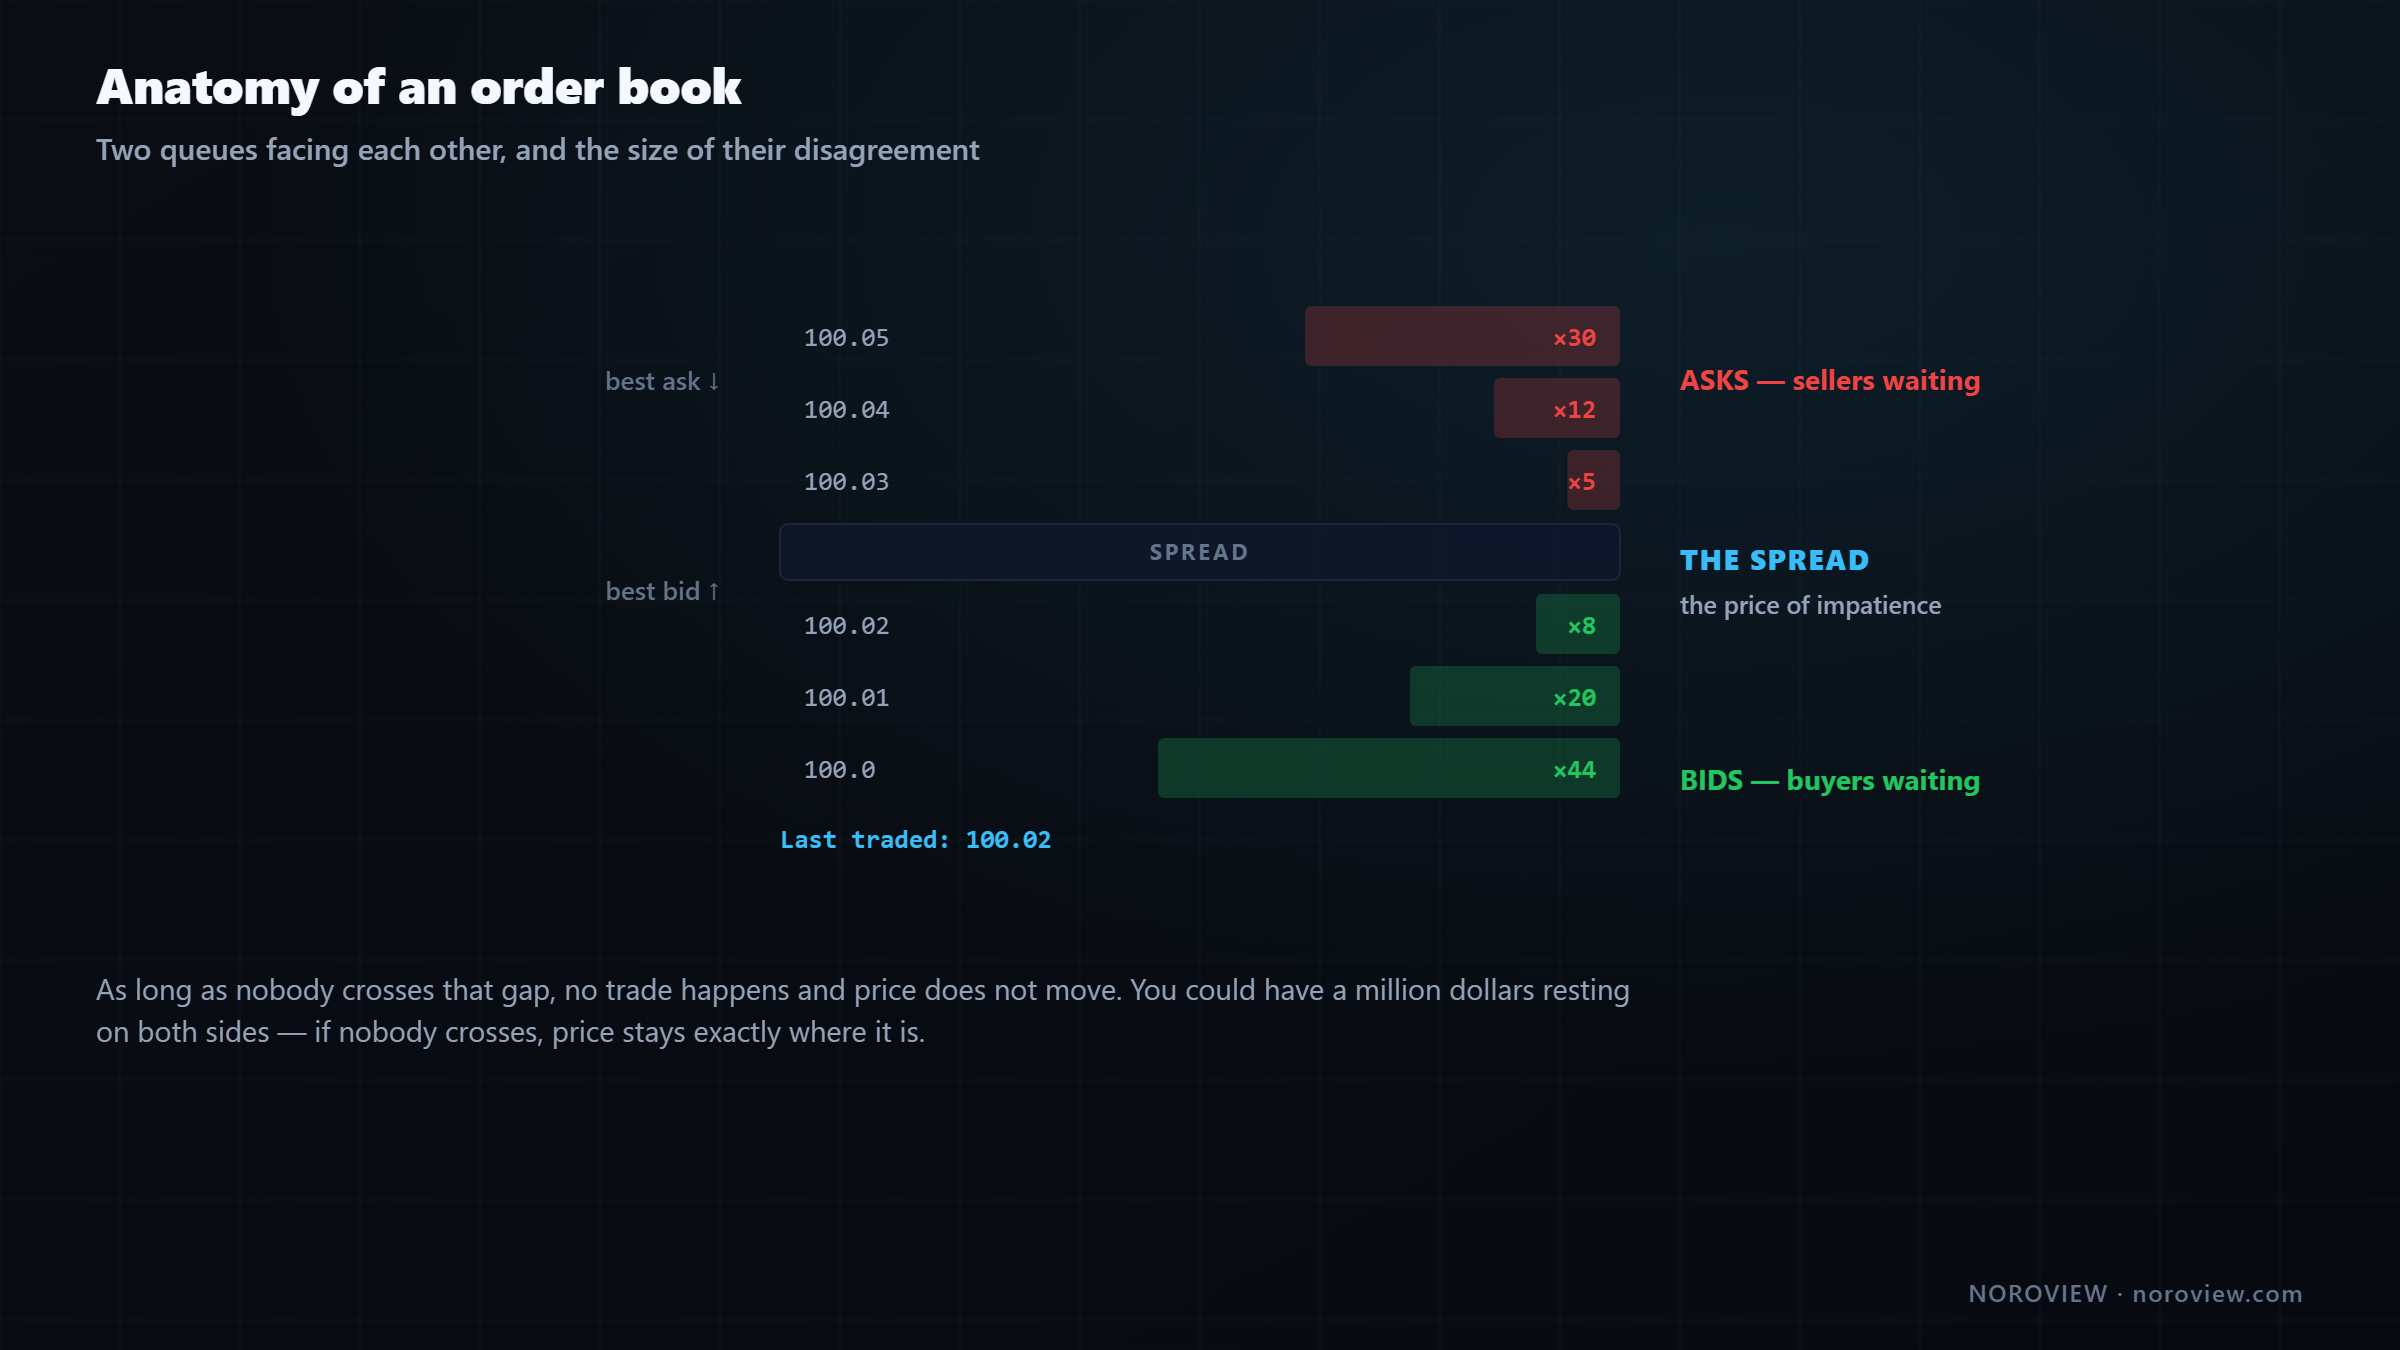
The lower list is the bids — people who want to buy. Each has stated the maximum price they will pay and how much they want. They are standing in a queue, waiting.
The upper list is the asks, also called offers — people who want to sell. Each has stated the minimum they will accept and how much. Also a queue.
The best bid is the highest price anyone is currently willing to pay. The best ask is the lowest price anyone is willing to sell at. The gap between them is the spread.
Think about what the spread actually is: the distance between the most generous buyer and the most generous seller. It is the size of their disagreement, and it is the price of immediacy. If you want to trade now, you pay it.
And here is the consequence people miss: as long as nobody crosses that gap, no trade happens and price does not move. You could have a million dollars of orders resting on both sides, and if nobody crosses, price stays exactly where it is. Indefinitely.
Every row in that book is a limit order — an instruction that says "trade for me, but only at this price or better."
▶ Try this now
Open the order book (
Alt+O) on BTC/USD and find the spread. On a liquid market it will usually be one tick wide, because there is intense competition to be at the front of each queue. Now switch to a much less liquid market and look again — the spread will be visibly wider, and that width is telling you exactly how much less competition there is. Launch NOROVIEW free →
Passive and aggressive: the distinction that unlocks everything
There are two completely different ways to be in a market, and almost nobody explains the difference clearly.
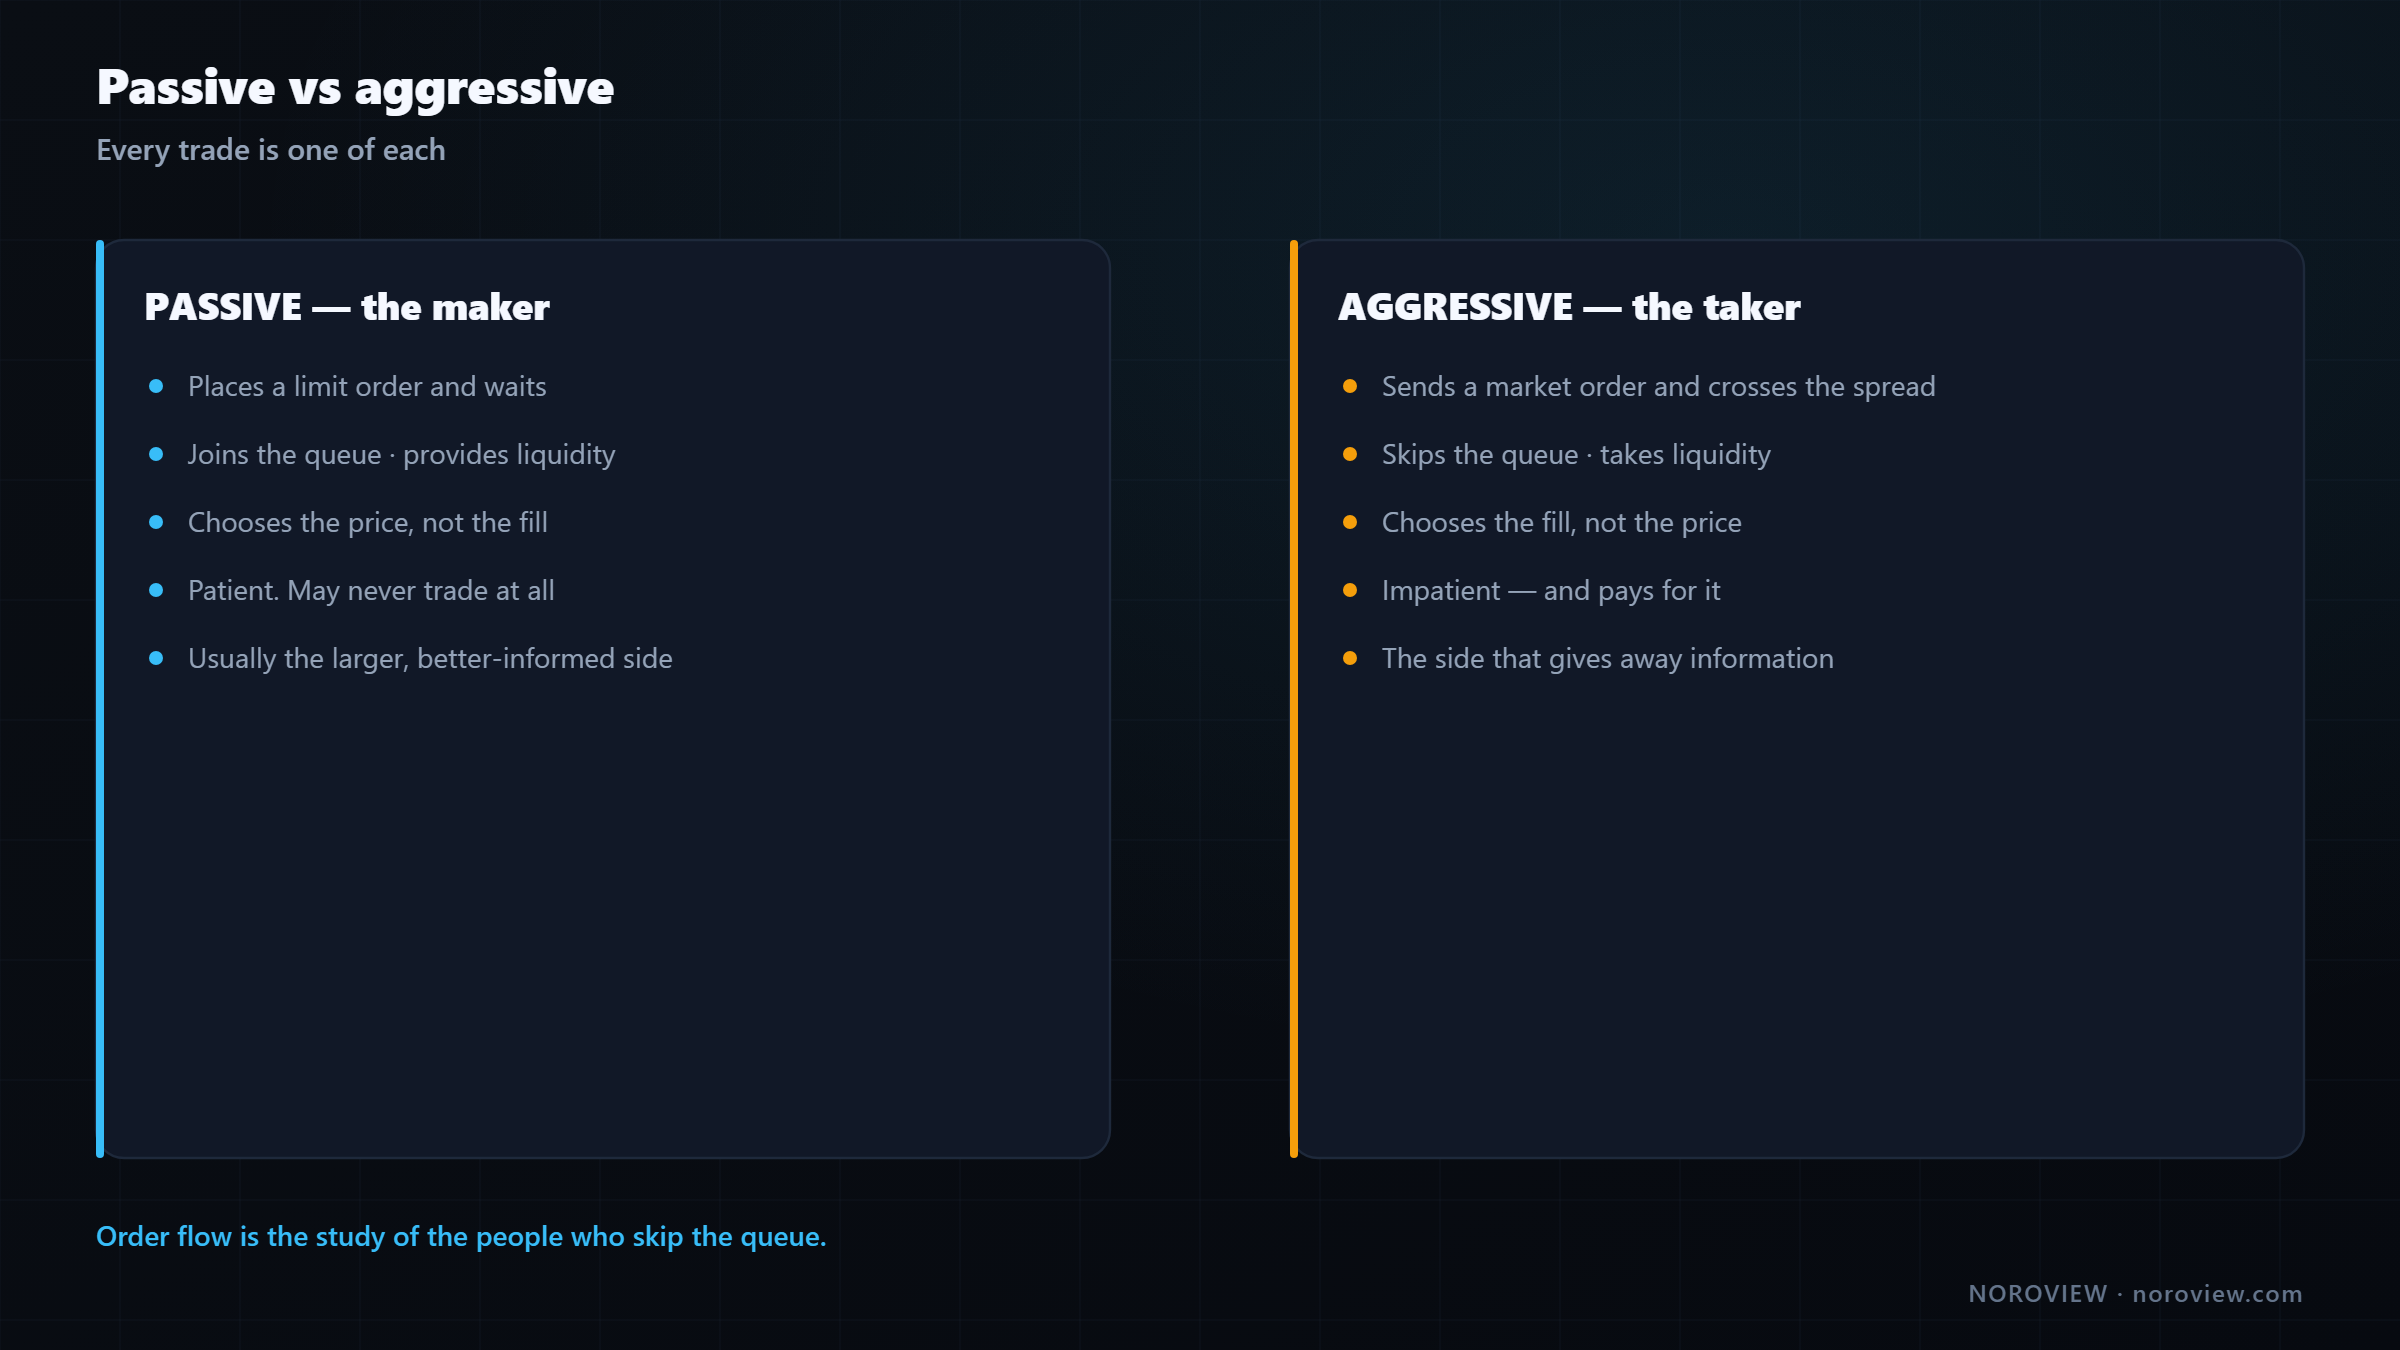
The passive participant places a limit order and waits. "I will buy — but only at $95,000. If it comes to me, fill me. If it does not, I do not trade." They are joining a queue. They are providing liquidity — making an offer somebody else can take. They are patient. They might wait all day, and they might never get filled.
The aggressive participant does the opposite. "I want in now, at whatever the market is offering." They send a market order, and it immediately trades against whoever is at the front of the opposite queue. They are taking liquidity. They are impatient, and they pay for it.
| Passive | Aggressive | |
|---|---|---|
| Order type | Limit | Market |
| Relationship to the queue | Joins it | Crosses it |
| Liquidity | Provides | Takes |
| Exchange term | Maker | Taker |
| Fee | Usually lower | Usually higher |
| Certainty of fill | None | Immediate |
| Certainty of price | Exact | None |
That last row is the whole trade-off: passive orders control price but not fill; aggressive orders control fill but not price.
The sentence that unlocks the course
Every trade is one aggressive participant and one passive participant. Somebody was waiting, and somebody came and took it.
So when I say "a buy" in this course, I am not talking about the person who bought — both sides always exist. I am talking about which side was aggressive:
- Aggressive buy = a buyer lifted the offer. Recorded as a buy. Green.
- Aggressive sell = a seller hit the bid. Recorded as a sell. Red.
Same event, two people — but we label the trade by who was in a hurry. Because the one in a hurry is the one giving away information. Patience is cheap. Impatience costs money, and people do not pay unless they have a reason.
The queue
Picture a queue at a counter. The people in the queue are the passive orders, waiting for their price. Now somebody walks in, ignores the queue, and pays extra to be served immediately. That is an aggressive order.
The people in the queue tell you what the market thinks it is worth. The person who skips the queue tells you what somebody needs, right now.
Order flow is the study of the people who skip the queue.
How a price is actually formed, tick by tick
Let us build a price from nothing. Simple numbers. Follow every step, because after this, order flow is just detail.
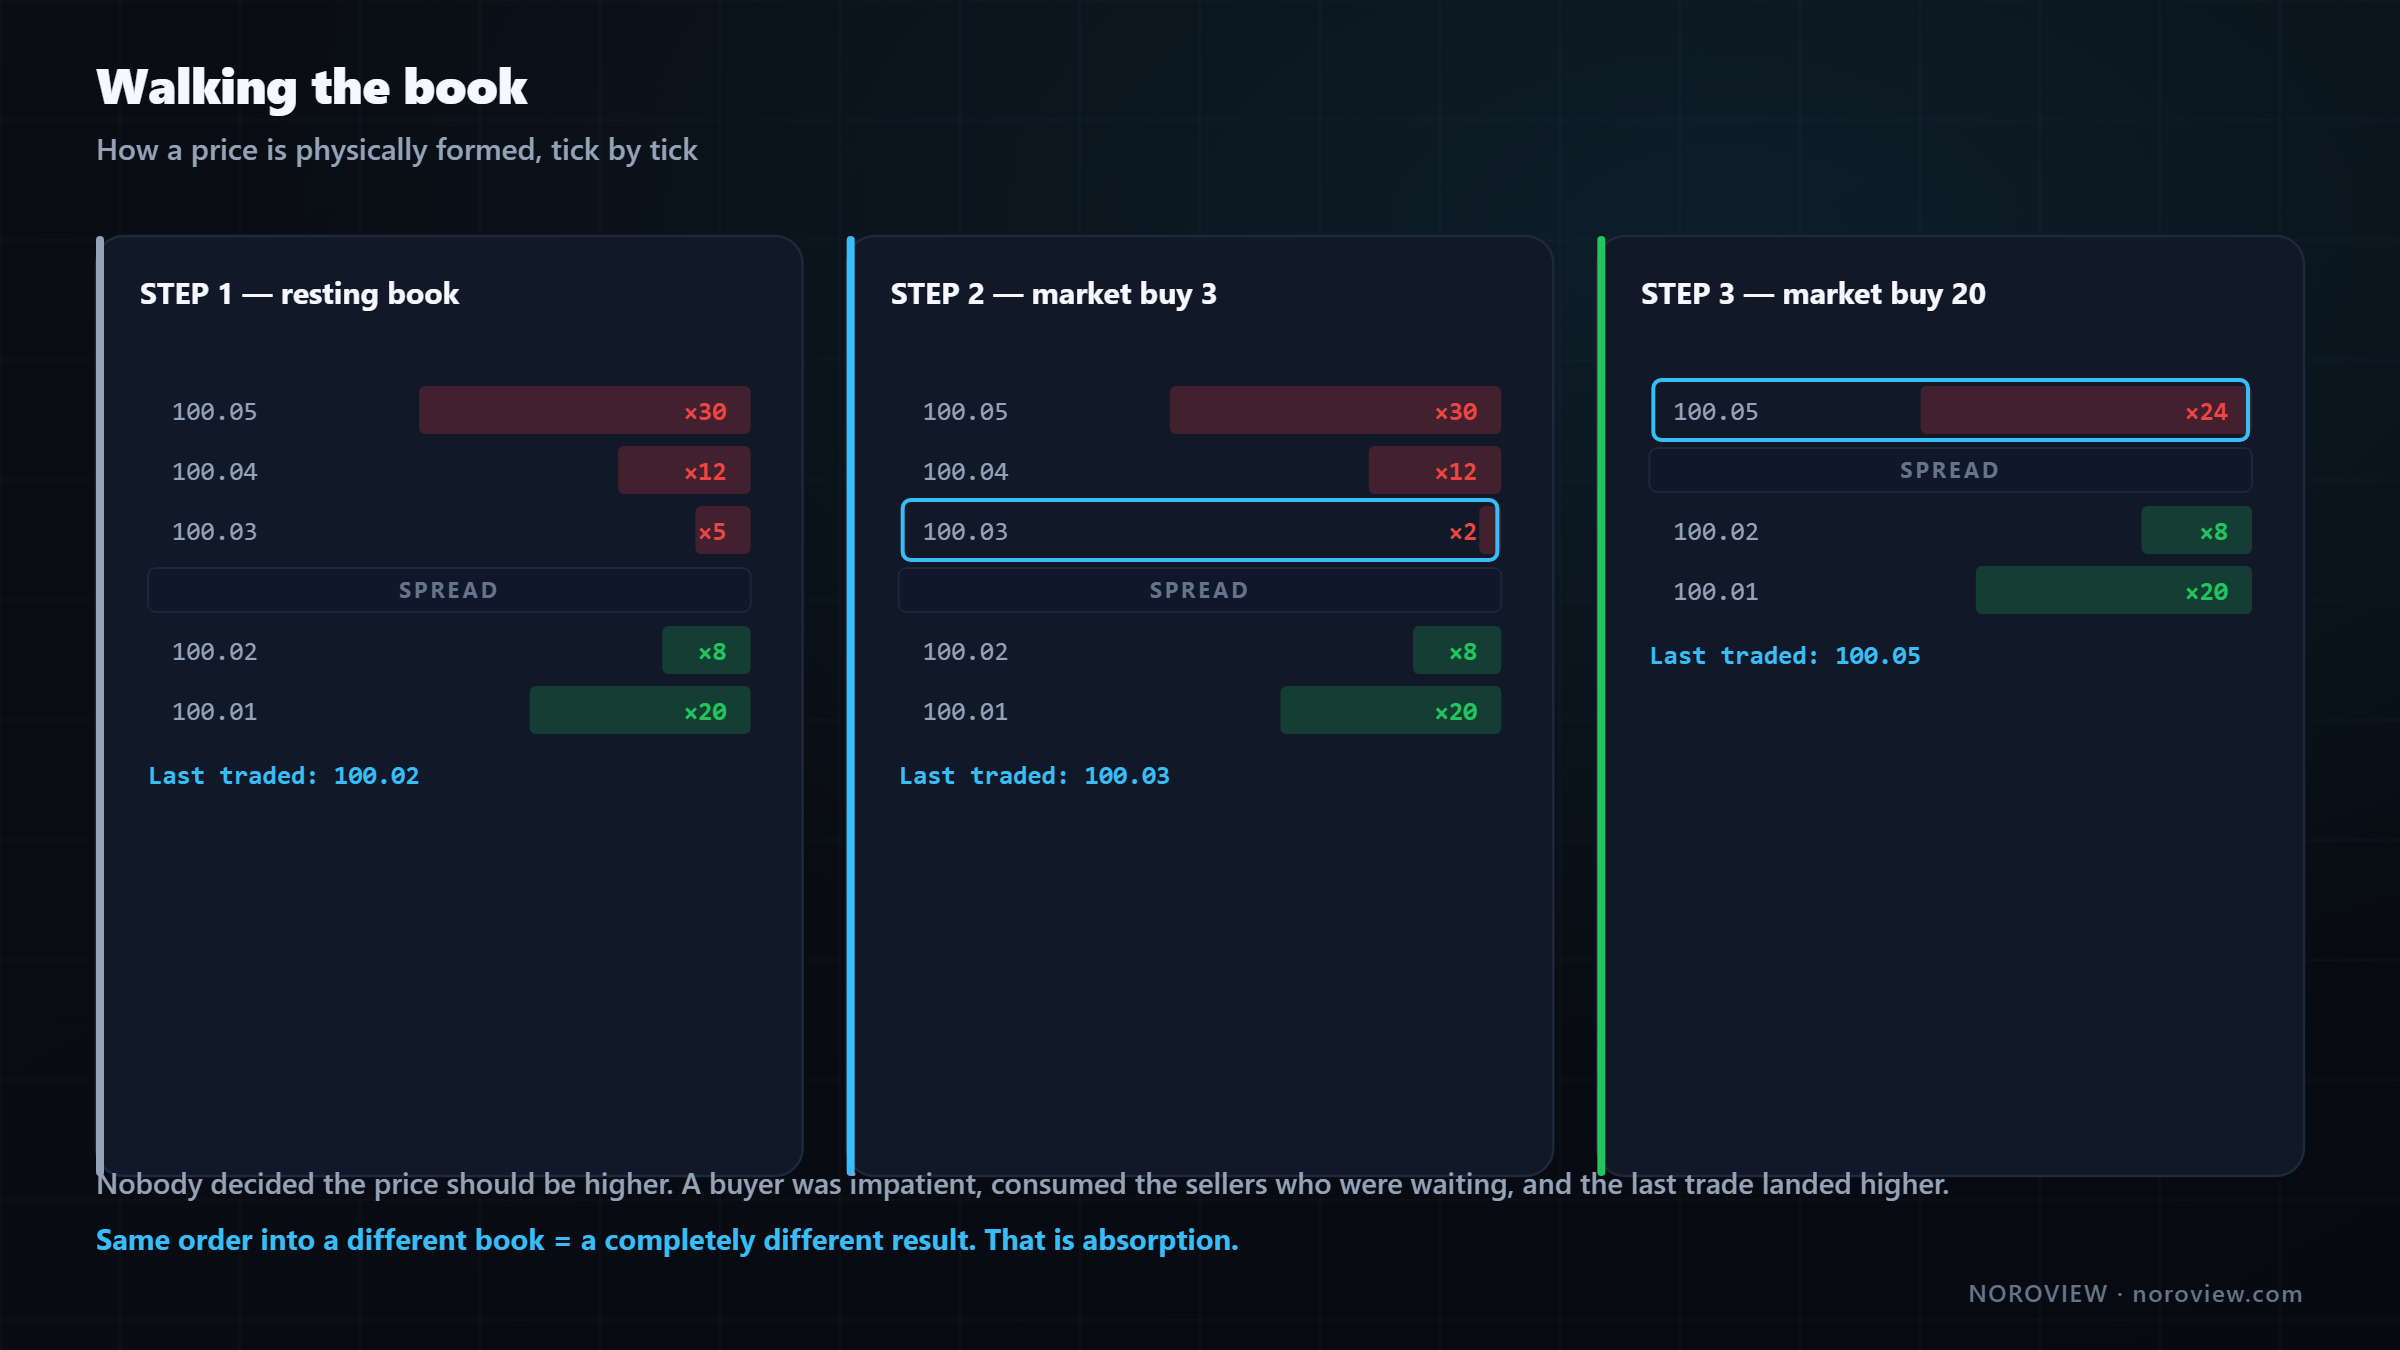
Step 1 — the starting book
        ASKS (sellers waiting)
   100.05   ×30
   100.04   ×12
   100.03   ×5        ← best ask
   ─────────────────── spread
   100.02   ×8        ← best bid
   100.01   ×20
        BIDS (buyers waiting)

   Last traded price: 100.02
Sellers waiting above, buyers waiting below. Nothing is happening. Price is not moving — which, by the way, is the normal state of a market. Most of the time, nothing is happening.
Step 2 — a market buy for 3 arrives
Somebody wants to buy three units immediately. Their order goes to the front of the ask queue and takes three of the five sitting at 100.03.
   100.03   ×2        ← two left
   Last traded price: 100.03  ▲
Price just moved, from 100.02 to 100.03.
Notice what actually happened. Nobody decided the price should be higher. There was no vote. A buyer was impatient, they consumed some of the sellers who were waiting, and the last trade happened at a higher price.
That is all "price went up" means. Ever.
"The price" = the price of the most recent trade. Nothing more.
That trade is recorded as a buy, in green, because the buyer was the aggressor. On the other side of it was a passive seller — who is probably very happy, because they got exactly the price they asked for.
Step 3 — a market buy for 20 arrives
Now a bigger one. Somebody wants twenty units, right now.
Only two left at 100.03, so they take those two. Their order is not finished, so it moves up to 100.04 and takes all twelve there. Still not finished — six units left. Up to 100.05, taking six of the thirty sitting there.
   100.05   ×24       ← best ask now
   ───────────────────
   100.02   ×8        ← best bid unchanged
   Last traded price: 100.05  ▲▲
That is called walking the book, and it is exactly how every fast move you have ever seen on a chart happens: one aggressive order eats through multiple levels of resting liquidity, and the last trade ends up several ticks away.
Three things to notice — each becomes a later lesson
1. The buyer paid a worse average price than the one they saw. They saw 100.03 and ended up with a blended fill across three levels. That difference is slippage — a real, measurable cost that grows dramatically in thin markets and fast moves. It is why you cannot trade illiquid coins with size, and why market orders during a violent minute are dangerous.
2. The size of the move depended on the book, not on the order. That same twenty-unit order would have moved price a completely different distance in a different book. If there had been five hundred units resting at 100.03, that order would have moved price zero. It would have been completely absorbed.
Same order. Different book. Completely different result.
Hold onto that — it is the seed of the most valuable pattern in this entire course. When a large aggressive order arrives and price does not move, something important is happening. That is absorption, and it gets a full lesson.
3. Volume was created at every level on the way. Two units at 100.03. Twelve at 100.04. Six at 100.05.
On a normal candlestick chart, all of that becomes one number at the bottom of the screen: twenty. On a footprint chart, you see it exactly the way I just described it — level by level. That is what a footprint chart is. That is the entire concept.
See the volume at every price, not just the total
The standard footprint chart is free for every NOROVIEW user. No download, no data-feed bill, no workstation. Create a free account → · Compare plans
The second way price moves
This is the part that separates people who genuinely understand markets from people who have memorised a definition.
I just showed you price moving because a buyer consumed the sellers. That is one way. There is a second, completely different way.
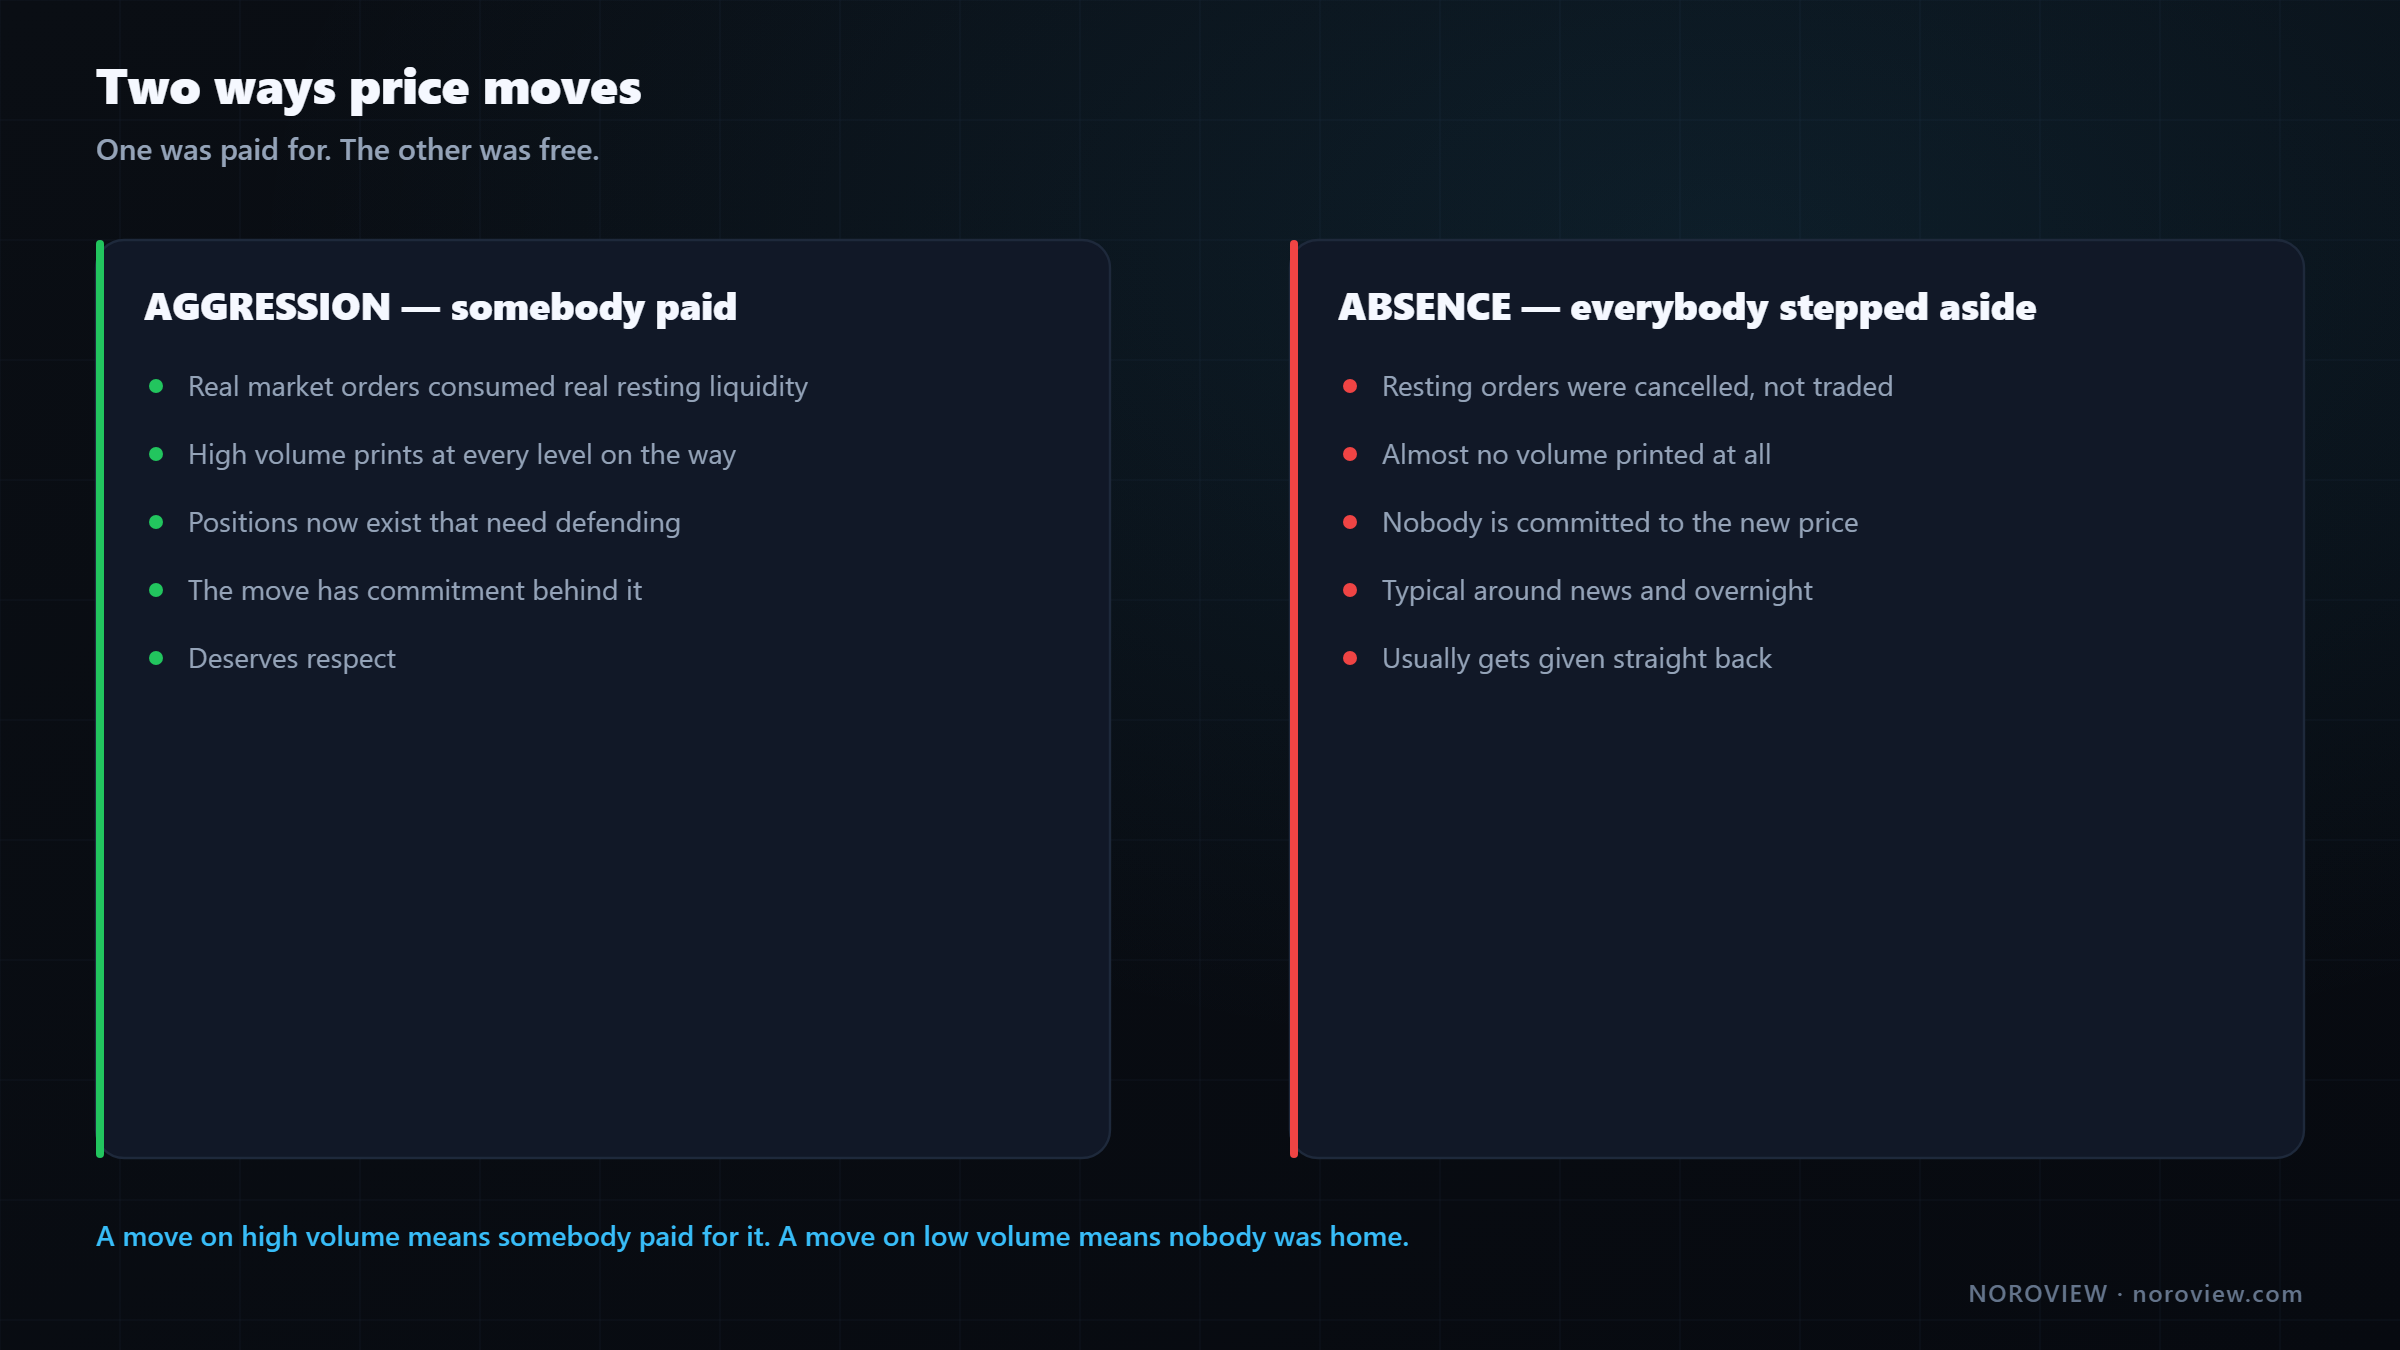
Sellers can simply leave.
Nobody bought anything. No trade happened at all. The participants offering to sell at 100.03 cancelled and walked away. Now the best ask is 100.05. The market is "higher" and not a single unit traded.
Price can move on aggression. Or on absence.
This matters enormously.
A move driven by aggression — real orders eating real liquidity — is a move somebody paid for. It has commitment behind it, and there are now real positions that need defending.
A move driven by absence — everybody stepping out of the way — cost nobody anything. Nobody is committed. Those reverse violently, because the moment liquidity comes back, price snaps to where the business actually is.
This is why you see long, ugly wicks in the middle of the night or during a news release. And it is not "manipulation" in the way comment sections mean it. It is much more boring than that: market makers pull their quotes when they do not know what is about to happen, the book goes paper-thin, one ordinary-sized order walks through fifty nearly-empty levels, price gaps hundreds of dollars on almost no volume, and then everybody comes back and price returns.
That gives you a rule you can use today, before you know anything else about order flow:
A move on high volume means somebody paid to make it happen. A move on low volume means nobody was home.
The first deserves respect. The second usually gets given back.
So who actually sets the price?
Now we can answer it directly.
Aggressive orders decide WHERE price goes. Passive orders decide WHERE it stops.
The aggressive side decides direction. Every uptick is an impatient buyer; every downtick is an impatient seller. Direction is created entirely by aggression.
The passive side decides how far. Resting orders are the terrain. A thick book is a wall — price has to spend real money to get through it. A thin book is open road.
So every move is two things at once: how much aggression arrived, and what terrain it arrived into.
| Thin book | Thick book | |
|---|---|---|
| Small aggression | Drift, spikes, ugly wicks | Nothing happens |
| Large aggression | Violent move, high slippage | Absorption — volume with no movement |
That bottom-right cell is where most of the money in this course lives.
What a level actually is
Notice what this means for the lines on your chart.
A level is not a line. It is a place where the terrain changes.
When people draw support and resistance, what are they actually drawing? They are marking a place where, historically, resting orders showed up and stopped price. That is all a level is. It is not magic and it is not geometry — it is a memory of where liquidity was.
Which immediately tells you why levels fail: the orders that made that level are not necessarily there any more. The line on your chart is a record of the past. The only way to know whether anybody is defending it today is to look at the order flow when price gets there.
Levels ask the question. Order flow gives the answer.
That sentence is the entire strategy of this course, and we build it properly in lesson 6.
Why a whale cannot hide from volume
Large participants — institutions, funds, market makers, genuinely large individuals — obviously do not want you to know what they are doing. If a fund needs to buy a very large amount, the last thing they want is the market seeing it coming, because price runs away from them before they are filled.
So they hide, and they are good at it. Here is exactly what they can and cannot hide.
| Can hide | Cannot hide |
|---|---|
| Their identity | That a trade happened |
| Their intention | The volume |
| Their size in the book | The price it happened at |
| Their timing | Which side was aggressive |
What they can hide. Their identity — the tape carries no names. Their size in the book, using an iceberg order that displays only a small piece of itself and automatically refills every time the visible part is eaten: you see ten units, behind it sit two thousand. Their intention, by slicing one enormous order into hundreds of small pieces spread over hours using execution algorithms designed to look like ordinary background activity. They can even actively mislead you, placing large visible orders they never intend to fill so you believe there is a wall, then cancelling them.
What they cannot hide:
To buy, you have to trade. And every trade gets printed.
If you want to own a large position, at some point somebody has to sell it to you. There is no other way to acquire it. And the moment that transaction happens it is recorded — price, size, timestamp, aggressor side — and broadcast to everybody, including you. They can disguise how it looks. They cannot make it not happen. Larry Harris makes the same point at length in Trading and Exchanges, which remains the best single reference on market microstructure.
And here is the elegant part — look what happens to each hiding technique once you have the trade data:
| The technique | What exposes it |
|---|---|
| Iceberg in the book | Every refill prints as a trade. You watch 2,000 units trade at one price while the displayed size never disappears. The book lied; the trades told the truth |
| Sliced orders | The slices add up at the price level. However many pieces you cut an order into, the volume still lands where it executed — one price level with far more volume than everything around it |
| Spoofed wall | It never prints at all. A real wall gets eaten and produces enormous trade volume. A fake one vanishes with no trades. On a volume-based tool the fake is invisible — and that absence is the tell |
| Quiet accumulation | Huge volume, price not moving. That is absorption, and it is the loudest signal in order flow |
Volume tells you everything. Volume reveals every whale.
You cannot see who they are, and you do not need to. You can see where they had to transact — which is strictly more useful, because it tells you the prices they care about. And those are the prices they will defend.
On a footprint chart that is exactly what you are hunting for: not a name, but a price where far more business happened than anywhere around it. Somebody wanted that price badly enough to do real size there. That is a footprint in the literal sense — the mark left behind by something big that walked past.
Time candles vs range candles
Every candle you have ever looked at is a time candle: one minute, five minutes, one hour, one day. Each covers a fixed slice of the clock and closes when the clock says so, regardless of what the market did.
A range candle ignores the clock entirely. It closes when price has travelled a set distance. Time is irrelevant; movement is everything.
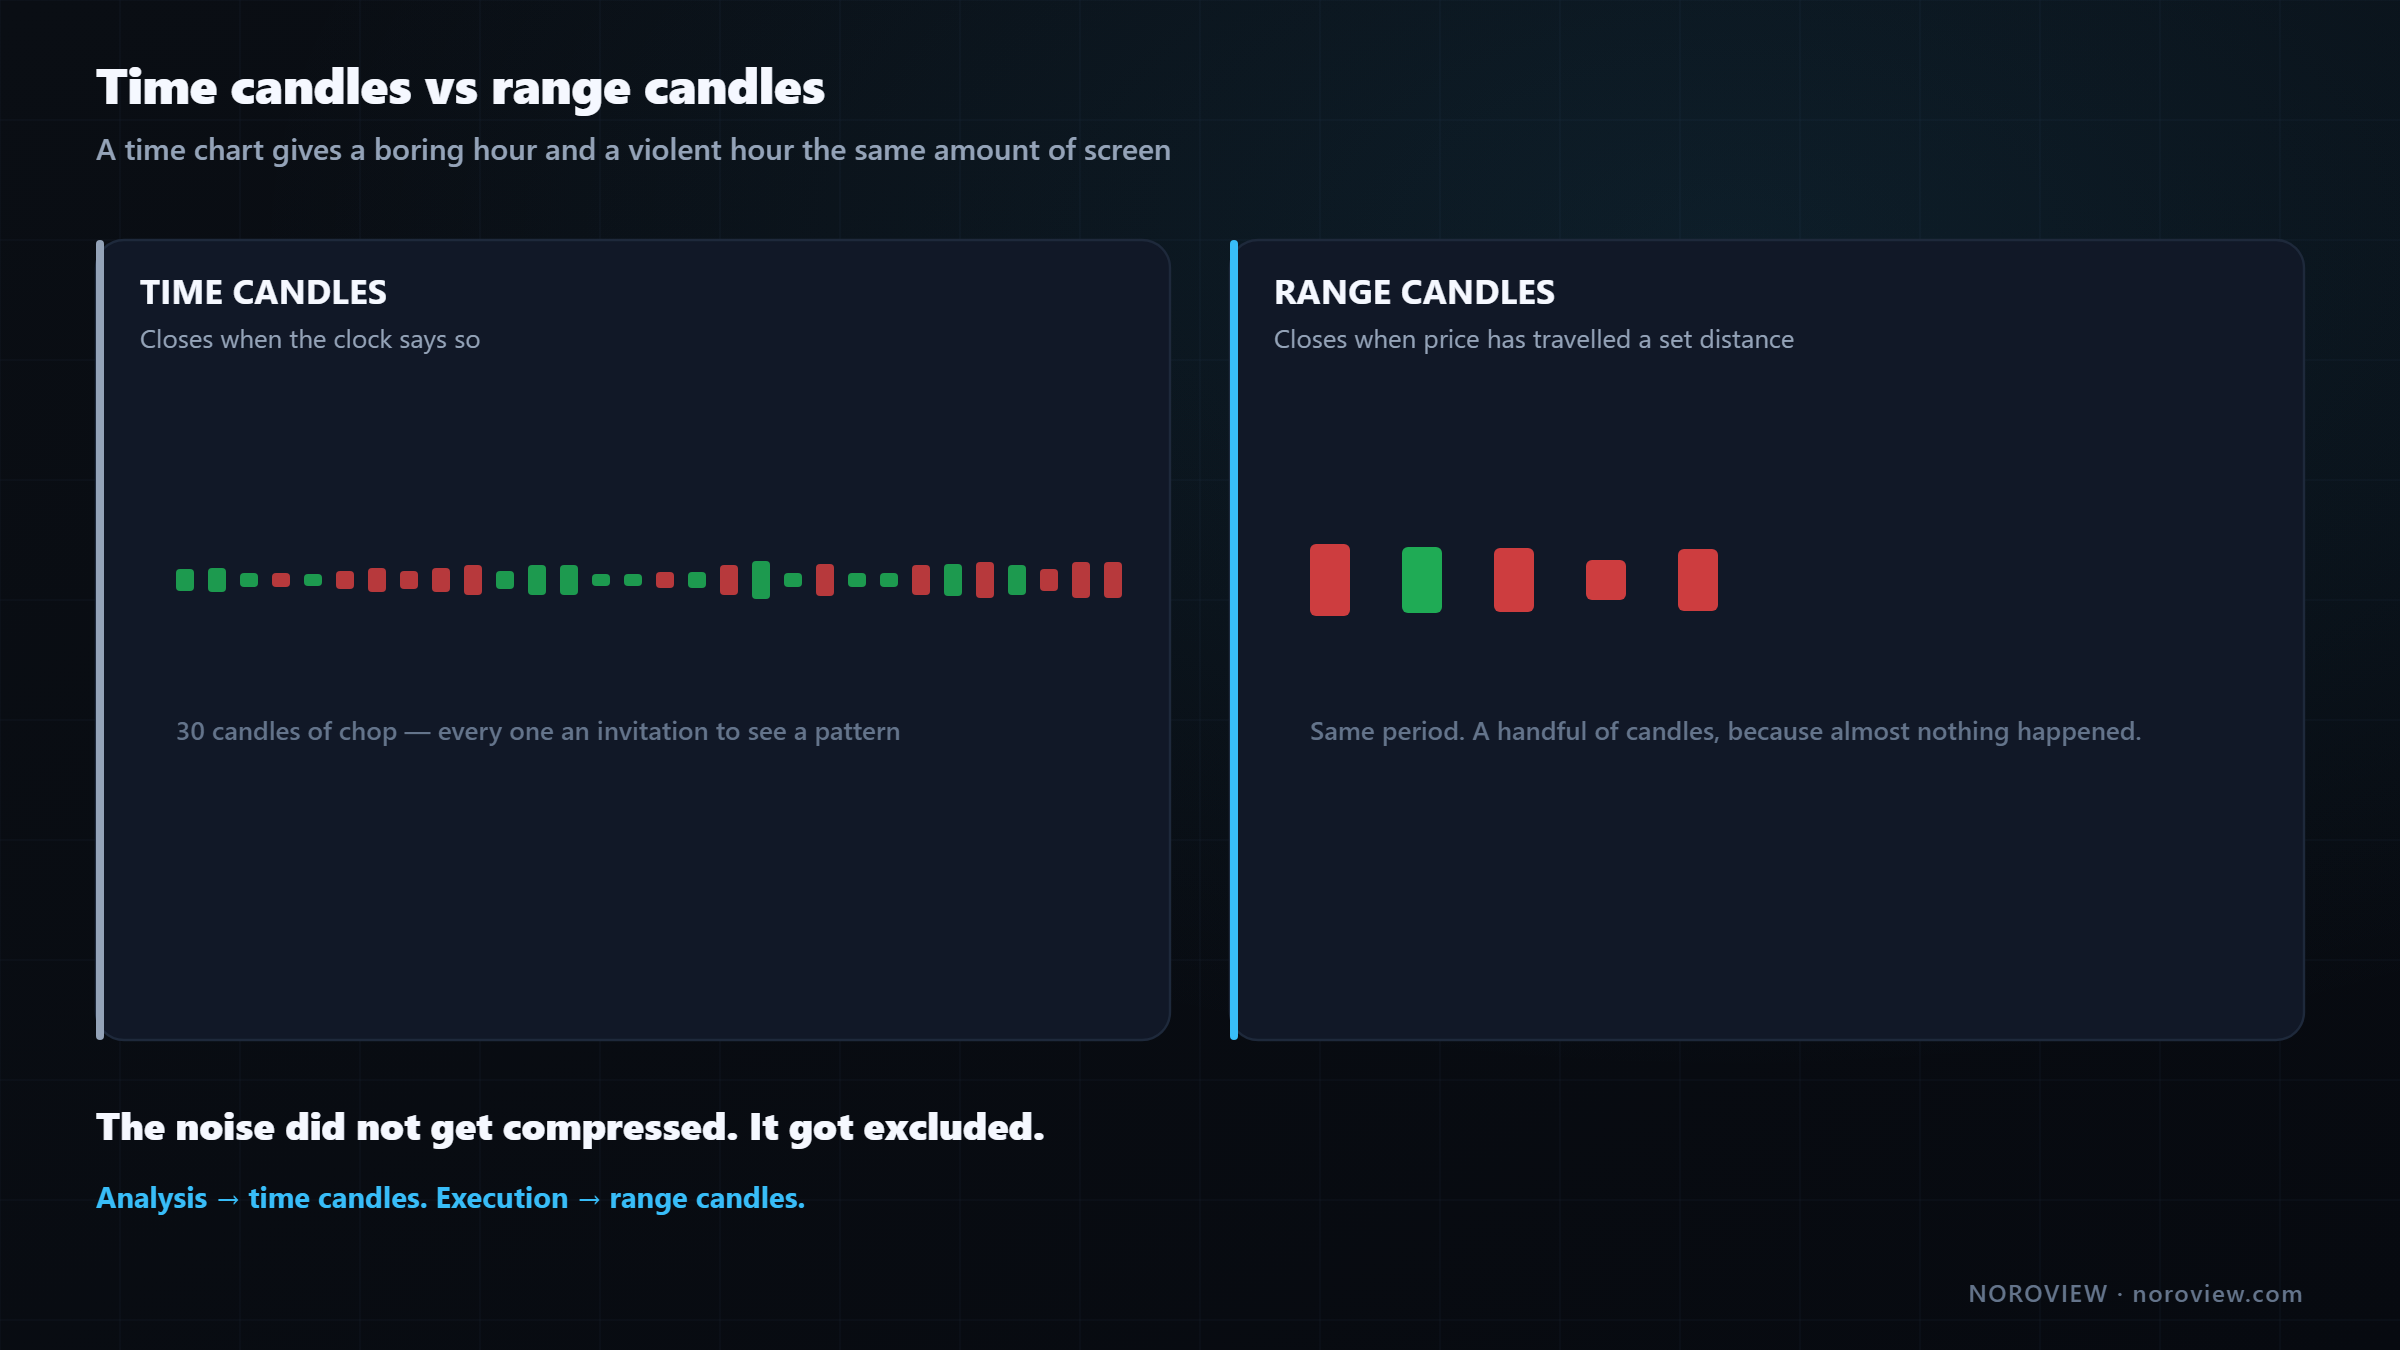
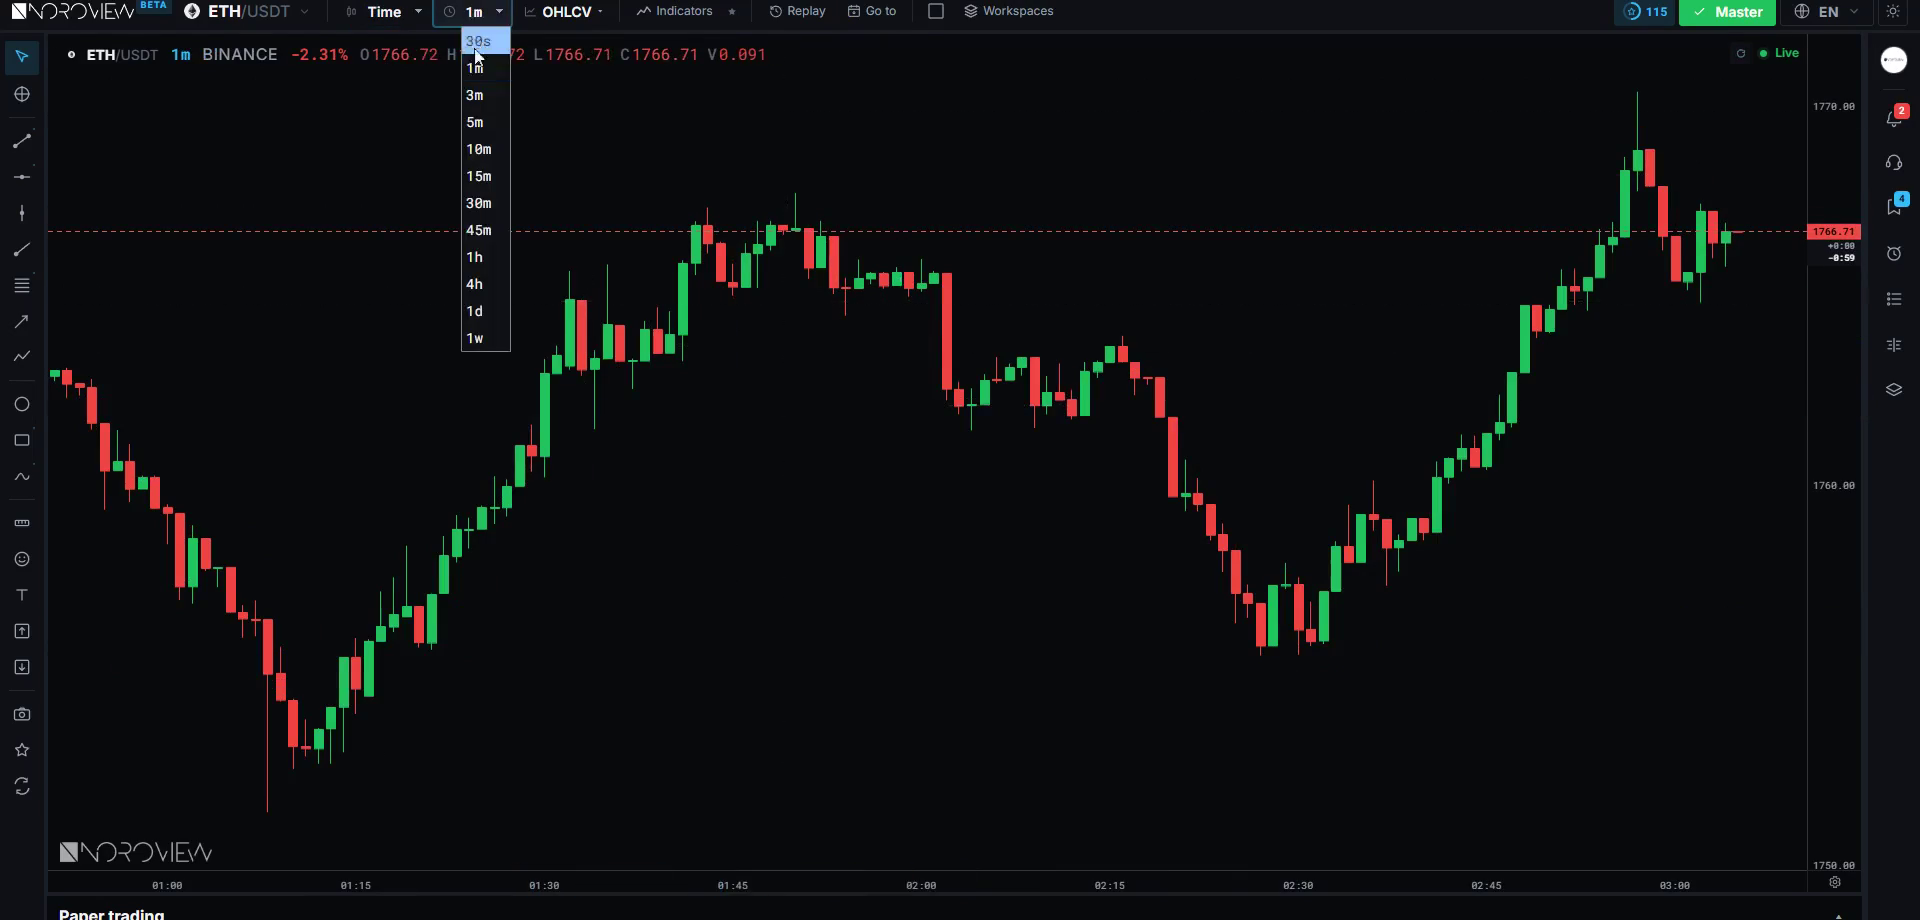
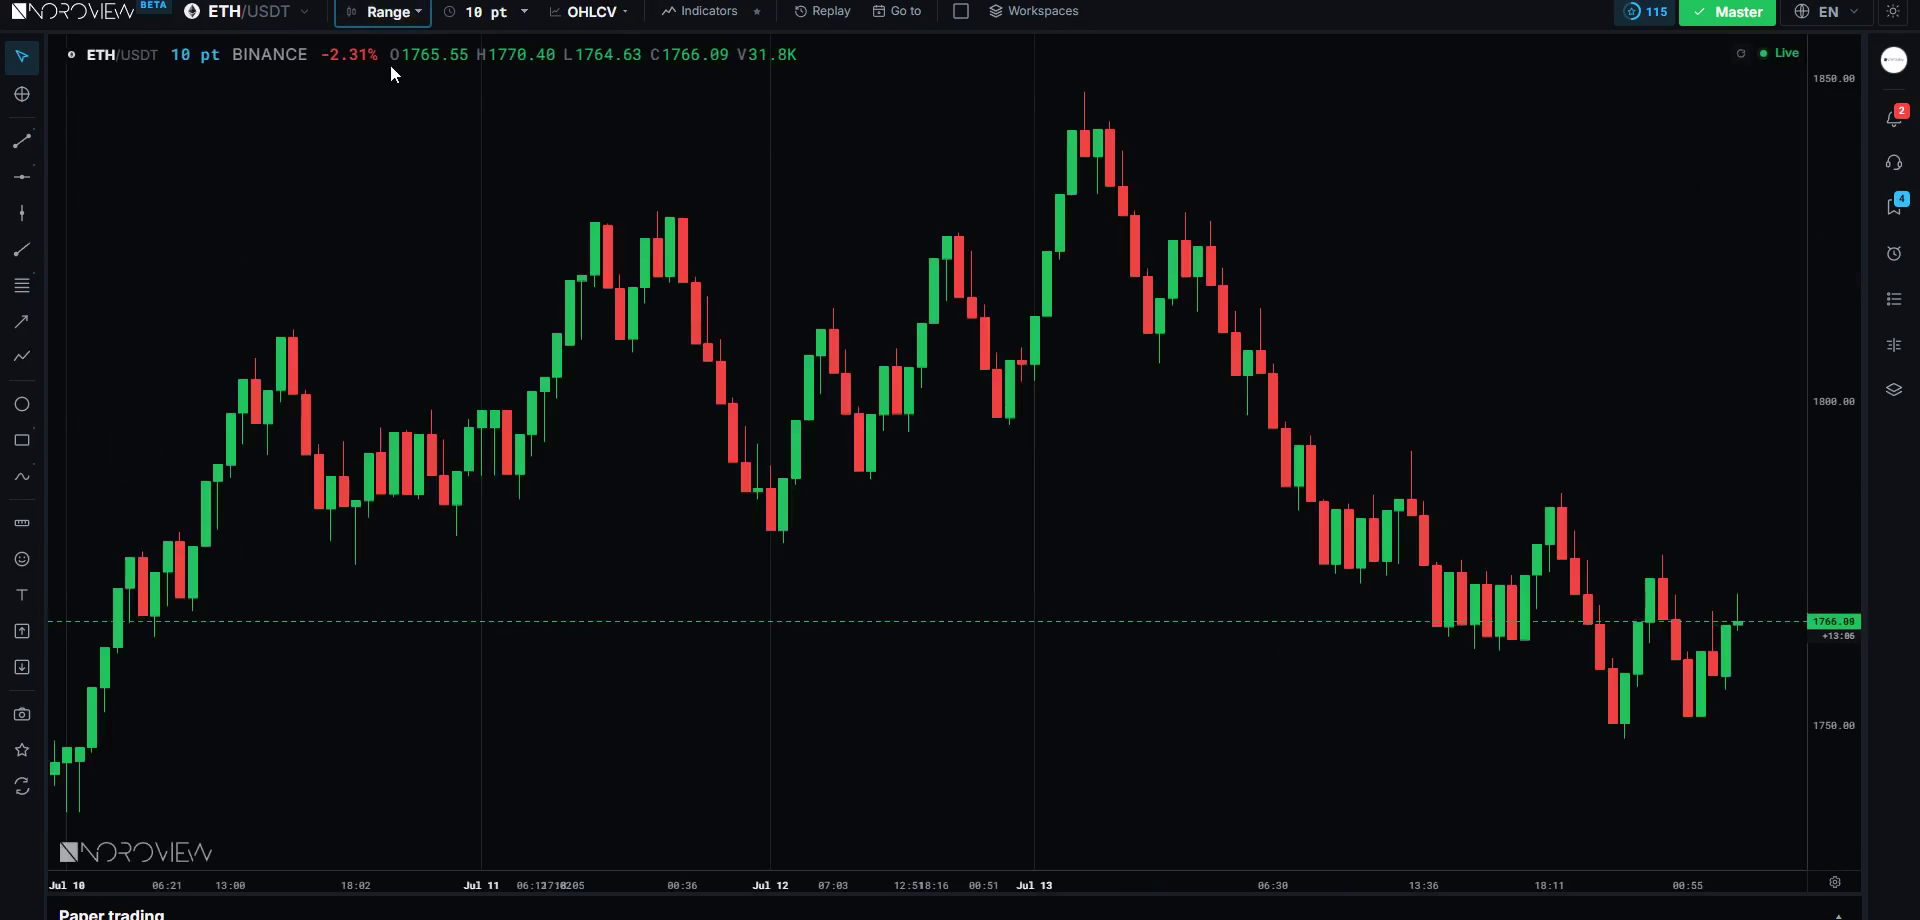
In NOROVIEW the top-bar Candles control switches between the two families. Time candles run from 30 seconds to one week. Range candles are measured in points, and a point is scaled per symbol — so a 10-point candle means a comparable amount of movement whichever market you are on. You are not re-learning the setting every time you change coin.
What this actually does to your chart
In a quiet market almost no range candles form, because price is not going anywhere and a candle only closes when price travels. In a fast burst you suddenly get a stream of candles, one after another.
Range candles spend chart space where the market spends effort.
That is the whole point. A time chart gives a boring hour and a violent hour exactly the same amount of screen space. That is an accident of the clock; it does not reflect anything real. A range chart gives space to movement, which is where the information is.
Put them side by side over the same quiet stretch and the difference is stark. On the time chart it is thirty candles of noise — thirty indecisive bodies with wicks everywhere, every one of them an invitation to imagine a pattern that is not there. On the range chart it is a handful of candles, because almost nothing happened. The noise did not get compressed. It got excluded.
Why order-flow traders love range candles
Footprint reads best on range candles.
Because every range candle contains a similar amount of price travel, every footprint candle contains a comparable amount of business. On a one-minute chart, one candle might contain forty trades and the next four thousand — you cannot compare their footprints meaningfully. On range candles you are comparing like with like, and things like exhaustion and absorption become much easier to see.
One more detail: range candles reset at midnight UTC, so every trading day starts clean instead of inheriting half a candle from yesterday. Another reason to keep the whole course on UTC.
My rule
Analysis → time candles (H1, H4, daily — structure, levels, sessions) Execution → range candles (footprint, entries, absorption, exhaustion)
Anything anchored to the clock has to be on a time chart: daily and weekly structure, trend, session behaviour, the previous day's levels, session-anchored VWAP, news. Time is genuinely part of that information, and all my trend and level work happens on the hourly and the daily.
When I have my level and I am waiting for the market to come and show me what it wants to do, I want the noise gone and the footprint comparable. That is a range chart.
Two honest warnings, because nothing is free. First, range candles have no time axis you can trust — a range candle can take two seconds or forty minutes, so if you need to know how long something has been going on, you have to look elsewhere. Second, do not go too small: a tiny range setting gives you a machine gun of candles and the illusion of enormous activity in a market that is asleep. Start around ten points, sit with it for a week, then adjust based on whether you are drowning or starving.
Common mistakes
- Believing "more buyers than sellers." The counts are always equal. Only aggression differs.
- Treating a big candle as a big event without checking volume. Big move on low volume is an empty book, not a real event.
- Using market orders in violent conditions and then being surprised by the fill. That is slippage, and it is a function of the book you traded into.
- Reading a level as a line rather than a zone where the terrain changes.
- Assuming a visible wall is real. If it never prints, it was theatre.
- Trading range candles for structure. They have no reliable time axis.
- Setting the range interval too small and mistaking candle count for activity.
Your homework
Forty minutes. The third one is the important one.
- Watch the order book and the tape together for fifteen minutes. Every time you see a green print, understand that a buyer just crossed the spread. Say it out loud if it helps — you are training a reflex.
- Find one big move on low volume and one on high volume. Scroll back through the last few days, mark both, and look at what happened after each one. You will start seeing the difference before you can articulate it.
- Put a range chart next to a time chart on the same market and just look. Top bar → Layout → Two columns. Left pane Time/1m, right pane Range/10pt. Watch a quiet hour and a busy hour on both.
Open the terminal and set up the split view →
Three things to remember
- A market is an auction looking for the price where business happens. Price falls until buyers appear and rises until sellers appear.
- Every trade has one buyer and one seller. What matters is which side was aggressive — the one who crossed the spread and paid for immediacy.
- Price moves on aggression or on absence. The first got paid for; the second gets given back. And volume reveals every whale, because to buy you have to trade, and every trade prints.
← Previous: Level 1 vs Level 2 Market Data · Course index: Order Flow Trading Course · Next → How to Read Footprint Charts
Frequently asked questions
Why does price go up if every trade has a buyer and a seller? Because the counts are never the issue — aggression is. Every trade pairs one aggressive participant who crossed the spread with one passive participant who was waiting. Price rises when aggressive buyers consume the resting sell orders above, so the most recent trade prints at a higher price.
What does "lifting the offer" mean? It means an aggressive buyer reached up and took the price a seller was resting at, rather than waiting to be filled. The trade prints as a buy. Its opposite is "hitting the bid," where an aggressive seller takes the price a buyer was resting at, and the trade prints as a sell.
What is the difference between a market order and a limit order? A market order executes immediately at whatever prices are available, so you control the fill but not the price. A limit order joins the queue at a price you choose, so you control the price but have no guarantee of being filled. Market orders take liquidity; limit orders provide it.
What is slippage? Slippage is the gap between the price you saw and the average price you actually received. It happens when your order is larger than the size resting at the best price, so it walks up or down through several levels. It grows sharply in thin books and during fast moves.
Why do prices spike on low volume? Because price can move on absence as well as aggression. When market makers pull their resting orders — around news, or overnight — the book goes thin and an ordinary-sized order travels through many nearly-empty levels. Almost nothing traded, so nobody is committed, and price usually returns.
What are range bars in trading? Range bars close when price has travelled a fixed distance rather than when a fixed time has elapsed. In quiet conditions very few form; in fast conditions many form. They exclude low-volatility noise and make footprint candles comparable, because each contains a similar amount of price travel.
Should I use time or range candles for order flow? Use time candles for analysis — structure, trend, sessions, and anything anchored to the clock — and range candles for execution, where you want comparable footprints and the noise removed. Many order-flow traders run both side by side in a two-pane layout.
Sources
- CME Group Education — auction market theory and market profile
- Investopedia — slippage
- Harris, L. (2003). Trading and Exchanges: Market Microstructure for Practitioners — Oxford University Press
Soroosh Moghimi — six years inside financial markets: algorithmic trading, HFT, crypto and AI, after a decade building startups. He publishes this course free because he already paid for the lessons in it. There is no paid course and no signal group. @sorooshmoghimi · About
Start reading real order flow
You cannot learn this from a candlestick chart, and you do not need to spend a cent to begin. The standard footprint chart is free for every NOROVIEW user, market replay is free, and the paper-trading simulator is free.
Open NOROVIEW free → · Compare plans →
⚠️ DISCLAIMER — EDUCATIONAL CONTENT ONLY
This article is for educational and informational purposes only. It is not financial, investment, or trading advice, and nothing in it is a recommendation to buy, sell, or hold any asset. Trading cryptocurrencies and leveraged derivatives is high risk and can result in the loss of some or all of your capital. Only risk money you can afford to lose. Any levels, indicators, signals or results shown are illustrative and are not a promise or prediction of future performance. Charts may be shown on a demo or paper-trading account and do not represent real trades or returns. Always do your own research. You alone are responsible for your decisions.
Keep reading
Related posts

16. Trade Management: Break-Even, Partials and Trailing Stops
Trade management explained: when break-even stops cost you money, partial exits, four kinds of trailing stop, the order-flow exit, and diagnosing yourself with MFE and MAE.
15. How to Day Trade Crypto With Order Flow (Starting Small)
How to day trade crypto with order flow: exchange security, spot vs perpetuals, leverage and liquidation, order types, fees, and an honest $100 starting plan.

14. Risk, Drawdown and the Mind: Day Trading's Real Edge
Day trading risk management and psychology: position sizing math, drawdown recovery arithmetic, hard limits, decision vs outcome, and the five states that break traders.

13. Fair Value Gaps, Confirmed With Order Flow
Most fair value gaps do nothing. Five order-flow checks that tell you in advance which FVGs are worth trading and which are decoration.

5. Market Structure and Trend: How to Pick Your Side Objectively
How to identify market structure objectively: higher highs and higher lows, swing point rules, impulse vs correction, and the arithmetic behind trading with the trend.
11. My Order Flow Entry Model, Step by Step
A complete order flow entry model: the four conditions, the exact trigger candle, the value-area filter, and the ten-item blocker list that vetoes a trade.
Discussion (0)
Want to join the discussion? Comments live inside the platform.
Open NOROVIEW