
1. Order Flow Trading for Beginners: What to Know Before Your First Trade
Order flow trading for beginners: what order flow actually is, how long it really takes to get profitable, realistic returns, and the 16-lesson roadmap.
1. Order Flow Trading for Beginners: What to Know Before Your First Trade
⚠️ Education only. Nothing in this article is financial advice. Trading is high risk and you can lose your money. Full disclaimer at the bottom.
Order flow trading for beginners comes down to one shift in what you look at. Every indicator you have ever used — RSI, moving averages, MACD — is calculated from price, which makes it permanently behind price. Order flow is the actual stream of buying and selling that creates price. Learning to read it takes six months to two years, it will not give you a 90% win rate, and it is the closest thing retail traders have to seeing what the market is actually doing.
This is lesson 1 of a free 16-lesson course. Everything in it runs on a free account — open NOROVIEW in another tab and follow along on a live chart rather than just reading.
What you'll learn in this lesson
- What order flow actually is, and why it is structurally different from every indicator
- The full 16-lesson roadmap, and why the order of the lessons matters more than the content
- How long it realistically takes to become profitable — and the three mechanics that set that clock
- What a realistic monthly return looks like, and why the number on social media is a different activity entirely
- Which markets this works on, and the one condition a market has to meet
- The single rule for the rest of this course
Lesson 1 of 16 · Part 1 — Analysis. This article is the front door to the free order flow trading course. Next: Level 1 vs Level 2 Market Data.
▶ Prefer to watch it?
Order Flow Explained in 10 Minutes — What Every Candlestick Hides covers this ground on a live chart. In a hurry: What is order flow? (in 45 seconds) · Everything else: the NOROVIEW channel
The words you need before we start
| Term | What it means |
|---|---|
| Order flow | The live stream of executed buying and selling — who bought, who sold, at what price, in what size, and how aggressively |
| Aggressor | The side that initiated the trade: a buyer lifting the offer or a seller hitting the bid |
| Bid / Ask | The best price someone is willing to buy at / sell at, right now |
| Delta | Buy volume minus sell volume. Positive delta means aggressive buyers dominated |
| Footprint chart | A candle that shows the volume traded at every price level inside it, split into buying and selling |
| Level 2 data | The full order book — every resting bid and offer behind the best price, not just the top of it |
Each of these gets a full article later. You do not need to memorise them now.
What order flow actually is
Order flow is the record of every transaction that happened in a market: which side was aggressive, at what price, and in what size. It is not a calculation applied to price. It is the raw material that price is made from. That single distinction is why order flow behaves differently from every indicator on your chart.
Here is the part most trading education skips.
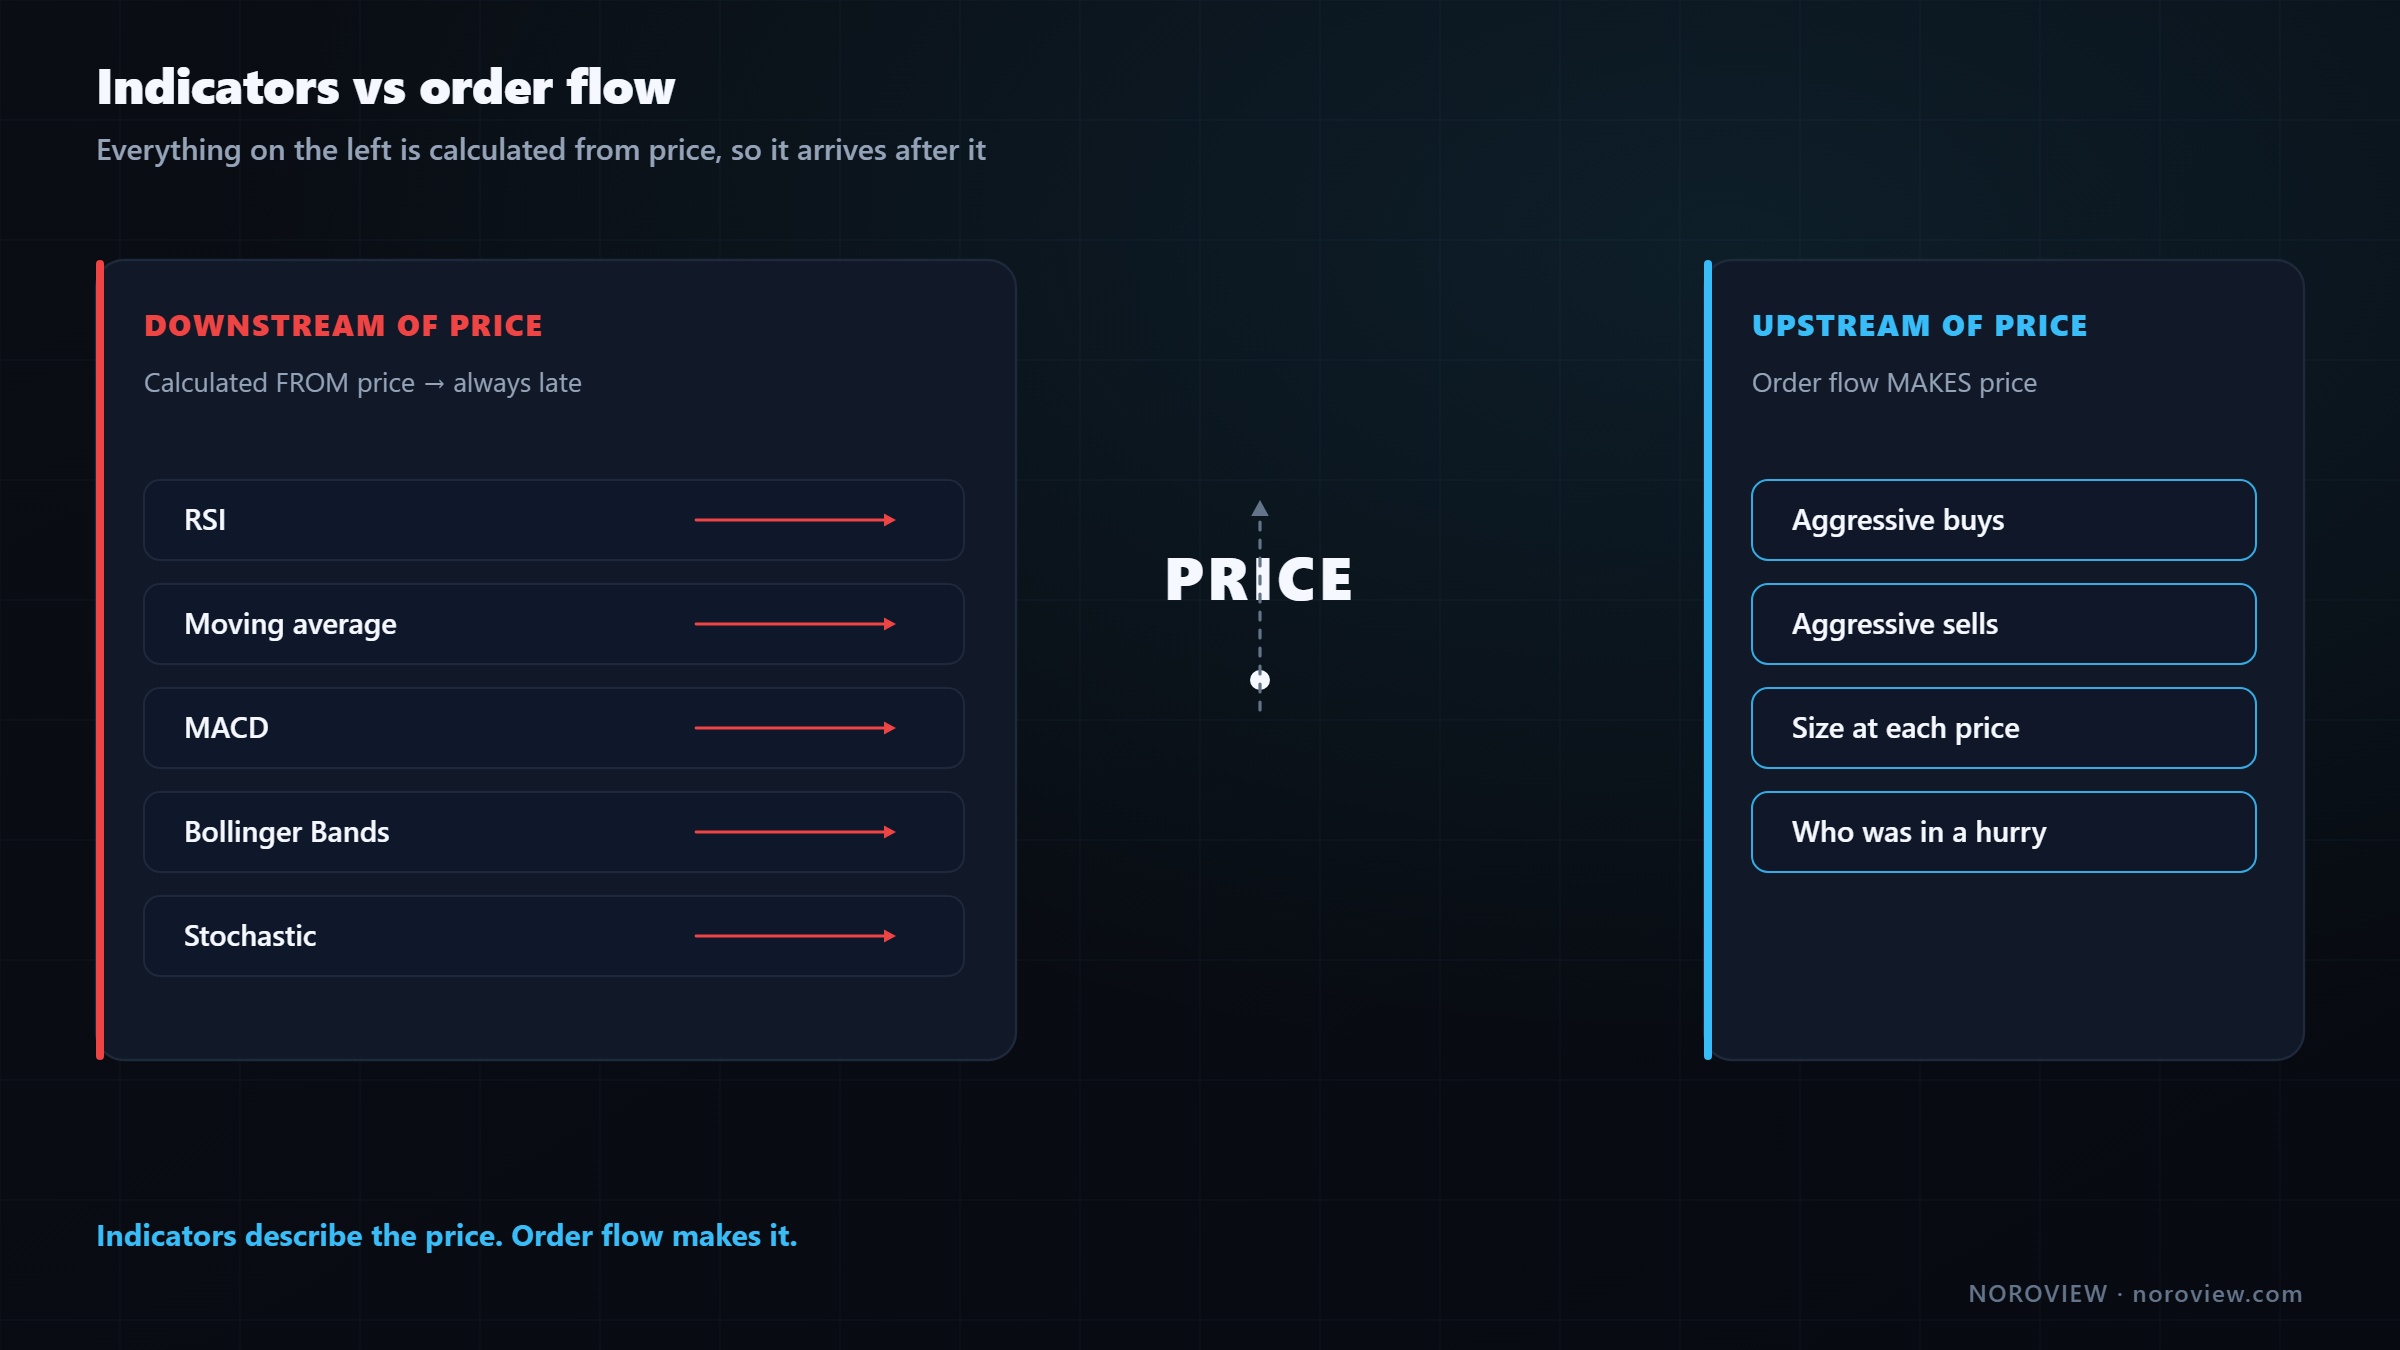
Every indicator is calculated from price. RSI is a formula that takes past closes and returns a number between 0 and 100. A moving average is literally the average of past prices. MACD is the difference between two of those averages. Bollinger Bands are a moving average plus a standard deviation of past prices. There is no exception. They are all built on top of price, which means they are all — mathematically, permanently — behind it.
That is not a flaw in one badly-designed indicator. That is what the entire category is.
So where does price come from?
Price is not a number a computer decides. Price is the residue of thousands of individual transactions. Somebody wanted to buy badly enough that they paid the seller's asking price. Somebody wanted to sell badly enough that they accepted the buyer's bid. Every tick on your chart is a transaction between two parties — two humans, two algorithms, or one of each — holding exactly opposite opinions.
That stream of transactions is order flow. And because it creates price rather than being derived from it, reading it puts you one step closer to the actual mechanics of the market than everyone watching a moving average cross.
This is the through-line of the entire course, and I am going to repeat it in almost every lesson:
Indicators describe the price. Order flow makes it.
What order flow is not
This is exactly the point where trading educators start lying, so let me be blunt.
Order flow is not a crystal ball. It does not tell you the future. It will not give you a 90% win rate. It does not remove uncertainty, and anyone telling you otherwise is selling something.
What order flow gives you is evidence.
Here is the practical difference. Price arrives at a level you care about. On a normal candlestick chart you see a candle form, and you have to guess whether that level is holding. With order flow, you can see whether real size actually stepped in there, whether aggressive sellers hit it and got absorbed, or whether literally nothing happened and the level is about to fail.
It converts a guess into a decision made on data. That sounds like a small upgrade. It is not.
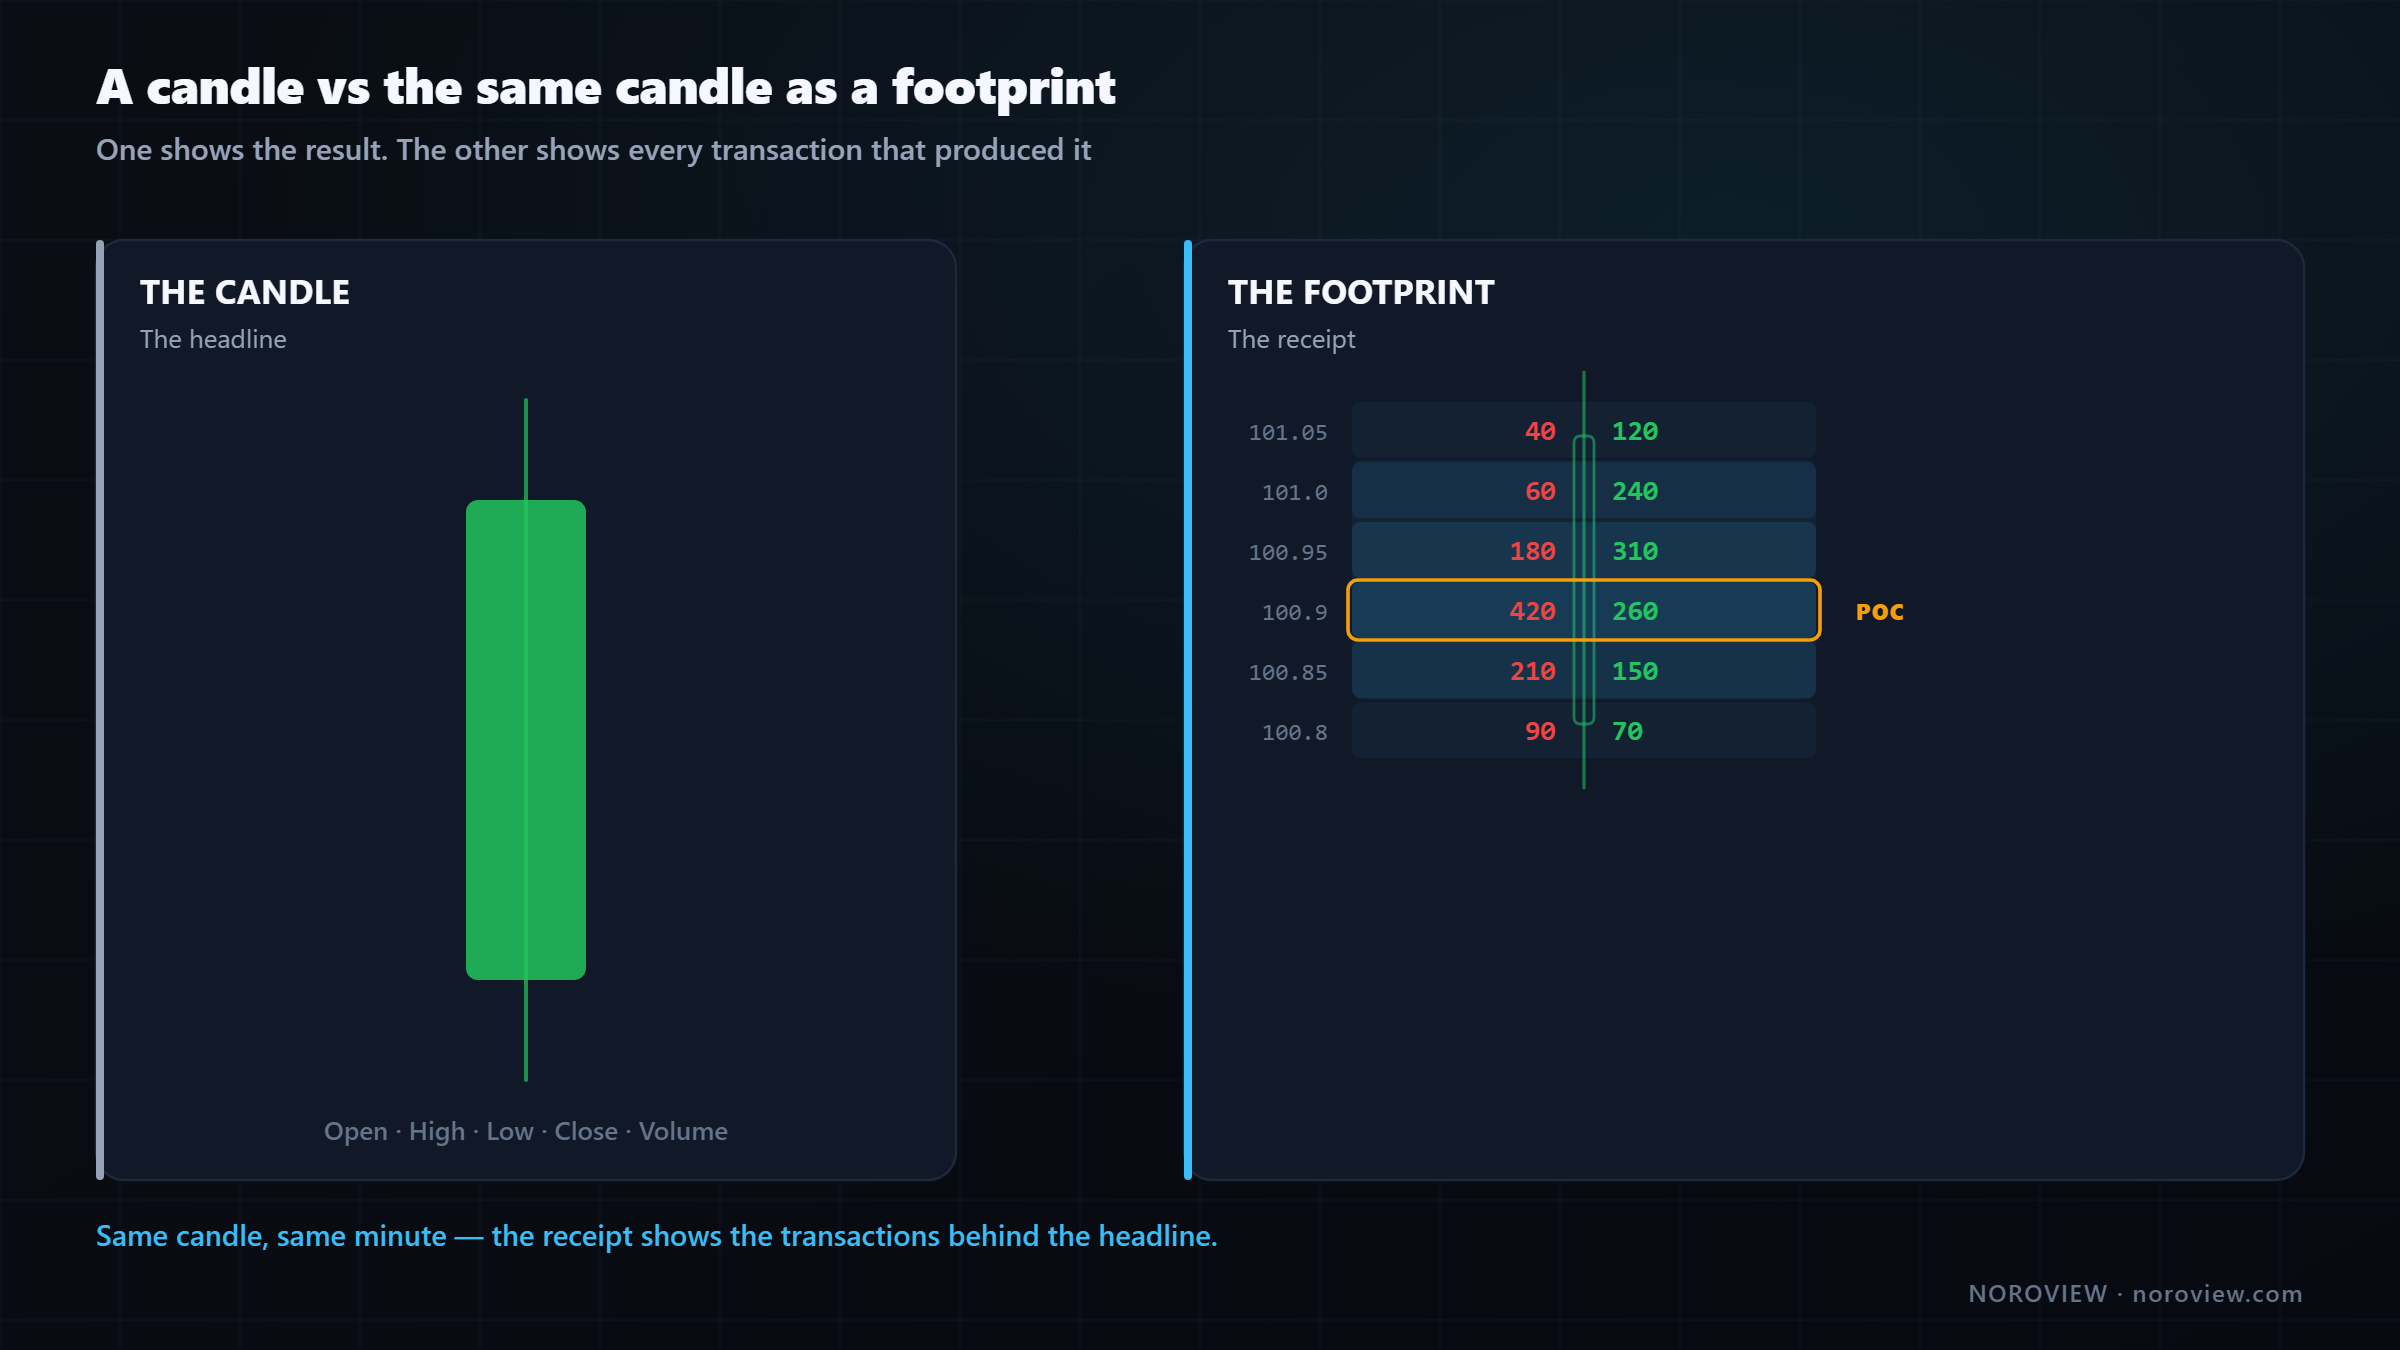
A candle is the headline. A footprint is the receipt.
Take one candle on a 5-minute chart. On a standard chart it is a green rectangle. That is the entire information content: it opened here, closed there, and touched these two extremes.
Now look at the same candle as a footprint. Inside it you can see every price it traded at, and at each of those prices, exactly how much was bought and exactly how much was sold.
Here is what that actually looks like in a live terminal — not an illustration:
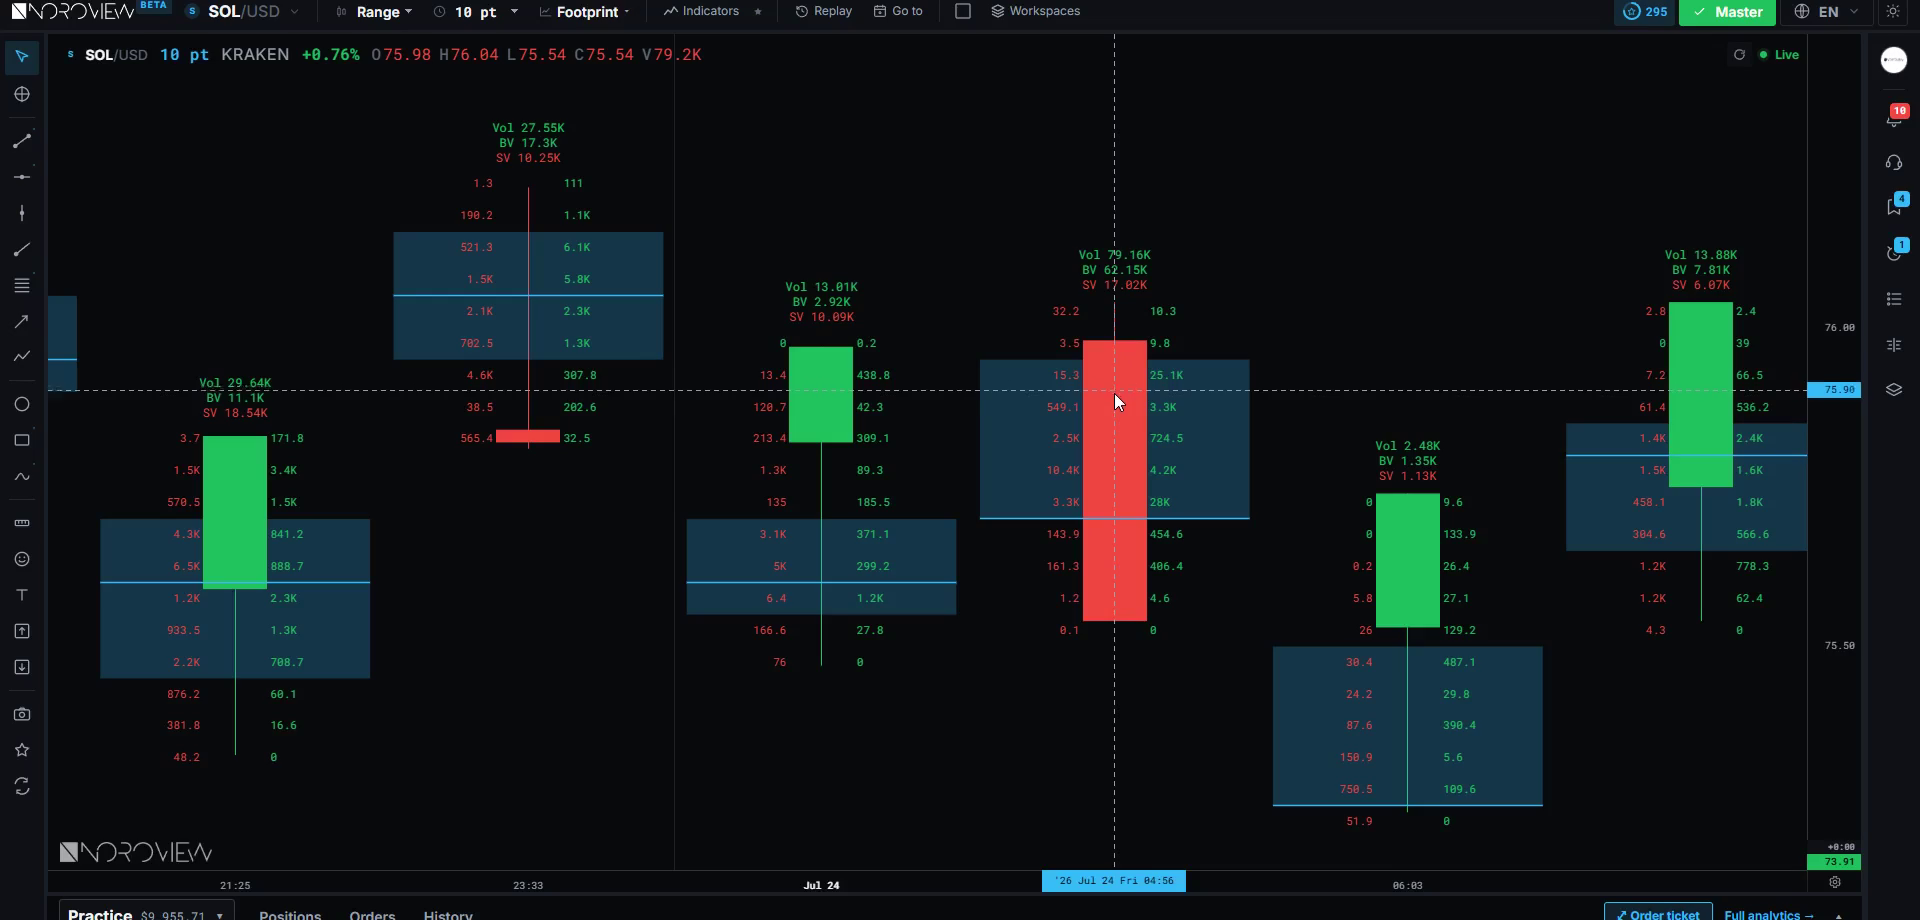
The candle tells you the result. The footprint tells you the transaction. One is a headline; the other is the receipt. A large part of this course is learning to read that receipt — which is exactly what lesson 4 on footprint charts is for.
▶ Try this now
Open a chart, set the symbol to BTC/USD, and switch the chart type from OHLCV to Footprint. It will look like nothing changed — that is expected. Footprint cells are not visible at default zoom, and double-clicking will not reveal them. You have to zoom in on both axes: scroll to zoom, then drag the time axis to the right to spread the candles apart until the numbers inside them are legible. The standard footprint chart is free for every user. Launch NOROVIEW free →
The full course map, and why the order matters
Sixteen lessons, three parts. The sequence is deliberate and it matters more than any individual lesson.
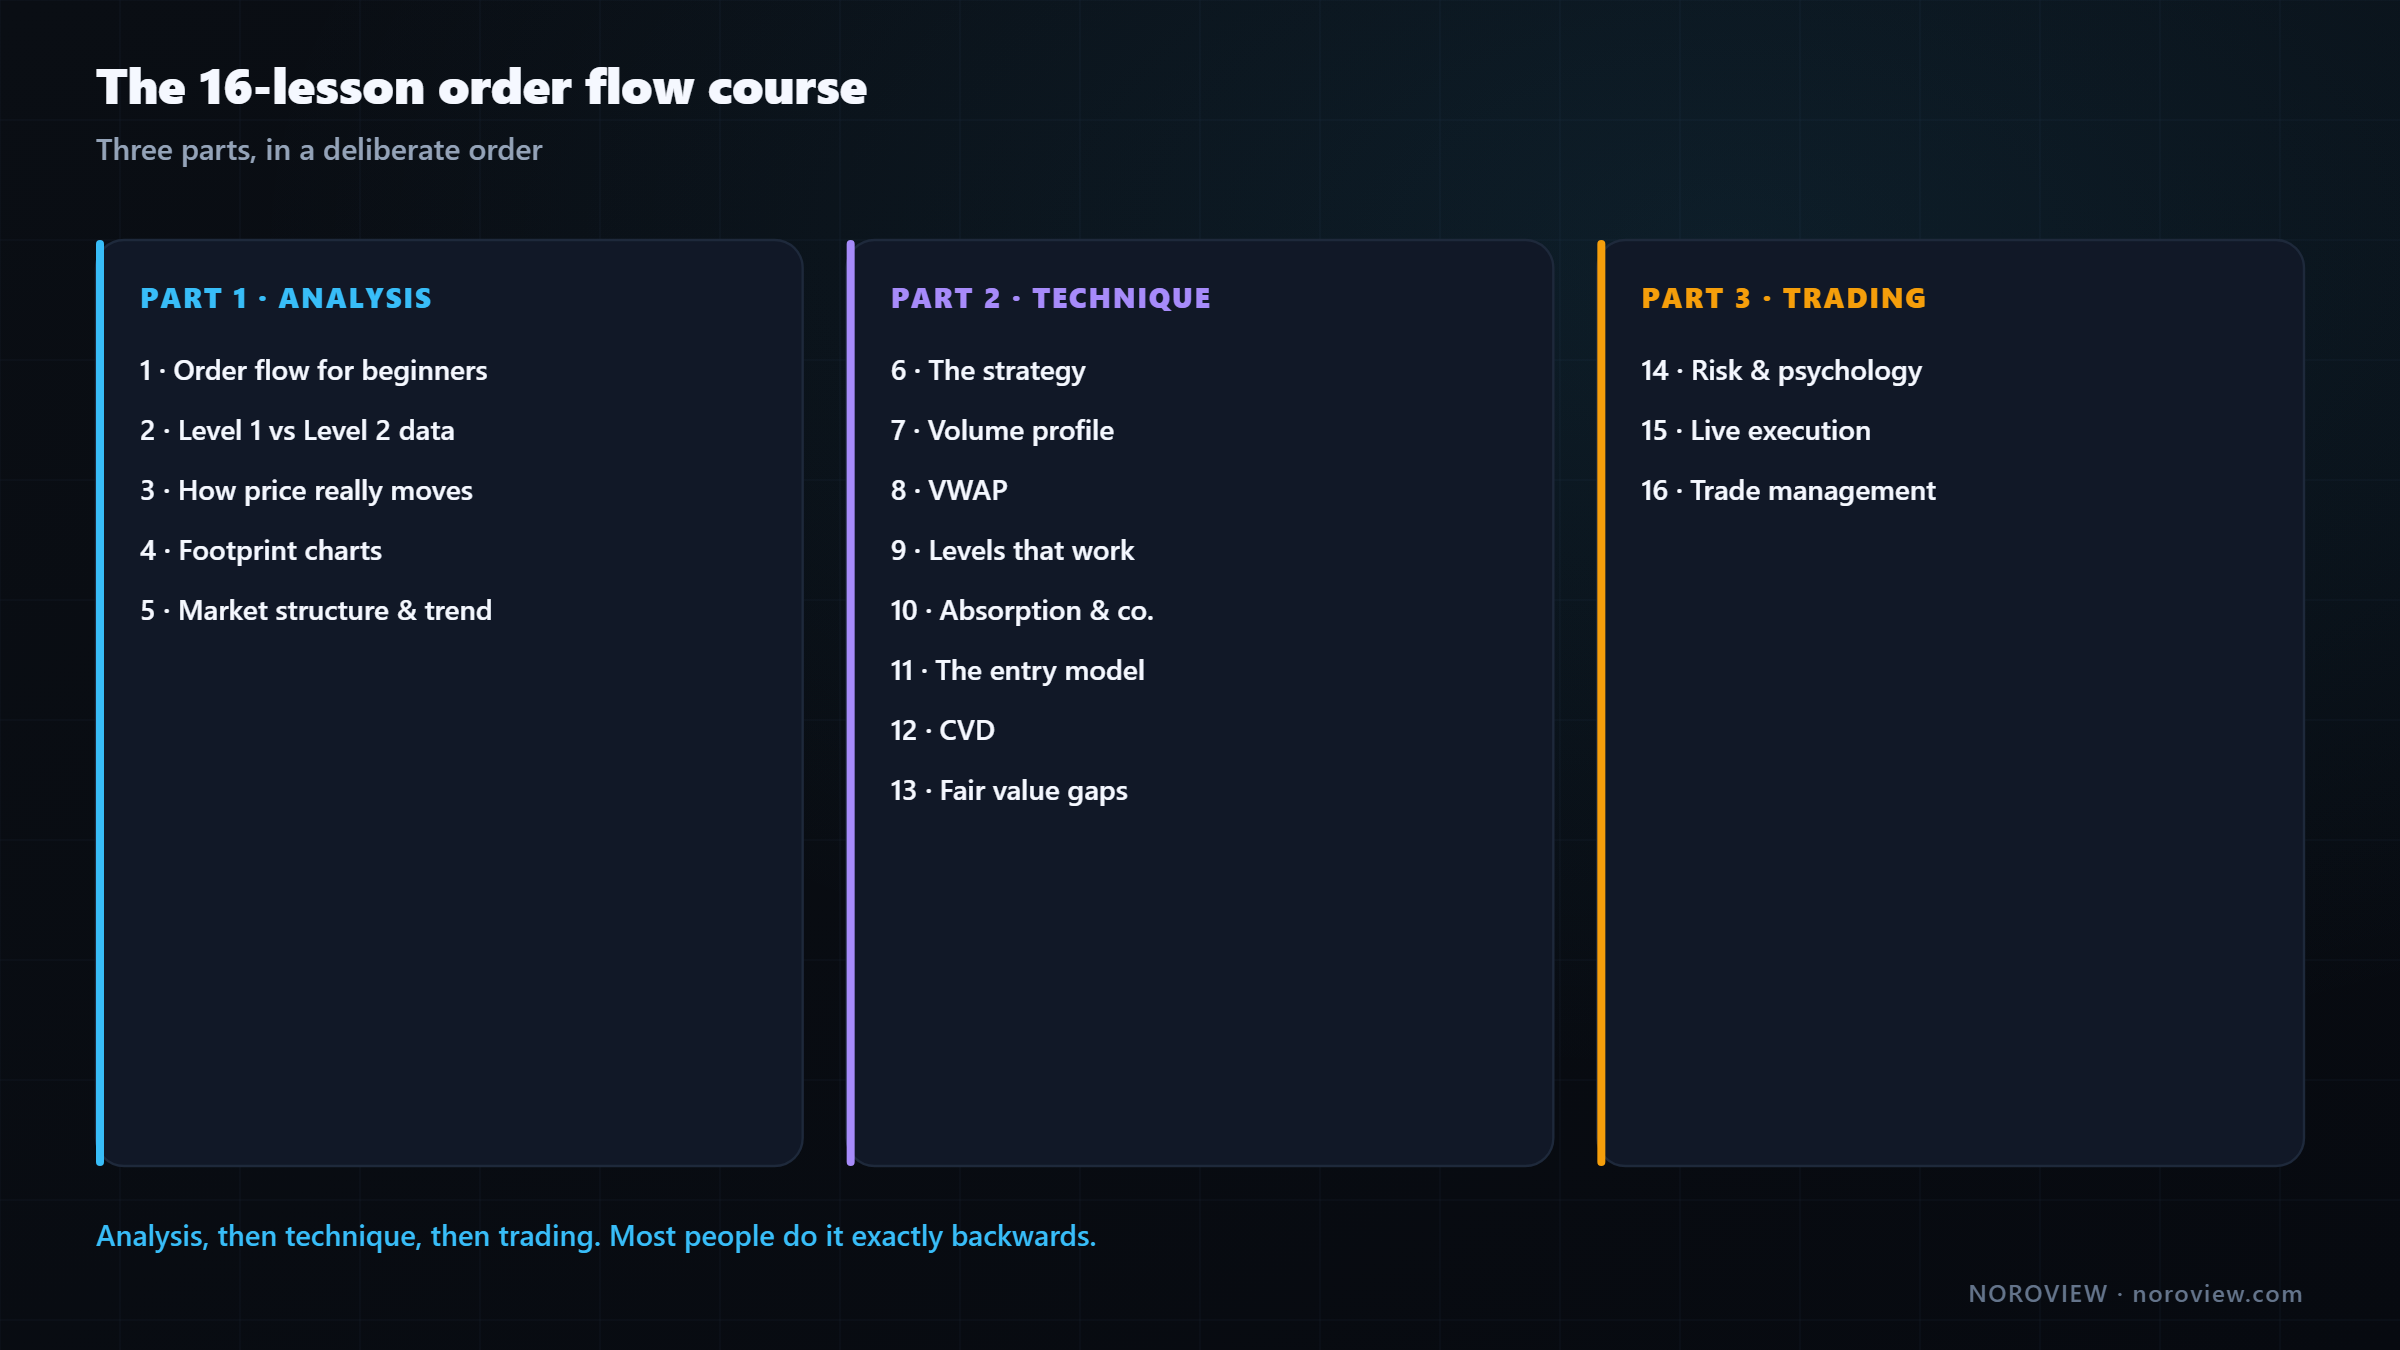
Part 1 — Analysis (lessons 1–5)
Before you can trade a market, you have to be able to look at it and describe what is happening in it, honestly.
- Lesson 2 — Level 1 vs Level 2 data. There are two kinds of market data, and most retail traders have only ever seen one of them. Why Bitcoin has a different price on every exchange, and whether you can analyse on one venue and execute on another.
- Lesson 3 — How price really moves. Aggressive and passive orders, the bid, the ask, the order book, and how a price physically gets made tick by tick. This is the lesson that fixes your mental model. If your model of the market is wrong, every technique built on top of it is wrong too.
- Lesson 4 — Footprint charts, complete. Delta, buy and sell volume, trade counts, average trade size, absorption, divergence. The longest lesson in the course and probably the most valuable.
- Lesson 5 — Market structure and trend. How to define a trend objectively instead of feeling it, and whether to trade with it or against it.
Part 2 — Technique (lessons 6–13)
This is the actual method.
- Lesson 6 — The strategy: find the levels that matter, then use order flow to decide whether to take the trade there. Every lesson after this is a detailed version of one half of that sentence.
- Lesson 7 — Volume profile: point of control, value area, profile shapes, anchoring.
- Lesson 8 — VWAP and anchored VWAP: fair value, standard deviation bands, and how it differs from a moving average.
- Lesson 9 — The levels I actually trade: the handful worth marking, out of the hundred you could draw.
- Lesson 10 — Absorption, exhaustion, icebergs, imbalance and traps: the vocabulary of the market.
- Lesson 11 — The entry model: the exact trigger, the candle shape, and the blockers that stop me taking a trade even when everything else looks perfect.
- Lesson 12 — CVD: how divergence warns you before a move dies.
- Lesson 13 — Fair value gaps with order flow: which gaps hold, which fail, and how to tell in advance.
Part 3 — Trading (lessons 14–16)
This is where most courses stop and most traders break.
- Lesson 14 — Risk, drawdown and psychology. Everyone skips it. It is also the reason most people with a working method still lose money.
- Lesson 15 — Day trading crypto with order flow. From analysis to a live order, starting small.
- Lesson 16 — Trade management. What to do after you are in, and the situations where "going risk free" quietly costs you money.
Notice the order: analysis, then technique, then trading. Most people do it exactly backwards — they open an account, start clicking, lose money, and then go looking for a method. By that point they are impatient, they are bruised, and they are trying to learn while they are bleeding. Nobody learns well while they are bleeding.
Free footprint charts, in your browser
Standard footprint charts, market replay and paper trading are all on the free plan. No download, no data-feed bill, no workstation. Create a free account → · Compare plans
Which markets does this work on?
Any market where you can see its order flow. That is the entire condition.
Order flow is not a crypto technique. It is a description of how any auction market works — futures, equities, indices, commodities, FX where real volume data exists, and crypto. Buyers and sellers meet in an order book, aggressive orders consume passive orders, and a price prints. The mechanics are identical everywhere. The CME's material on auction market theory describes the same process in listed futures that you will see on a crypto perpetual.
There is one practical constraint: liquidity.
Order-flow analysis is only as good as the volume underneath it. On a market where fifty trades happen an hour, a footprint chart tells you nothing — there is nothing in there to read. On a market with constant, heavy, two-sided activity, the footprint is rich and the readings mean something.
That is why this course runs on major crypto pairs and high-volume perpetual futures. Not because crypto is special, but because it is liquid, it trades 24/7, and the data is available to a retail trader without an expensive professional feed.
If your goal is index futures or equities, everything here transfers directly. You change the symbol and the level map. The reading is the same.
One warning about crypto specifically: the market never closes. That is an advantage and a trap. The advantage is that you can practise on your own schedule instead of waiting for a session open. The trap is that there is always a trade available, so there is never a moment where the market forces you to stop. Lesson 14 deals with that properly.
How long does it really take to become profitable?
Six months to two years. For most people, consistency shows up somewhere around the two-year mark. That is not false modesty and it is not a sales-resistant conservative estimate — it is what the mechanics produce. Here is why.
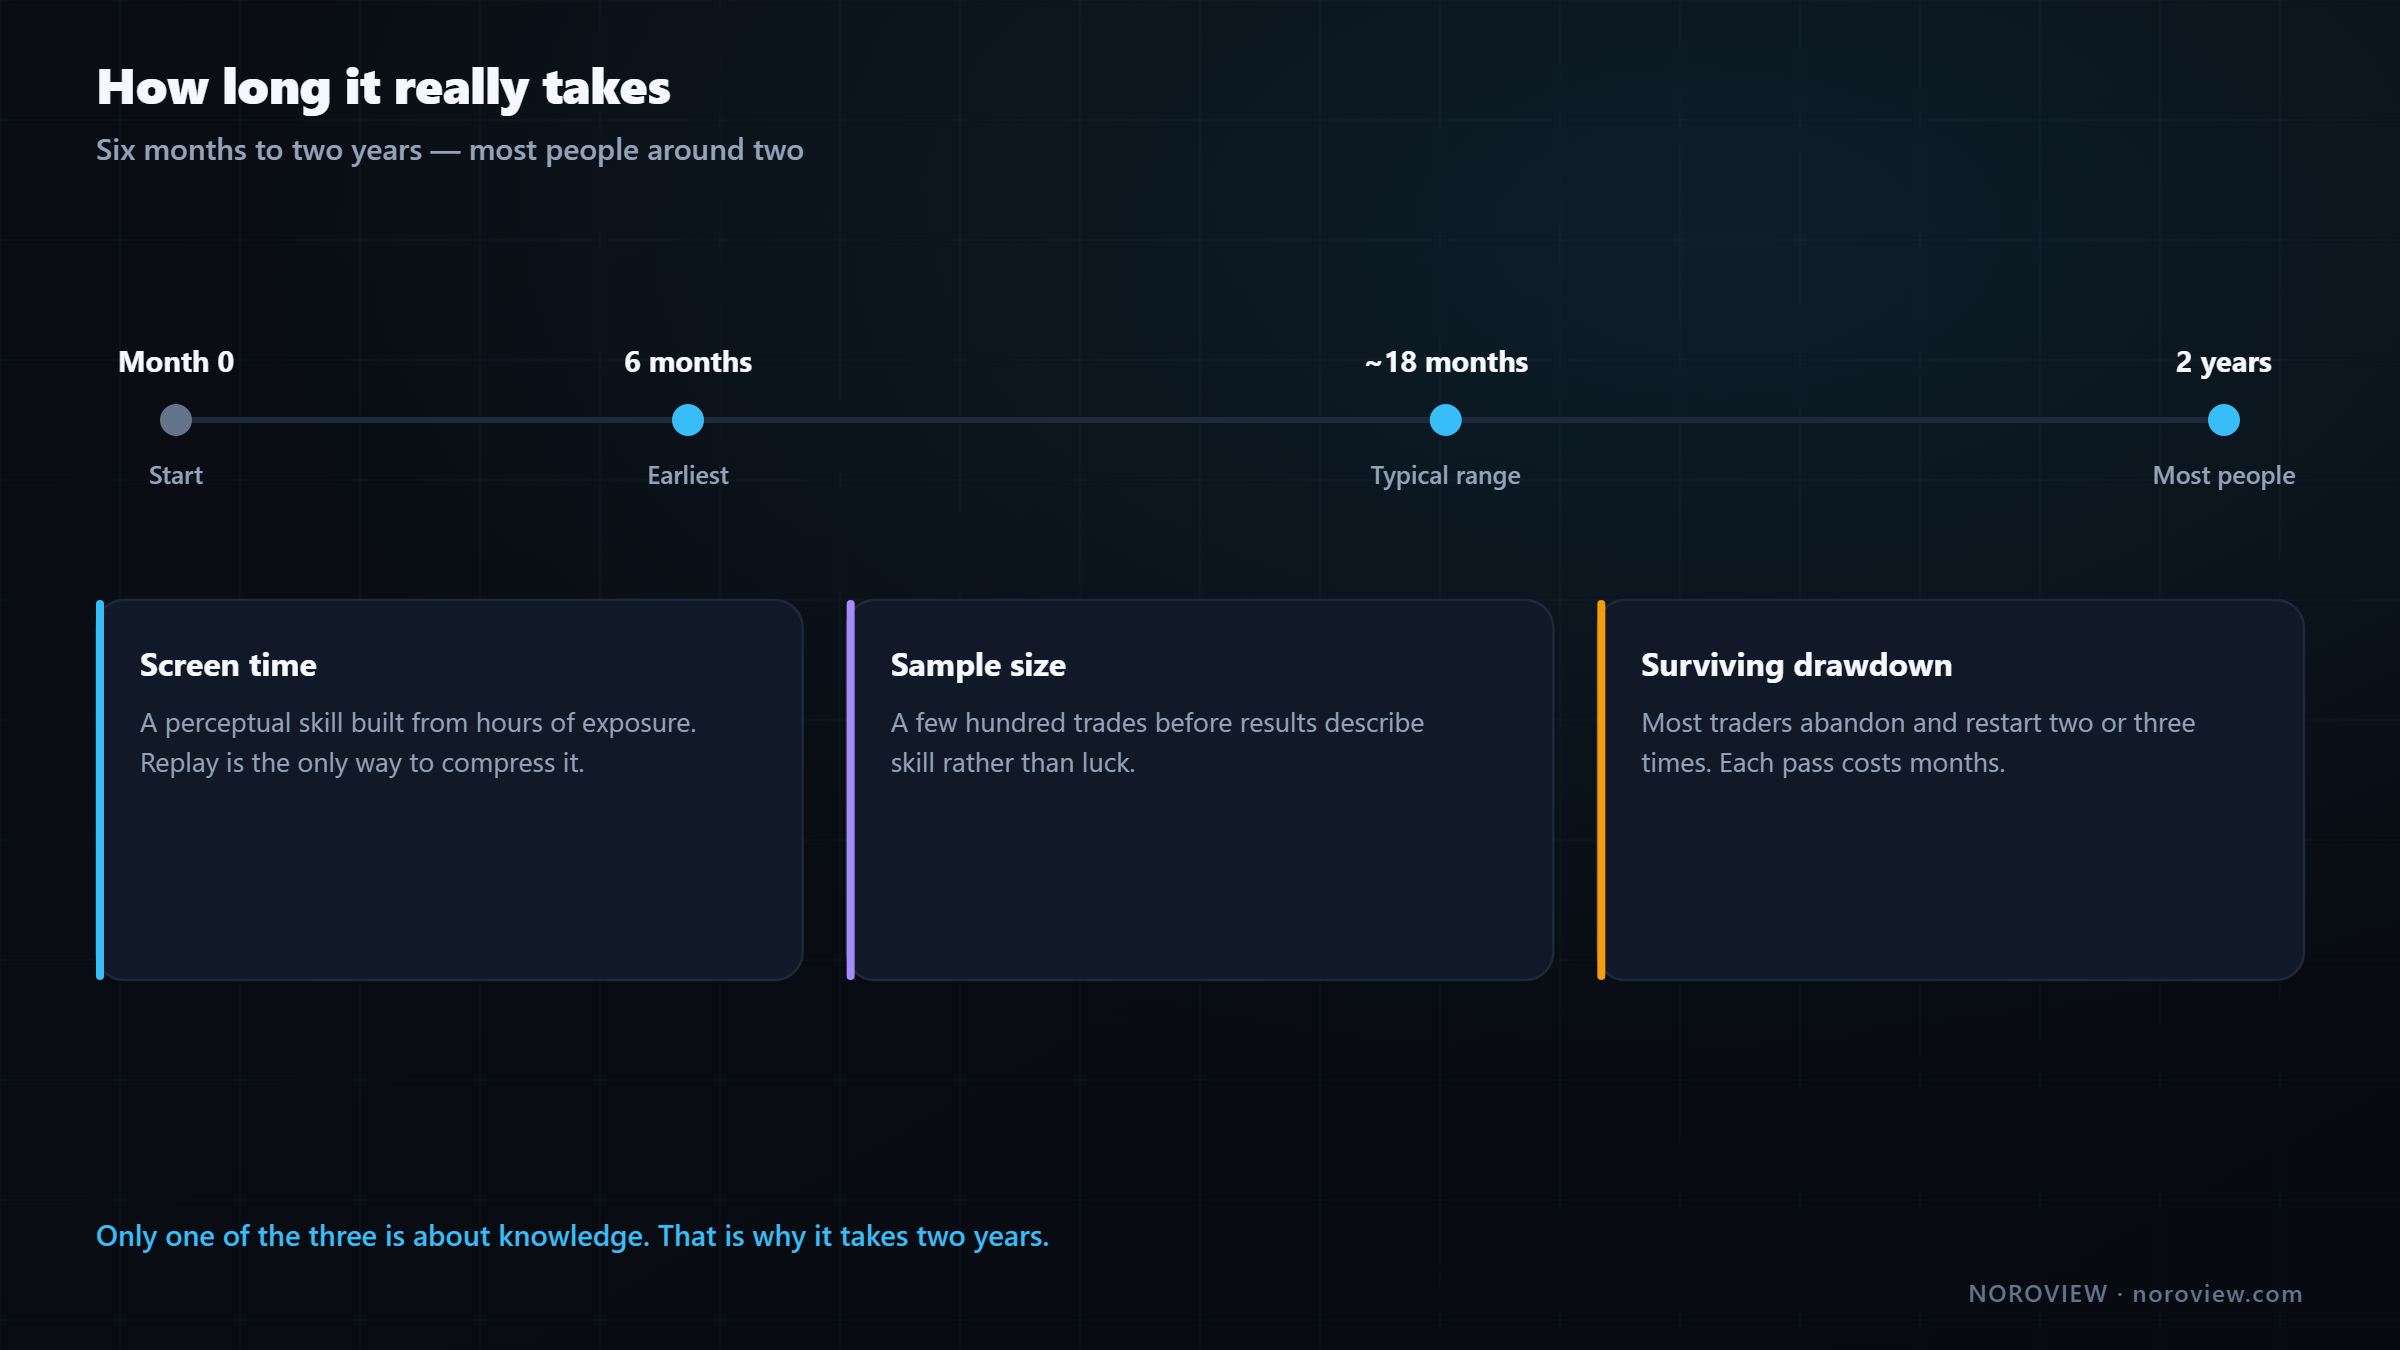
1. Screen time
Reading order flow is a perceptual skill, closer to hearing an accent than to solving an equation. Nobody learns a language from twelve videos. You learn it from hours of exposure, until the patterns stop being things you calculate and start being things you notice. There is no way around volume of exposure — which is why I will keep pushing you toward market replay rather than more reading. Replay is the only way to compress screen time, because you can run a month of market in an afternoon.
2. Sample size
Even if your method is genuinely good, twenty trades tells you nothing. A positive-expectancy method can easily lose money over twenty trades. It takes a few hundred before your results describe your skill rather than your luck. At three or four trades a day that is months. At three trades a week it is over a year.
3. Surviving a drawdown
This is the one nobody prepares you for. Every method, including the good ones, has losing streaks. You will have a week where nothing works and a run of six or seven losses. The first time it happens you will conclude the method is broken, change everything — and now you are back at the beginning with a new method and no sample size.
Almost every trader goes through that loop two or three times. Each pass costs months. That is the real reason it takes two years.
The published numbers are worse than you think
This is not just my experience. The academic record on day trading is consistently grim:
- A study of the Brazilian futures market by Chague, De-Losso and Giovannetti (2020) tracked every individual who began day trading equity futures over a multi-year period. Of those who persisted for more than 300 days, the overwhelming majority lost money, and only a tiny fraction earned more than a bank teller's salary.
- European regulators require CFD brokers to publish the share of retail accounts that lose money. Those disclosures have consistently sat in the 74–89% range, which is why ESMA introduced its retail intervention measures in the first place.
I am not showing you those to be discouraging. I am showing you because the honest baseline is the only thing that makes a two-year timeline sound reasonable instead of pessimistic.
So here is the most practical rule in this article: do not quit your job. Do not try to pay rent from trading. And do not tell yourself you will "make it work" because you need it to work — needing it to work is the single most destructive state you can trade in. Every bad decision in trading comes from pressure, and the largest source of pressure is needing this month's profit to cover this month's bills. Trade beside your income, not instead of it.
How much can you realistically earn?
A monthly return between roughly 5% and 15% is a reasonable target for a competent retail trader running proper risk management. It is not guaranteed, and it will not happen every month. Some months you will do better. Some months you will lose. Only the average matters, and only over a long sample.
Now let me take the shine off that immediately, because your brain has already started compounding it.
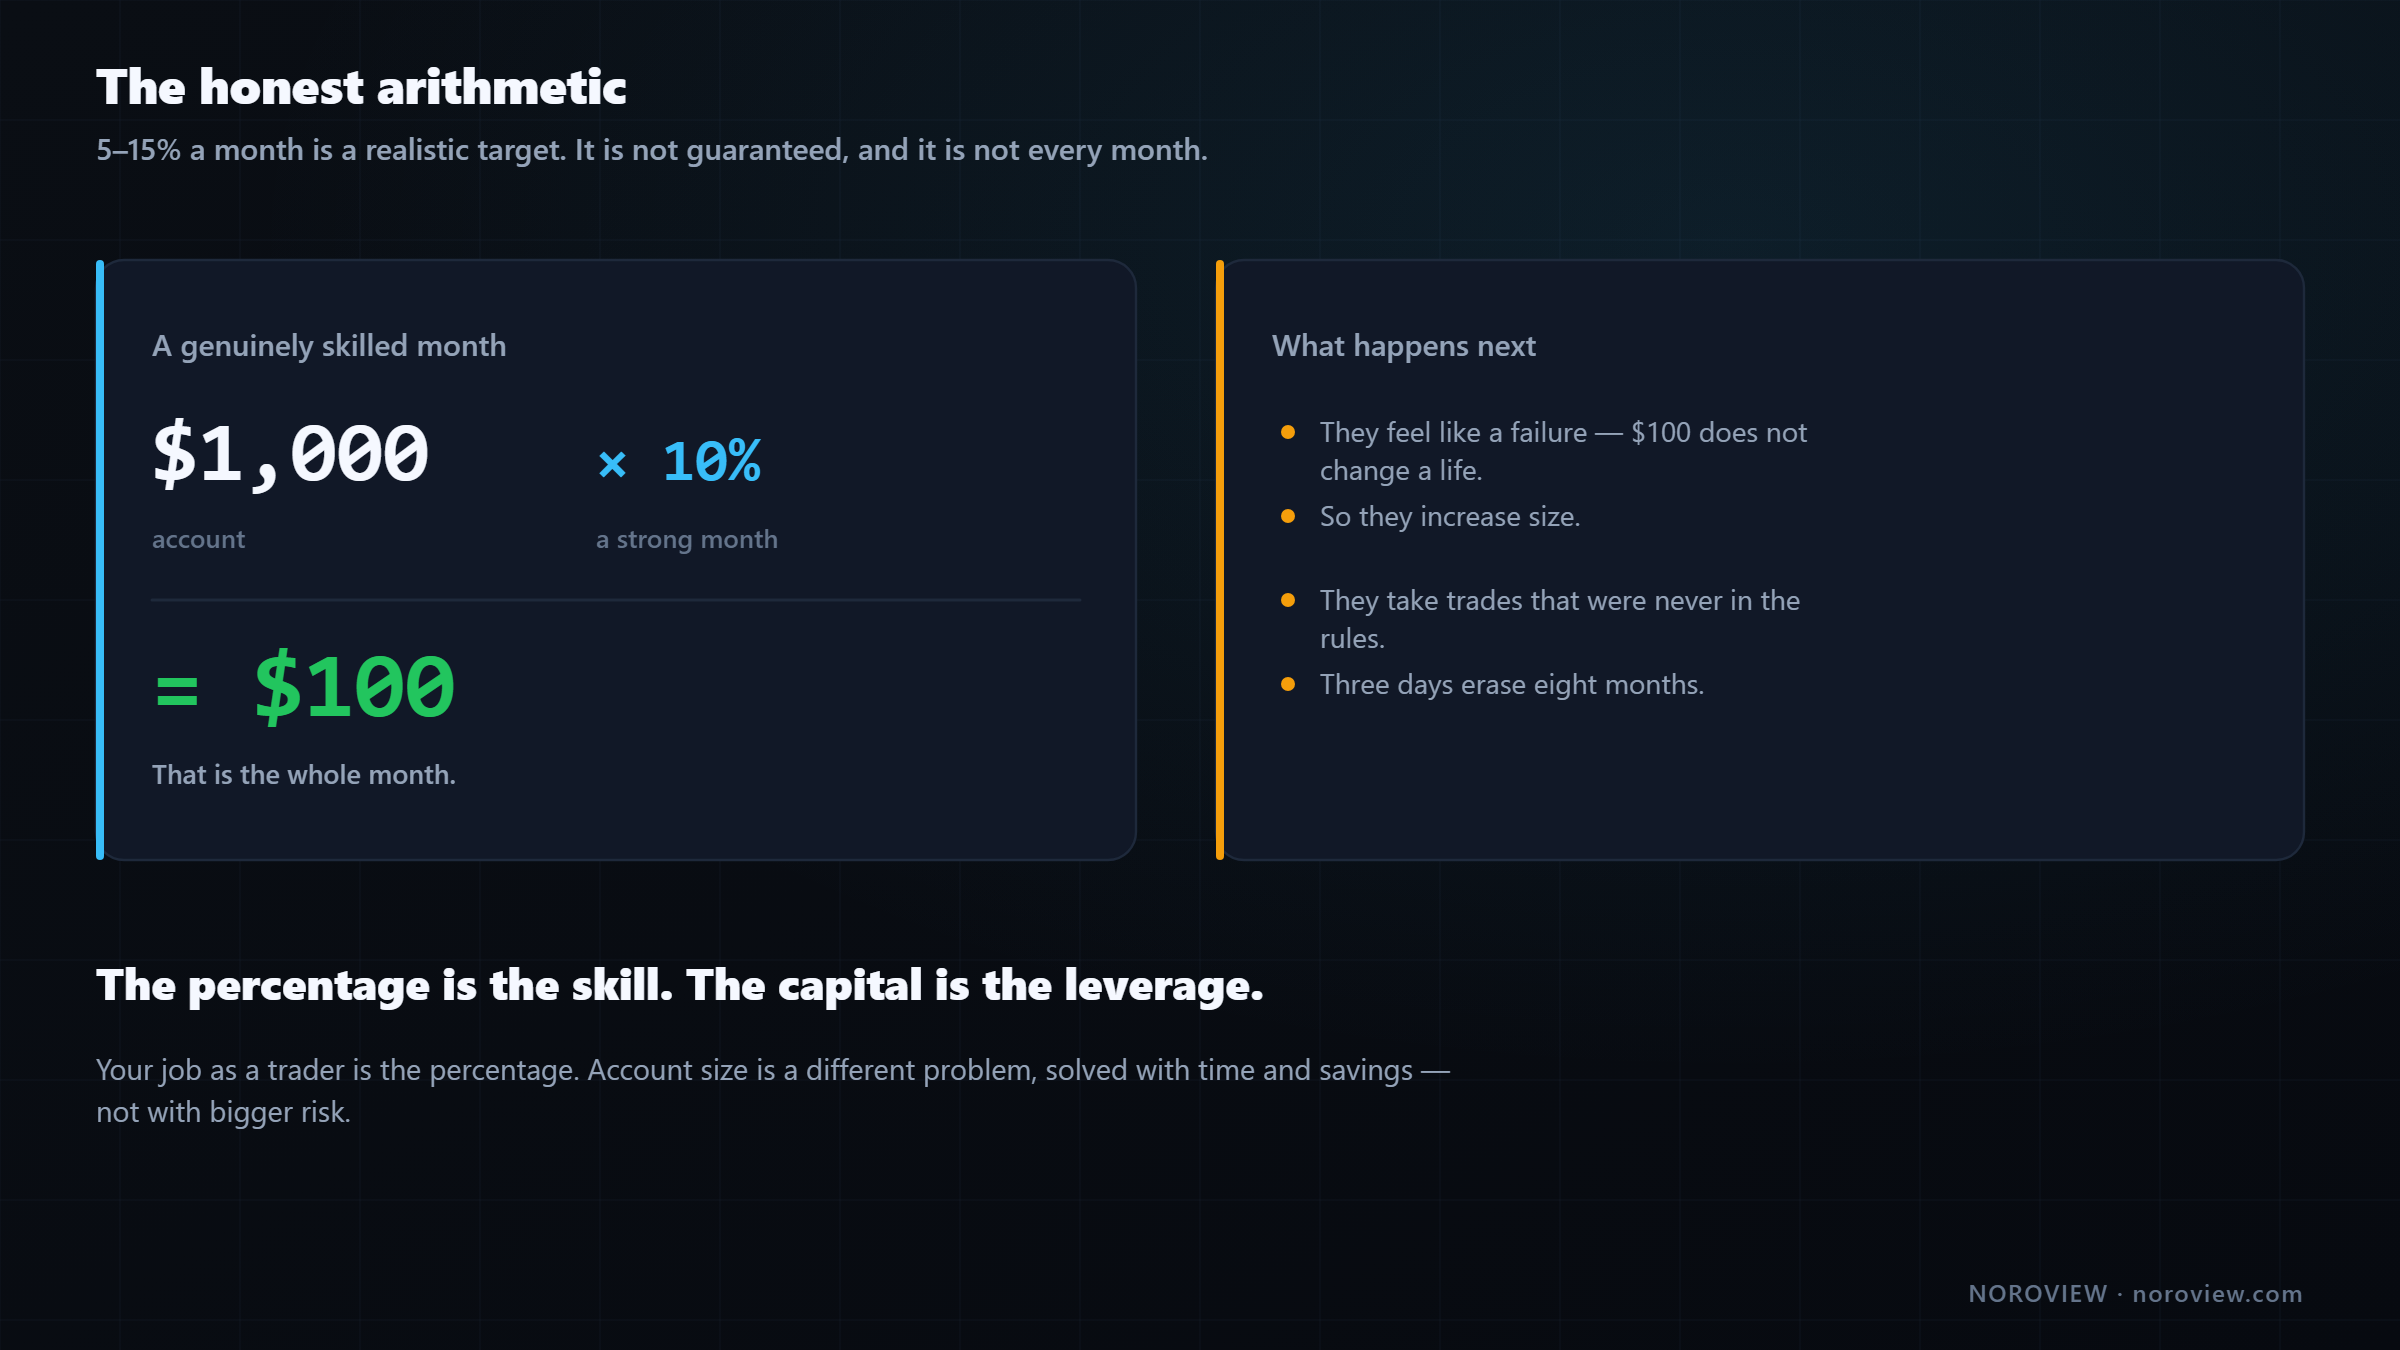
10% in a month on a $1,000 account is $100.
That is a good month. That is a genuinely skilled month. And it is one hundred dollars.
This is the part that breaks people. They learn the skill properly, they execute properly, and then they look at the money and feel like a failure, because $100 does not change anyone's life. So they increase size. They take trades they should not take. And they destroy in three days what took eight months to build.
Get this clear:
The percentage is the skill. The capital is the leverage.
Your job as a trader is the percentage. Account size is a completely different problem, and you solve it with time, savings, and eventually other people's capital. If you try to solve a small-account problem with big risk, the market removes you. Every time.
About the screenshots
500% in a month. $10,000 from one trade. An account that went from $1,000 to $50,000. Two things are true about almost all of them.
One: you are usually looking at the surviving screenshot out of ten accounts someone opened. That is a lottery winner, not a method. Nobody posts the nine that blew up.
Two: even when they are real, the behaviour that produced them is gambling, not trading. Those returns come from enormous position size relative to the account — and that exact same behaviour, run forward a few more weeks, ends at zero with near-certainty. A strategy that can make 500% in a month can lose 100% in a week. It only has to happen once.
What actually produces 5–15%
Three things, none of them exciting:
- Discipline — you follow your own rules on the day you do not feel like it.
- Risk management — you decide the maximum loss before the trade, and it is small relative to the account.
- Capital management — you always know your total exposure and you keep enough in reserve that a bad week is an inconvenience rather than an ending.
Those three, applied to a method with a real edge, produce boring, repeatable percentages. Boring is the goal. Boring is what a professional account looks like. All three get a full treatment in lesson 14.
Who this course is for
Complete beginners. You have never traded, maybe never opened a chart. That is genuinely fine — in some ways you are better off, because you have nothing to unlearn. This course starts at zero: what a bid and an ask are, how a candle is built. Every term is defined the first time it appears.
Traders who already have a method. You trade price action, supply and demand, ICT concepts, or classical technical analysis, and it partly works. You are not here to start over, and you should not start over.
For you, order flow is not a replacement — it is a confirmation layer. You already know how to find the place where you want to trade. Your problem is not location; it is that you cannot tell which of those locations will actually hold, so you take all of them and the failures eat the winners.
Order flow answers exactly that one question: price arrived at your zone — did real size step in, or did nothing happen? Adding that single filter to a method that already finds good locations is usually the largest improvement available to an intermediate trader. You do not change your strategy. You change what gets a green light.
Who this is not for: people looking for signals to copy, people who want to be told what to buy, and people who want a system that removes the need to think. That does not exist, and if it did, the person who had it would not be posting it.
Common mistakes beginners make in their first month
- Trading real money while still learning. The urge peaks right after footprint charts click, around lesson 4. That feeling is real, it is early, and it is expensive.
- Adding more indicators to fix a lagging indicator. Six lagging tools do not average out into a leading one.
- Judging a method on twenty trades. That is a coin-flip-sized sample. You are measuring luck.
- Trading illiquid markets because the footprint "looks cleaner." It looks cleaner because there is nothing in it.
- Sizing up after a good week. The good week is a sample, not a promotion.
- Skipping the psychology material because it feels less technical than the charts.
- Watching instead of practising. Twenty replay sessions beat twenty videos, every time.
How this looks in NOROVIEW
You do not need a paid plan, an expensive data feed, or a dedicated workstation to start. Everything in the first several lessons runs on a free account in a browser tab.
- Footprint chart — free for every user. Top bar → Chart → Footprint. Remember to zoom in on both axes; the cells are not visible at default zoom.
- Market Replay — the practice engine. Top bar → Replay. Pick a date, or use Random moment to get dropped somewhere unbiased. It replays the order flow, not just the candles, which is the whole point. There is a blind practice mode that hides all dates so nothing anchors your bias, and a prediction game that forces you to commit to a read instead of hindsight-trading.
- Paper trading — a live-market simulator you cannot game. Trades fill only on the live market in real time, timestamps are server-stamped, and the account economics are fixed when you create it. There is no deposit button and no withdraw button, and closed trades can never be edited or deleted. That is exactly why the track record means something.
The NORO Footprint — the customisable multi-column version — is a paid upgrade, as are the advanced and smart order-flow indicators. Which features sit on which of the four plans (Free, Basic, Pro, Master) is on the pricing page.
Your homework
Thirty minutes. Do it before you read lesson 2.
- Get a paper notebook and keep it next to your computer for the whole course. That is your trading journal, and it starts today — before you have taken a single trade.
- On the first page, answer three questions honestly. Why do I want to trade? How much money could I genuinely lose without it changing my life? What is my deadline, and where did that deadline come from? Write them down and date the page. We come back to it in lesson 14, and it will be uncomfortable. That is the point.
- Block four hours a week in your calendar. Not "when I have time" — actual blocks with actual times. The people who finish courses are the ones who scheduled them.
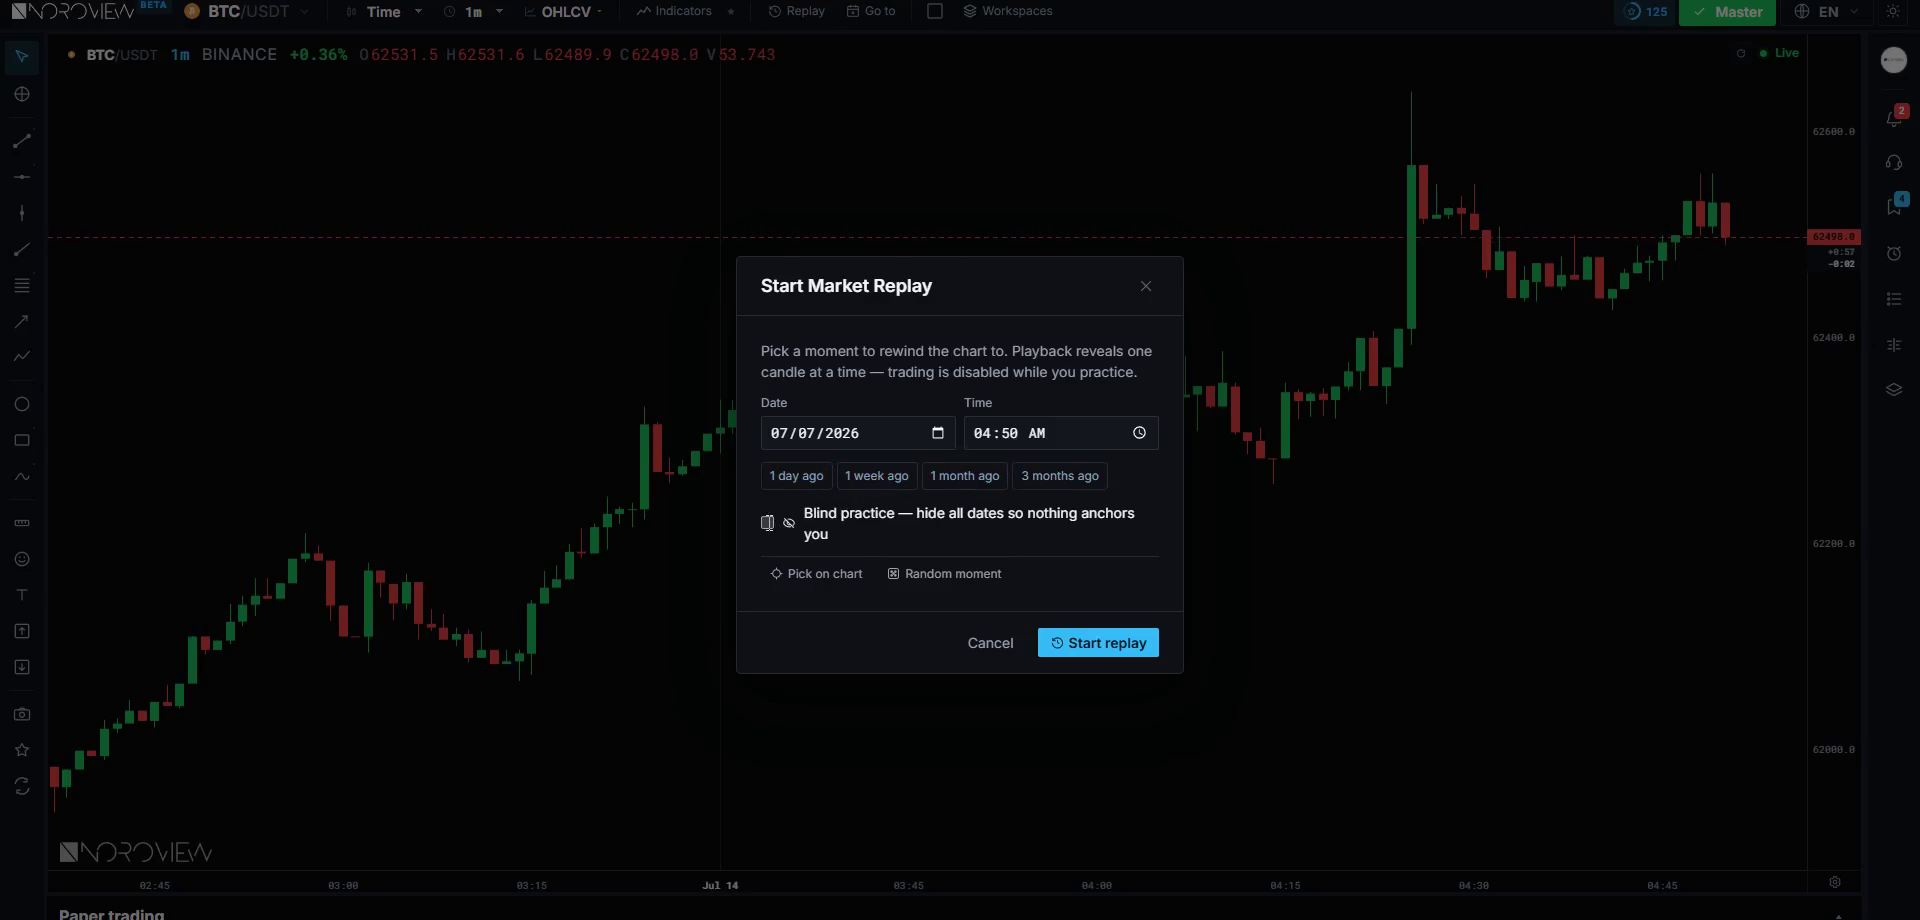
Open Market Replay and run your first session →
The one rule for this course
Do not trade real money yet.
Not this week. Not after lesson 4 when the footprint clicks and you feel like you can suddenly see the matrix. I will tell you exactly when to start, exactly how, and exactly how much — that is lesson 15, and we start with $100.
The $100 is not a joke and it is not about the money. It is chosen for a psychological reason: small enough that losing it does not affect your life, real enough that your hands still shake slightly. That combination is the only way to learn how you behave with real money at risk. Paper trading teaches you the method; it cannot teach you what your own body does when you are down 3% and the candle is still moving against you.
Three things to remember
- Order flow is not another indicator. Indicators are calculated from price. Order flow is what makes price.
- Six months to two years, most people around two. 5–15% a month is the realistic target, not guaranteed. Do not quit your job and do not compare yourself to a screenshot.
- Analysis, then technique, then trading — and no real money until lesson 15.
← Previous: (this is the first lesson) · Course index: Order Flow Trading Course · Next → Level 1 vs Level 2 Market Data
Frequently asked questions
Is order flow trading worth it for beginners? Yes, if you treat it as a confirmation layer rather than a shortcut. Order flow tells you whether real size defended a level or whether nothing happened there. It does not predict direction on its own, and it takes months of screen time to read fluently. Beginners benefit most because they have no lagging-indicator habits to unlearn.
How long does it take to become a profitable trader? Realistically six months to two years, with most people reaching consistency around two years. Three things set that clock: hours of screen time to build pattern recognition, a few hundred trades before results describe skill rather than luck, and surviving two or three drawdowns without abandoning the method.
What is a realistic monthly return from day trading? Roughly 5–15% a month is reasonable for a competent retail trader with disciplined risk management — not guaranteed and not every month. On a $1,000 account, a strong 10% month is $100. Returns far above that range generally come from position sizing that also produces total account loss.
Why do most day traders lose money? Mostly position sizing, sample size and psychology rather than analysis. Published research on retail day traders consistently finds the large majority lose money over time. The common pattern is a small edge destroyed by oversized positions, method-switching during normal drawdowns, and trading under financial pressure.
Do I need Level 2 data to day trade? You do not strictly need it, but without it you are working from a fraction of the available information. Level 1 shows only the best bid and offer; Level 2 shows the resting orders behind them. Lesson 2 covers the difference and what each one is actually good for.
Can I learn order flow trading on my own? Yes. The concepts are learnable from good material, but the perceptual skill only comes from screen time. Market replay is the single most efficient way to build that on your own, because it compresses weeks of live market into an afternoon and lets you replay the same setup repeatedly.
Which markets can you trade with order flow? Any market with genuine volume data and enough liquidity — futures, equities, indices, commodities, and crypto. The mechanics are identical everywhere. The practical filter is liquidity: a market with too few trades produces a footprint with nothing in it to read.
Sources
- Chague, F., De-Losso, R. & Giovannetti, B. (2020). Day Trading for a Living? — SSRN
- European Securities and Markets Authority — retail investor protection measures on CFDs
- CME Group Education — auction market theory and market profile
Soroosh Moghimi — six years inside financial markets: algorithmic trading, HFT, crypto and AI, after a decade building startups. He publishes this course free because he already paid for the lessons in it. There is no paid course and no signal group. @sorooshmoghimi · About
Start reading real order flow
You cannot learn this from a candlestick chart, and you do not need to spend a cent to begin. The standard footprint chart is free for every NOROVIEW user, market replay is free, and the paper-trading simulator is free.
Open NOROVIEW free → · Compare plans →
⚠️ DISCLAIMER — EDUCATIONAL CONTENT ONLY
This article is for educational and informational purposes only. It is not financial, investment, or trading advice, and nothing in it is a recommendation to buy, sell, or hold any asset. Trading cryptocurrencies and leveraged derivatives is high risk and can result in the loss of some or all of your capital. Only risk money you can afford to lose. Any levels, indicators, signals or results shown are illustrative and are not a promise or prediction of future performance. Charts may be shown on a demo or paper-trading account and do not represent real trades or returns. Always do your own research. You alone are responsible for your decisions.
Keep reading
Related posts

16. Trade Management: Break-Even, Partials and Trailing Stops
Trade management explained: when break-even stops cost you money, partial exits, four kinds of trailing stop, the order-flow exit, and diagnosing yourself with MFE and MAE.
15. How to Day Trade Crypto With Order Flow (Starting Small)
How to day trade crypto with order flow: exchange security, spot vs perpetuals, leverage and liquidation, order types, fees, and an honest $100 starting plan.

14. Risk, Drawdown and the Mind: Day Trading's Real Edge
Day trading risk management and psychology: position sizing math, drawdown recovery arithmetic, hard limits, decision vs outcome, and the five states that break traders.
13. Fair Value Gaps, Confirmed With Order Flow
Most fair value gaps do nothing. Five order-flow checks that tell you in advance which FVGs are worth trading and which are decoration.
5. Market Structure and Trend: How to Pick Your Side Objectively
How to identify market structure objectively: higher highs and higher lows, swing point rules, impulse vs correction, and the arithmetic behind trading with the trend.
11. My Order Flow Entry Model, Step by Step
A complete order flow entry model: the four conditions, the exact trigger candle, the value-area filter, and the ten-item blocker list that vetoes a trade.
Discussion (0)
Want to join the discussion? Comments live inside the platform.
Open NOROVIEW